 Open access
1. Introduction
The term remote sensing was first used in the 1960s. Remote sensing is the science of obtaining information about objects or areas from a distance, usually from aircraft or satellites [1]. It is measuring or obtaining information about some characteristics of a phenomenon in a recording device that does not come into direct contact with the phenomenon that we are studying. It is the process of collecting data in the waves between the ultraviolet and the radio range.
2. Earth observing system (EOS)
The Earth Observing System (EOS) is a program of the United States National Aeronautics and Space Administration (NASA) consisting of a science component, a large advanced data system, and a space technology component consisting of a series of polar orbits and intermediate orbits. Tilt satellites for long-term observation of the Earth as an integrated long-term observing system include observations of the Earth’s surface and features, biosphere, atmosphere, cryosphere, and oceans [2].
3. Advanced remote sensing
Advanced Remote Sensing is an application-based digital reference that provides a single source for the mathematical and physical concepts needed to collect and assimilate remote sensing data. It offers the latest advanced space technologies and technologies to estimate Earth’s surface variables from a variety of data types, including optical and laser sensors such as RADAR and LIDAR.
Scientists in a number of different fields, including geography, geology, geophysics, atmospheric sciences, environmental sciences, planetary sciences, engineering, and ecology, have almost unlimited access to critically important data from remote sensing techniques, their developments, and applications [3].
4. The importance of remote sensing
All types of remote sensing: aerial photographs, satellite views, radar, LIDAR etc. are very important and provides abundant information about the Earth. They help to continuous surveillance of land and resources.
Examples of the importance of remote sensing:
Study of sustainable natural resources
Assessment of natural hazard
Production of digital maps
5. Components of a remote sensing system
The remote sensing system that uses
Source: the source of electromagnetic radiation may be sunlight or heat.
Interaction with Earth’s surface phenomena: depends on the amount of reflected or transmitted radiation.
Interaction with the atmosphere: where the energy passing through the atmosphere is affected.
Sensors: recording radiation after its interaction with the Earth’s surface and atmosphere.
6. The importance of remote sensing in geography
Monitoring the spatial distribution of terrestrial phenomena within a wide framework.
Studying changing phenomena such as floods and traffic.
Permanent recording of phenomena so that they can be studied at any time later.
Recording data that the naked eye cannot see, as human eyes are sensitive to visible rays.
Making quick and accurate measurements to a large extent for distances, areas, and heights.
7. Application of remote sensing
Remote sensing has a wide range of applications and benefits in many different fields and study areas:
Coastal applications: Permanent, dynamic, and long-term monitoring of shoreline changes; tracking sediment transport; and mapping coastal features and descriptions. The data can be used in coastal surveying, mapping, and erosion prevention methods.Ocean applications: Monitoring of ocean circulation and current systems, measuring ocean temperature and wave height, and tracking sea ice. The data can be used to better understand the oceans and how to best manage ocean resources.Natural disasters and hazard assessment: Tracking hurricanes, strong seismic events and earthquakes, erosion, and flooding. Data can be used to assess the impacts of a natural disaster due to climate crises and create preparedness strategies to be used before and after a hazardous event.Natural and cultural heritage preservation and management: Monitoring land use, mapping wetlands and charting wildlife habitats. Data can be used to minimize the damage that urban growth has on the environment and archeological sites and help decide how to best protect natural and heritage resources.Egypt is particularly vulnerable to the impact of climate crises resulting from current and future climate change and variations. Climate change leads to an increase in the number and impact of natural disasters and hazards and their devastating impact on our natural and cultural heritage sites in Egypt.
The increase in the number of risks and hazards related to climate change crises has exposed the cultural and natural heritage sites in Egypt to a greater danger than ever before, which imposes new challenges on conservation scientists and conservators to preserve the urban historic fabric and the built heritage in Egypt [4].
Water: Egypt suffers from a shortage of water and difficulty in obtaining it. Remote sensing methods help in exploring groundwater locations and earthed and hidden water channels.Minerals: Sensors work in exploring mineral and petroleum ores.Agriculture: Inventorying agricultural crops and long-term crop monitoring and detecting plant diseases and moisture of the land.Engineering works: Used in studying construction and urban projects in addition to the risk assessment through the stages of construction.
8. Torrential rain wreaks havoc in Libya
Hurricanes, commonly known as tropical cyclones, are low-pressure systems with organized thunderstorm activity that form over tropical or subtropical waters.
Hurricanes are large, swirling storms. They produce winds of 119 kilometers per hour (74 mph) or higher. This is faster than a cheetah, the fastest animal on Earth. Winds from a hurricane can damage buildings and trees.
Hurricanes form over warm ocean waters. Sometimes they hit the ground. When a hurricane reaches land, it pushes a wall of ocean water onto the shore. This wall of water is called a storm surge. Heavy rains and storm surge from a hurricane and can cause flooding.
Once a hurricane forms, meteorologists predict its path. They also anticipate how powerful it will be. This information helps people prepare for the storm.
Scientists do not know exactly why or how a tornado forms. But they know that two main ingredients are needed.
One of the ingredients is warm water. Warm ocean water provides the energy a storm needs to develop into a hurricane. Normally, the surface water temperature must be 26°C (79°F) or higher for a hurricane to form.
The other element is the wind, which does not change much in speed or direction as it rises in the sky. Winds that change a lot with height can tear through storms.
Heavy rains from a storm called Storm Daniel hit parts of the central and eastern Mediterranean, leading to devastating floods and massive loss of life in Libya, the worst-hit country, as well as in Greece, Turkey, and Bulgaria.
The Libyan Red Crescent Society announced that up to 10,000 people are missing, according to the International Federation of Red Cross and Red Crescent Societies. The number of victims was not immediately confirmed, but it is feared that thousands may have died after the waters resulting from the collapse of the dams flooded the city of Derna.
The National Meteorological Center in Libya said that the storm reached its peak in northeastern Libya on September 10, with strong winds whose speed ranged between 70 and 80 km/h, which led to a communications outage and the fall of electric towers and trees. Heavy rains ranging from 150 to 240 mm caused flash floods in many cities, including Al Bayda, which recorded the highest daily rainfall of 414.1 mm (from September 10, 8 a.m. to September 11, 8 a.m.). The National Center of Meteorology said that this was a new record for rainfall.
The Libyan Meteorological Authority said that entire neighborhoods in Derna disappeared, and their residents were swept away by water after two old dams collapsed, making the situation catastrophic and out of control.
The Libyan government declared 3 days of mourning in all affected cities. He described them as “disaster areas.”
According to the NASA Earth Observatory images by Wanmei Liang, using MODIS data from NASA EOSDIS LANCE and GIBS/Worldview, a Mediterranean cyclone contributed to deadly flooding along the Libya’s coastline.
Story by Emily Cassidy, http://earthobservatory.nasa.gov/about/Emily-cassidy
Published September 13, 2023 Data acquired September 10, 2023.
Source: Terra > MODIS [5] https://visibleearth.nasa.gov/images/151826/torrential-rain-wreaks-havoc-in-libya/151828w
The collapse of two dams upstream in Libya’s eastern city of Derna on Sunday night, the 10th of September, was the cause. The death toll from the catastrophic event has risen to over 8000 people, according to local officials.
Wadi Derna is a river valley in Libya that leads down from the Jebel Akhdar mountains to the port city of Derna. Like many other wadis in North Africa, it is an intermittent riverbed that for much of its length contains water only when heavy rain occurs [6]. It is 75 kilometers (47 mi) long [7] and drains a drainage basin of 575 km2.
In September 2023, against the backdrop of the civil war, the rainfall from Storm Daniel led to the collapse of two dams across the river, the Derna dam and the Mansour dam, causing catastrophic flooding in the city of Derna, which killed at least 11,300 people [8, 9, 10]. It was the second deadliest dam failure in history.
A quarter of Derna city was swept into the sea following Storm Daniel’s visit to the northern coast of Libya. The resulting flash flood swept away buildings, people inside them, and vehicles. The floods have also caused widespread damage to infrastructure, including hospitals, schools, and homes.
The World Food Programme has said that the floods could displace up to 100,000 people and could lead to a food crisis in the region (Figures 1–8) [11].
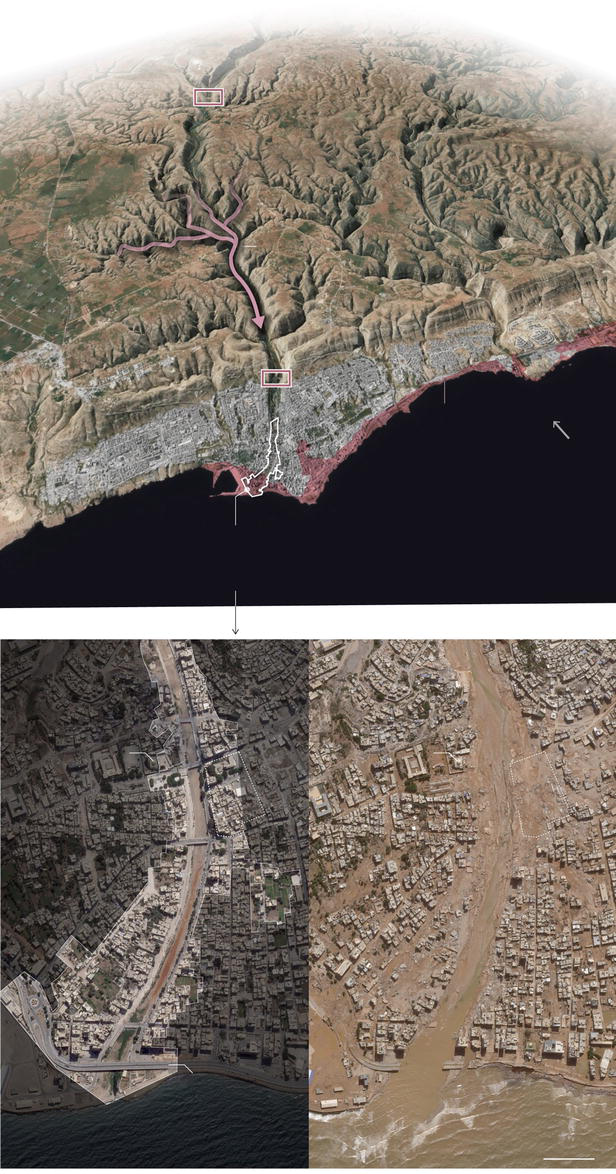
Figure 1.
Animation shows the Derna Valley in Lybia before the flooding Daniel. Source: European Space Agency (ESA).
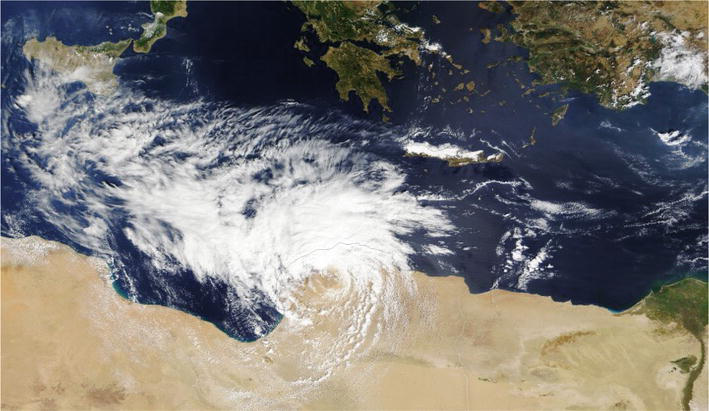
Figure 2.
Satellite imagery of the Libya flooding Daniel, September 2023.
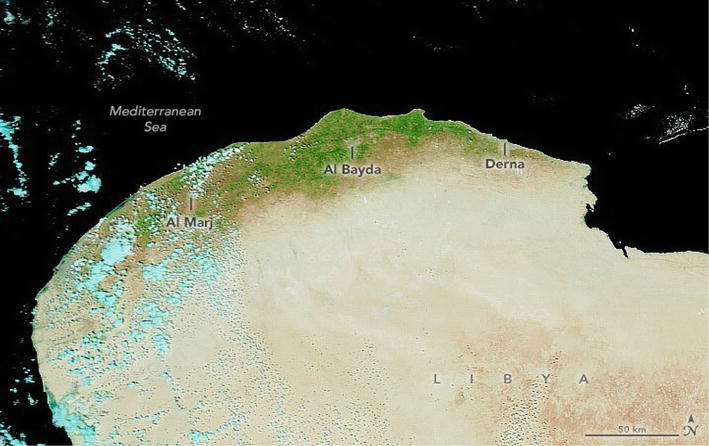
Figure 3.
Libya before flooding Daniel. Data acquired September 7, 2023.
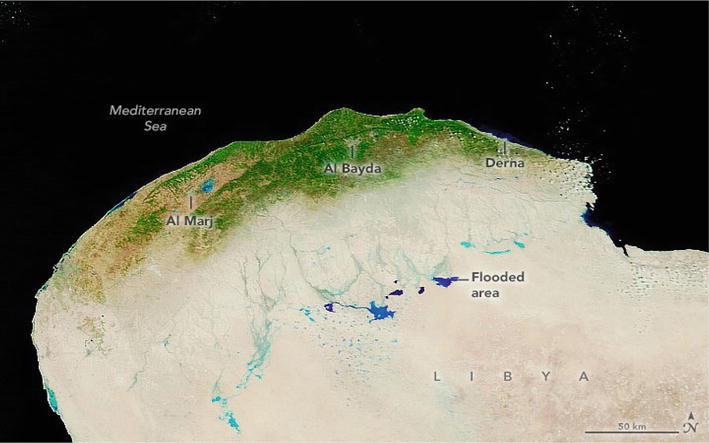
Figure 4.
Libya after flooding Daniel. Data acquired September 13, 2023.
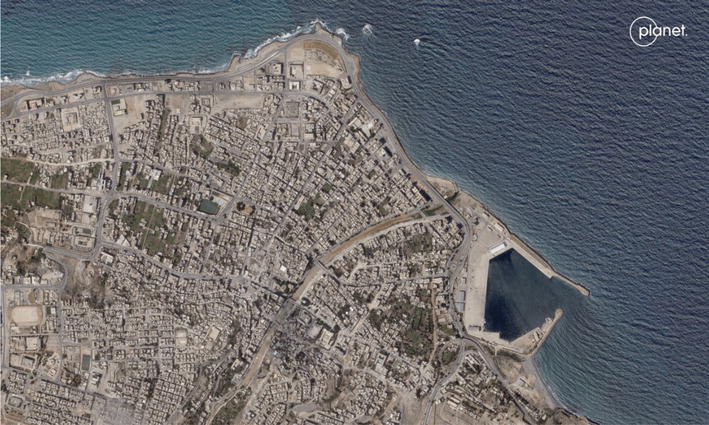
Figure 5.
Satellite imagery shows Libya before the flood havoc. Before Sunday night, September 10, 2023.
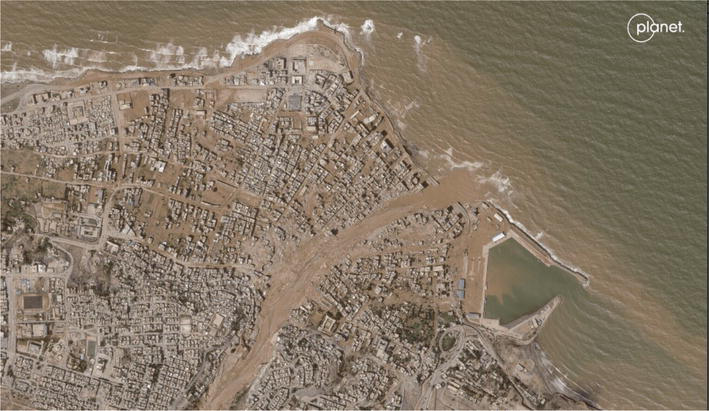
Figure 6.
Satellite imagery shows flood havoc in Libya. The collapse of two dams upstream in Libya’s eastern city of Derna on Sunday night, the 10th of September, was the cause. The death toll from the catastrophic event has risen to over 8000 people, according to local officials.
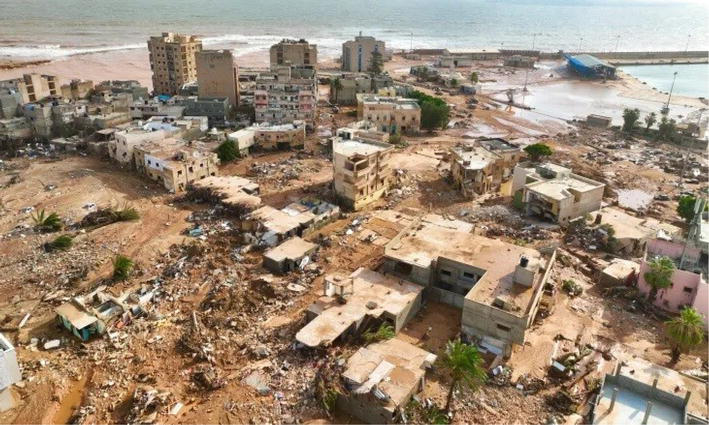
Figure 7.
Satellite imagery shows flood havoc in Libya. The collapse of two dams upstream in Libya’s eastern city of Derna on Sunday night, the 10th of September, was the cause. The death toll from the catastrophic event has risen to over 8000 people, according to local officials.
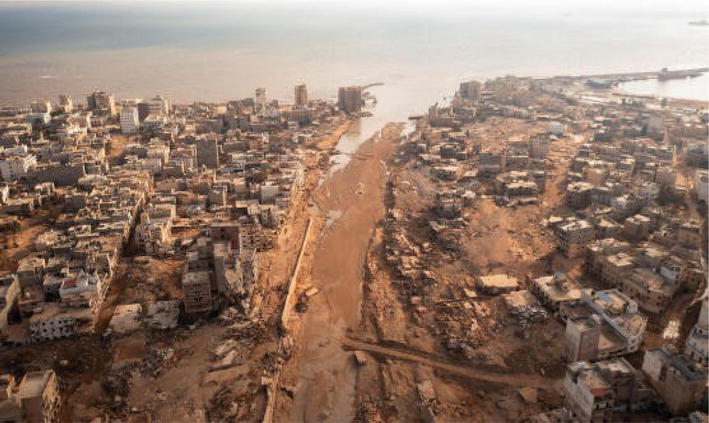
Figure 8.
Aerial view of Derna, Libya, on September 10–11, 2023. AYMAN AL-SAHILI/REUTERS.
9. Advanced remote sensing applications for preservation of Archeological sites
The Earth Observing System (EOS) platform is an advanced cloud platform that has been used to search, analyze, store and visualize geospatial data. This online digital platform provides powerful tools to search, process, and analyze the large amounts of satellite data generated. As a result, valuable insights allowed us to respond quickly to changes in our area of interest (Valley of the Kings (KV) in Luxor, Egypt).
ELiT (EOS LiDAR Tool) is a cutting-edge product based on complex algorithms for modeling and analysis of the urban environment. I presented the original cross-functional approach to processing LiDAR data in the Valley of the Kings.
DEM creates a digital elevation model—representing bare earth terrain with regularly spaced z-values. The DEM tool allowed us to build a digital elevation model that represents the bare terrain of the Valley of the Kings (KV). This topographic surface is based exclusively on the Airborne LiDAR Point Cloud and can be obtained in the form of either a DSM (Digital Surface Model) that includes buildings, woody vegetation, and other objects or a DTM (Digital Terrain Model) with all natural and human elements. Objects made above ground are removed. The topographic data used in this study is a digital elevation model where each cell consists of X and Y coordinate information and a Z evaluation (Figures 9–12) [12, 13, 14].
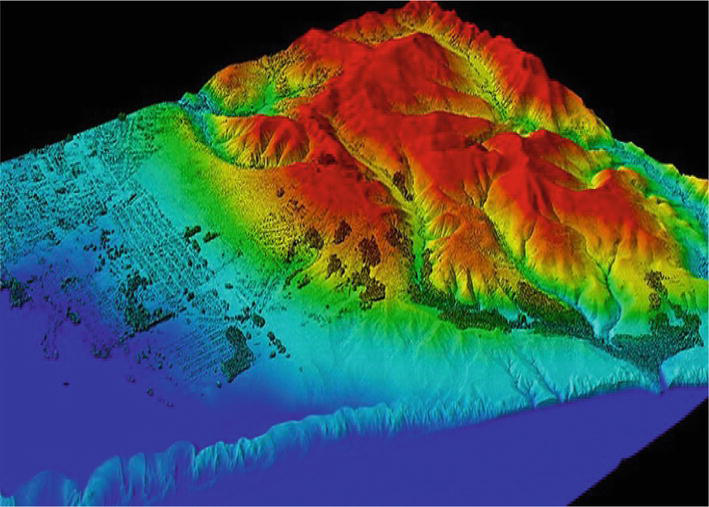
Figure 9.
A LIDAR (light detection and ranging) image.
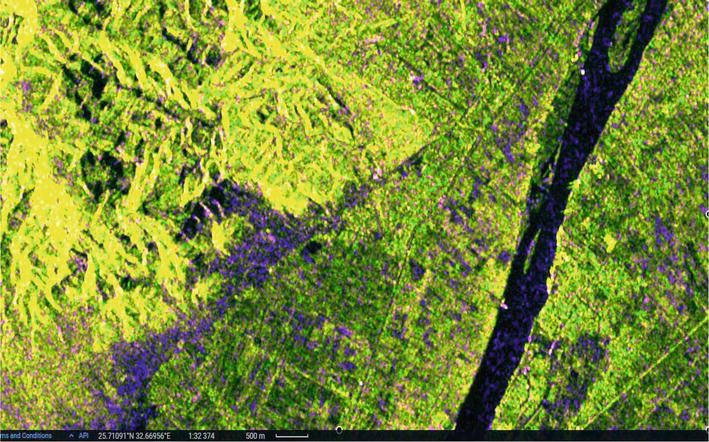
Figure 10.
LIDAR image; the ratio “VV, VH, VV/VH” combination works well for distinguishing water objects, open soils, moistened agricultural fields, vegetation, and urban areas.
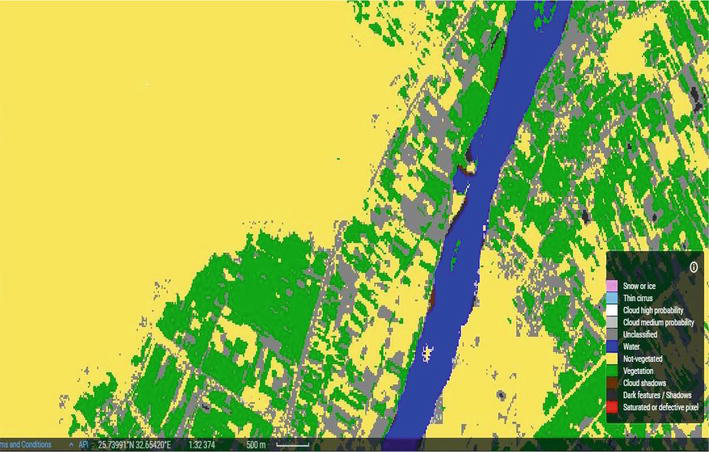
Figure 11.
The classification map that includes four different classes for clouds.
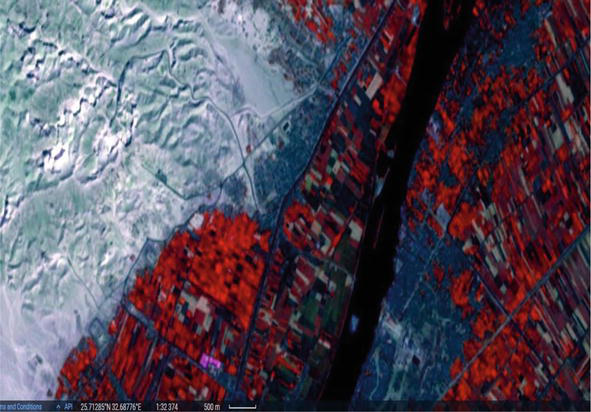
Figure 12.
This band combination is good for picking out land from water.
References
- 1.
Toure S, Diop O, Kpalma K, Maiga AS. Shoreline detection using optical remote sensing: A review. ISPRS International Journal of Geo-Information. 2019; 8 (2):75. DOI: 10.3390/ijgi8020075 - 2.
King MD, Platnick S. The earth observing system (EOS). Comprehensive Remote Sensing [Internet]. Vol. 1. 2018. pp. 7-26. [cited October 01, 2023]. Available from: https://ntrs.nasa.gov/citations/20180003045 - 3.
Butt MJ, Kelly R. Estimation of snow depth in the UK using the HUT snow emission model. International Journal of Remote Sensing. 2008; 29 (14):4249-4267. DOI: 10.1080/01431160801891754 - 4.
Hemeda S. Influences of bulk structure of Calcarenitic rocks on water storage and transfer in order to assess durability and climate change impact. Heritage Science. 2023; 11 :118. DOI: 10.1186/s40494-023-00949-w - 5.
Torrential Rain Wreaks Havoc in Libya. [Internet]. visibleearth.nasa.gov . 2023. [cited October 01, 2023]. Available from:https://visibleearth.nasa.gov/images/151826/torrential-rain-wreaks-havoc-in-libya/151828w - 6.
Mellen R, Karklis L, Granados S, Ledur J, Stillman D. Mapping Why Libya's Floods Were So Deadly. Washington, DC, US: Washington Post; 12 Sep 2023. [Accessed: September 13, 2023] - 7.
McBurney CBM, Hey RW. VII, Tufaceous deposits. Prehistory and Pleistocene Geology in Cyrenaican Libya. Washington, DC, US: Cambridge University Press; 1955. Available from: books.google.co.uk . ISBN:9780521056243 [Accessed: September 14, 2023] - 8.
Death Toll Hits 11,300 in Libyan City Destroyed by Floods. NBC News; 2023-09-14. [Accessed: September 15, 2023] - 9.
Bodies Wash Ashore in Libya as Devastated City Races to Count its Dead. NBC News; 2023-09-13. [Accessed: September 14, 2023] - 10.
Derna W. [Internet]. Wikipedia. 2023. Available from: https://en.wikipedia.org/wiki/Wadi_Derna - 11.
Jacob J. In pictures: Satellite imagery shows flood havoc in Libya. Geospatial World. 2023. [Internet] [cited October 01, 2023]. Available from: https://www.geospatialworld.net/prime/satellite-imagery-libya-floods/ - 12.
Hemeda S. Geo-environmental monitoring and 3D finite elements stability analysis for site investigation of underground monuments. Horemheb tomb (KV57), Luxor, Egypt. Heritage Science. 2021; 9 :17. DOI: 10.1186/s40494-021-00487-3 - 13.
Hemeda S, Sonbol A. Sustainability problems of the Giza pyramids. Heritage Science. 2020; 8 :8. DOI: 10.1186/s40494-020-0356-9 - 14.
Hemeda S. Engineering failure analysis and design of support system for ancient Egyptian monuments in valley of the kings, Luxor, Egypt. Geoenvironmental Disasters. 2018; 5 :12. DOI: 10.1186/s40677-018-0100-x