Open Access is an initiative that aims to make scientific research freely available to all. To date our community has made over 100 million downloads. It’s based on principles of collaboration, unobstructed discovery, and, most importantly, scientific progression. As PhD students, we found it difficult to access the research we needed, so we decided to create a new Open Access publisher that levels the playing field for scientists across the world. How? By making research easy to access, and puts the academic needs of the researchers before the business interests of publishers.
We are a community of more than 103,000 authors and editors from 3,291 institutions spanning 160 countries, including Nobel Prize winners and some of the world’s most-cited researchers. Publishing on IntechOpen allows authors to earn citations and find new collaborators, meaning more people see your work not only from your own field of study, but from other related fields too.
To purchase hard copies of this book, please contact the representative in India:
CBS Publishers & Distributors Pvt. Ltd.
www.cbspd.com
|
customercare@cbspd.com
An increased number of spectral channels in the visible to near-infrared region (VNIR) and short-wave infrared region (SWIR) in hyperspectral sensors help in the identification of distinct variations in minerals. Airborne Visible Infrared Imaging Spectrometer-Next Generation (AVIRIS-NG) hyperspectral sensor with 425 spectral bands is useful for mineral Constrained Energy Minimization (CEM), Spectral Angle Mapper (SAM), and Adaptive Coherence Estimator (ACE) advanced tools utilized to detect target minerals in the study area for mineral exploration. Minimum Noise Fraction (MNF), ACE, SAM and CEM advanced hyperspectral remote sensing techniques were applied to the AVIRIS-NG airborne data to map the kaolinite, dolomite, chlorite and hematite. In the MNF images, some areas are prominently highlighted and identified as areas of interest. CEM algorithm has classified the four minerals better than the ACE and SAM. The potential zones identified from the remote sensing data were verified, and abandoned old mines are present in three locations out of four. These locations are picked up well in different MNF images. In the mapped area, carbonate is present in the form of altered minerals in metabasalt, and iron leached surface indicates hematite mineral. The remote sensing outputs well also supported by the petrographic studies. The approach used in this study has great implications for mineral mapping.
*Address all correspondence to: nishargsi@gmail.com
1. Introduction
The search for mineral deposits has been a continuous endeavour throughout history. Due to the rapid rate of growth, known resources are depleting at a much faster rate, necessitating the development of novel strategies for the search and exploration of additional resources at an equally rapid rate. Incorporating advanced techniques to identify and delineate new hidden deposits has become increasingly difficult. Remote sensing techniques can fulfill the required demand to locate new potential zones of mineralization within a relatively short time.
With the advancement in remote sensing techniques from multispectral to hyperspectral, remote sensing has played a key role in the field of geosciences, especially in mineral exploration [1]. An increased number of spectral channels in the visible to near-infrared region (VNIR) and short-wave infrared region (SWIR) in hyperspectral sensors helps in the identification of distinct variations in minerals [2]. Alteration minerals associated with certain types of potential mineralized zones usually show their distinct features in the VNIR and SWIR regions (0.4–2.5 μm) of the electromagnetic spectrum [3]. As a result of the exclusive amalgamation of spatially contiguous spectra and spectrally contiguous images, hyperspectral remote sensors are able to map alteration minerals spatially. The spectral range 0.4–2.5 μm provides abundant information about a wide variety of Earth-surface minerals, and the 2.0–2.5 μm range covers spectral characteristics of hydroxyl-bearing minerals, sulphates, and carbonates that are found in many geologic units and hydrothermal systems [4]. For quantitative and qualitative analysis and mapping, hyperspectral sensors with coherent band parameters are vital [2].
Hyperspectral remote sensing techniques have been used to gather mineral information for over three decades, and its application in the Indian sub-continent is still at a nascent stage. There are several reasons why the hyperspectral technique is not widely used, and the main reason is lack of spatial and aerial coverage and another non-availability of the data. Airborne Visible Infrared Imaging Spectrometer-Next Generation (AVIRIS-NG) hyperspectral data was acquired over the Indian sub-continent in two phases by a joint mission of the Indian Space Research Organization (ISRO) and National Aeronautics and Space Administration (NASA) from 2015 to 2016 and 2018 to 2019. In the AVIRIS-NG data, there are about 430 narrow continuous spectral bands in VNIR and SWIR from 0.38 to 2.5 μm range at 5 nm intervals, and pixel resolution varies from 4 to 8 m for a flight altitude of 4–8 km for a swath of 4–6 km. AVIRIS-NG is a recent trend in airborne hyperspectral remote sensing that can be considered as the most advanced data for mineral identification and mapping [1]. In the present study, AVIRIS-NG acquired over the west of Gadag Schist Belt (GSB), Southern India, is analyzed for mineral mapping using advanced Minimum Noise Fraction (MNF), Constrained Energy Minimization (CEM), Spectral Angle Mapper (SAM) and Adaptive Coherence Estimator (ACE) techniques.
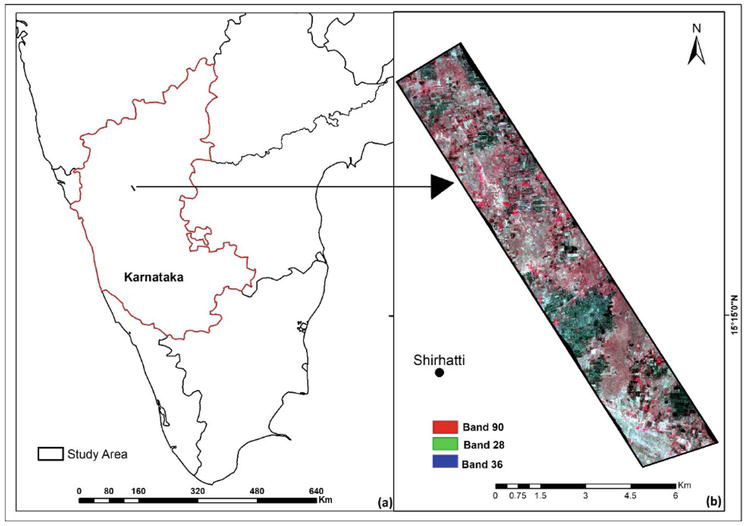
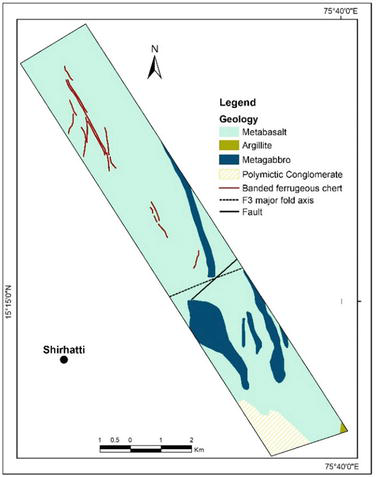
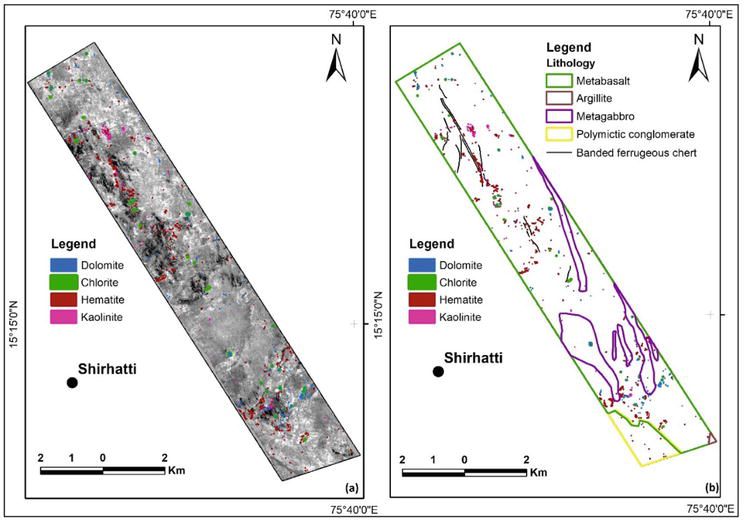
The study area is located west of Gadag Schist belt (GSB), Karnataka, India (150 12′ 0″ to 150 20′ 0” N and 750 34′ 0″ to 750 40′ 0″ E; Figure 1a). The study area is the geologically northern part of the Chitradurga Schist Belt (CSB) of Western Dharwar Craton (WDC) of Southern India [3]. The schist belt is mostly occupied by metabasalts, metavolcanics, granite gneiss, conglomerate, greywacke, argillic, and banded iron formation rocks [5]. The belt trends NW-SE in strike length of around 50 km with a maximum width of around 22 km is between Shirahatti in the west and Dambal in the east and is a site of ancient mining activity and old mines are located 15–25 km due south of the Gadag city [6]. Gold mineralization is associated with several prominent shears, striking NNW-SSE and is controlled by shears and marked by wall rock alterations [5]. Geological Survey of India (GSI) systematically explored the gold-bearing tracts in the western half of the GSB [6]. The study area is mainly occupied by the variants of metabasalt, metagabbro, polymictic conglomerate, argillite and banded ferrugenous chert and the of chert band is NW-SE. South central part is having traces of F3 major fold axis and NE-SW trending fault. Source Figure 2.
Figure 1.
Uninterpreted false color composite (FCC) (red band-90, green band-28 and blue band-36) of AVIRIS-NG airborne data of the study area (black box). The study area is part of Karnataka state (red boundary line) of India.
Figure 2.
Geological map of the study area (modified after the geological survey of India). The major part of the area is occupied by metabasalt, and in the central and southern part, metagabbro. Banded ferruginous chert, occupying the northern part trending NW-SE. (the map is modified from the URL: http://gsi.gov.in/bhukosh.)
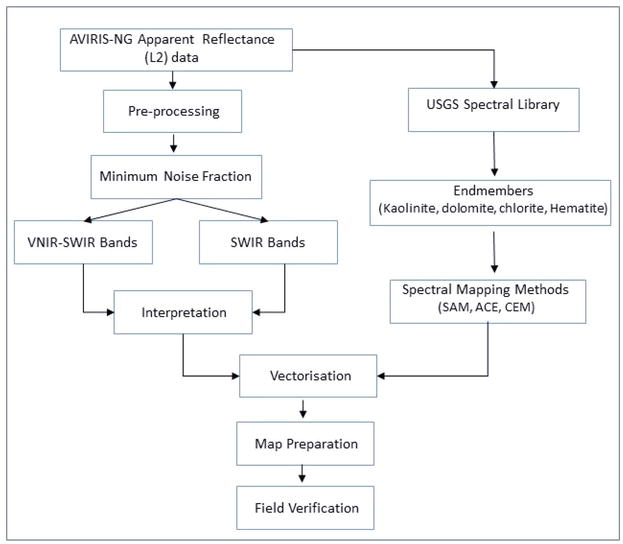
For the present study, AVIRIS-NG (scene id: ang20180324t054258_rfl_v2s1) was downloaded from https://vedas.sac.gov.in. The AVIRIS-NG is level 2 reflectance data, acquired in 2A–2B phase during 2018–2019. Before applying advanced hyperspectral remote sensing techniques on the data, the bands were resized by removing bands which do not contain any information from the raw data. Total 328 VNIR and SWIR channels out of 425 were considered for the analysis. To map hydroxyl, carbonate and iron-bearing minerals, techniques like Minimum Noise Fraction (MNF) and spectral classifications like Constrained Energy Minimization (CEM), Spectral Angle Mapper (SAM), and Adaptive Coherence Estimator (ACE) were adopted. Figure 3 shows the methodology followed in the present study.
Figure 3.
Methodology followed in the present study to map the minerals using advanced hyperspectral techniques.
3.1 Minimum noise fraction (MNF)
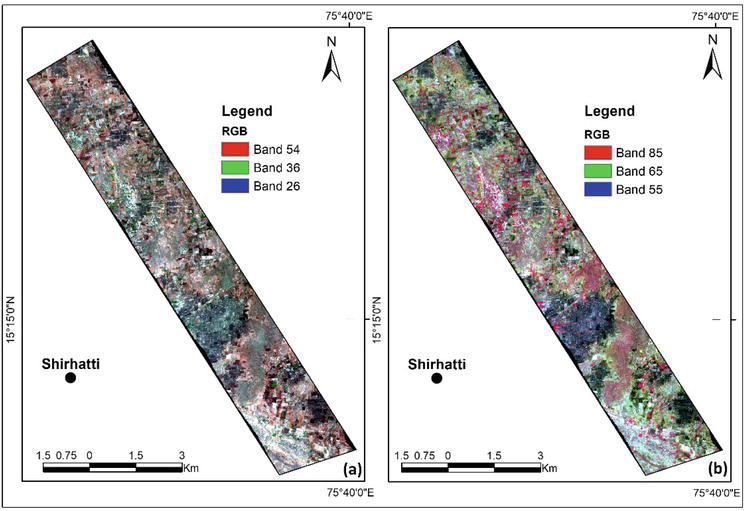
Sometimes, unprocessed imageries do not produce favoured outcomes (Figure 4a and b); therefore, to extract better and desired outcomes application of advanced enhancement techniques is required. MNF is known to be an effective tool for reducing the dimensionality of large datasets to a small number of components that retain most of the information. MNF is useful for discerning between noise and signals in a dataset [7]. This transformation is similar to Principal Component Analysis (PCA) and is a very powerful tool in lithological, structural and alteration zone mapping. MNF is used to determine how much noise is in the image data, separate noise from the image, and reduce the computation required for further processing [8]. MNF includes two steps: the first transformation is called noise-whitening and is based on an estimated noise covariance matrix that aims at decorrelation and rescaling the noise in the data. This transformation is capable of determining the inherent dimensionality of an image [7]. The second step derives the principal components from the noise-free data. Then the data can be split into two parts. One part is associated with large eigenvalues, the other part has eigenvalues close to 1, and the image is dominated by noise. Using data with large eigenvalues separates noise from the data and improves spectral results [9].
Figure 4.
Unprocessed AVIRIS-NG imagery of the study area. (a) Is true colour image (R-54: G-36: B-26); and (b) is colour infrared image (R-85: G-65: B-55).
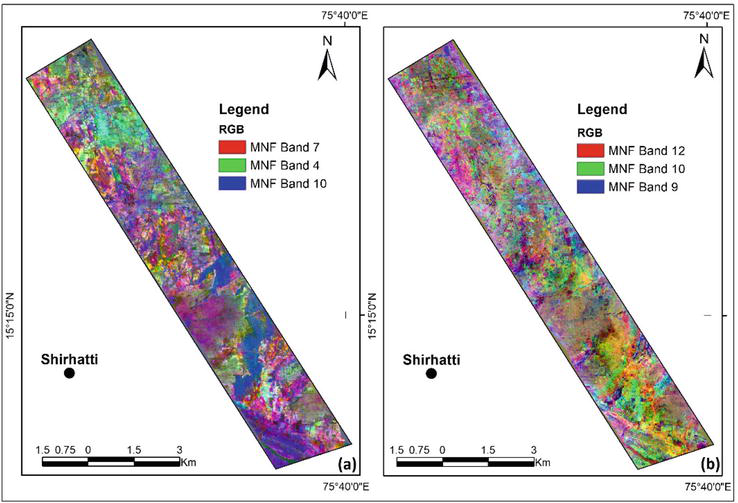
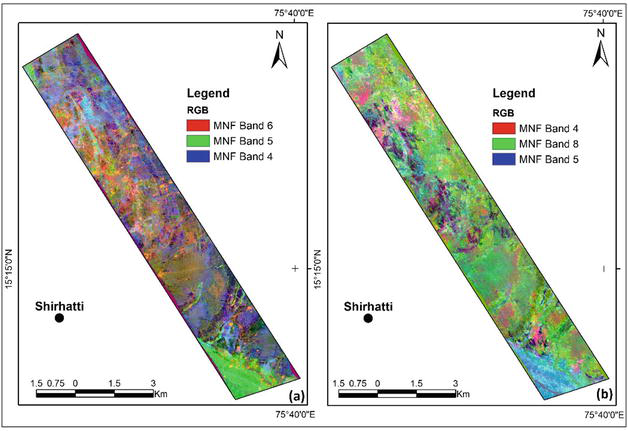
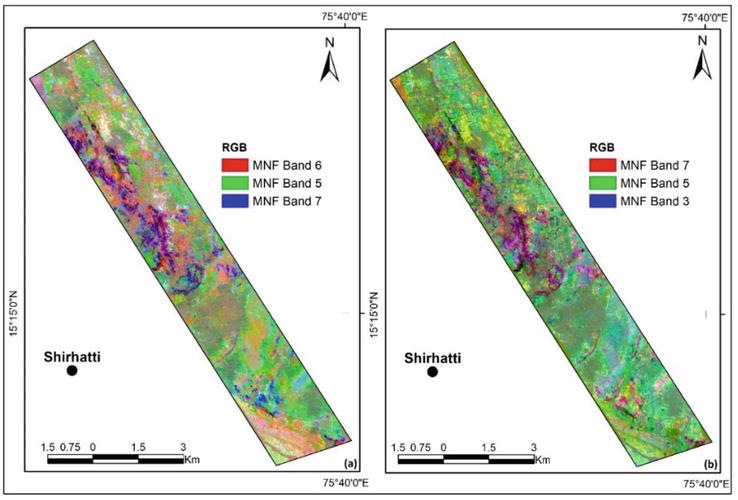
First, the MNF technique was applied to the VNIR & SWIR bands of AVIRIS-NG data with 30 output bands for the identification of different lithology and alteration zones in the study area. MNF image obtained by applying MNF transformation on AVIRIS-NG-VNIR-SWIR bands (Figures 5 and 6). In the False Color Composite (FCC) image of MNF bands (R-7: G-4: B-10), greenish color dominate in the north, shades of magenta in visible in the central and southern part, the prominent hue of magenta-blue are confined in the south-west part (Figure 5a). In the FCC image of MNF bands (R-12: G-10: B-9), light pink prevails in the north, yellow is the south part, and green is distributed in the entire area (Figure 5b). In the FCC image of MNF bands (R-6: G-5: B-4), prominent green color in the southern part of the study area marks the boundary in two different litho-units, highlighting linear and curvilinear features Figure 6a. In the FCC image of MNF bands (R-4: G-8: B-5), deep magenta color features are prominent in the northern part and light blue in the south (Figure 6b). In the FCC image (Figure 7) of MNF bands (R-6: G-7: B-8), yellow to rust color dominates in a linear pattern in the western and central parts. In the eastern part of the study area, magenta is prominent along with green, whereas blue hue is in the south (Figure 7a). In the FCC image of MNF bands (R-9: G-8: B-5), maroon is prevailing in the western part in NW-SE direction, yellow in the eastern margin whereas green is common in entire area. South-west corner is highlighted in light blue to pink color (Figure 7b).
Figure 5.
MNF image obtained by applying MNF transformation on AVIRIS-NG-VNIR-SWIR bands. (a) FCC image of MNF bands (R-7: G-4: B-10 and visual interpretation of this figure shows greenish color in north, shades of magenta in the central and southern parts and a hue of magenta-blue confined in the south-west part. (b) In the FCC image of MNF bands (R-12: G-10: B-9), light pink prevails on the north side and yellow on the south part, whereas green is distributed in the entire area.
Figure 6.
MNF image obtained by applying MNF transformation on AVIRIS-NG-VNIR-SWIR bands. (a) In the FCC image of MNF bands (R-6: G-5: B-4), in the southernmost corner, a distinct boundary in green and blue color is prominent, indicating two different litho-unit. (b) In the FCC image of MNF bands (R-4: G-8: B-5), deep magenta color is prominent and confined in the northern-western part and cyan color in south.
Figure 7.
MNF image obtained by applying MNF transformation on AVIRIS-NG-VNIR-SWIR bands. (a) In the FCC image of MNF bands (R-6: G-7: B-8), yellow to rust color, in a linear pattern, dominates in the western and central parts. In the eastern part of the study area, magenta is prominent along with green, whereas blue hue is in the south. (b) FCC image of MNF bands (R-9: G-8: B-5), maroon is prevailing in the northern-western part, trending in NW-SE direction, the eastern margin is in yellow whereas green is common in the entire area. The south-west corner is highlighted in cyan and pink color.
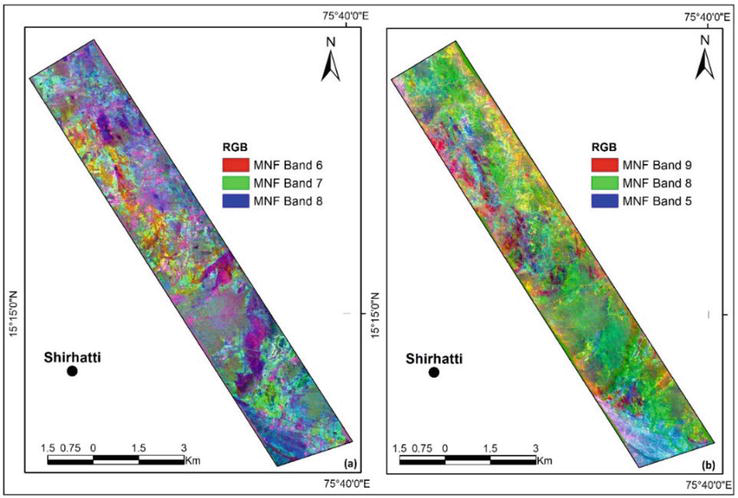
Spectral range from 2.0 to 2.5 μm, provides abundant information about hydroxyl-bearing minerals, sulfates and carbonates that are found in many geologic units and hydrothermal systems [4], SWIR bands of AVIRIS-NG were considered for mapping different lithology which may be associated with some potential mineralized zone (Figure 8). In the Figure 8a, FCC image of MNF bands (R-6: G-5: B-7); a very prominent trend in NW-SE direction is highlighted in the northern part. In the southern tip of the study area, a NW-SE prominent boundary between peach and green color is visible, indicating contact of two different lithologies. FCC image of MNF bands (R-7: G-5: B-3) also indicates the prominent trend of NW-SE magenta color along with yellow and yellow colours in the north (Figure 8b). A few spots in magenta are visible in the south part, whereas lithological contact in the southern part is not prominent as in the MNF image R-6: G-5: B-7.
Figure 8.
MNF image obtained by applying MNF transformation on AVIRIS-NG-SWIR bands. (a) In the FCC image of MNF bands (R-6: G-5: B-7), a very prominent trend in the NW-SE direction is highlighted in the north-western part. An NW-SE prominent boundary between peach and green color is visible in the southern tip of the study area, indicating contact between two different lithologies. (b) FCC image of MNF bands (R-7: G-5: B-3) also indicates a prominent trend in NW-SE of magenta and yellow in the north-western part. In the south, light magenta is visible at a few locations, whereas lithological contact in the southern part is not highlighted as in other MNF images.
3.2 Classification techniques
Supervised classification is used to cluster pixels in the dataset into classes corresponding to user-defined training classes. Training classes are groups of pixels (Region of Interests-ROIs) or individual spectra of minerals. There is various classification method to map the mineral using hyperspectral remote sensing data. Advanced spectral classification methods such as Constrained Energy Minimization (CEM), Spectral Angle Mapper (SAM), and Adaptive Coherence Estimator (ACE) techniques are powerful tools for detecting target minerals in potential zones for mineral exploration.
3.2.1 Constrained energy minimization (CEM)
CEM is an extension to spectral unmixing, established by Farrand and Harsanyi [10]. This technique has been widely used in various applications, such as geological mapping, agriculture management and medical image processing for target detection. CEM is originally derived from a linearly constrained minimum variance adaptive beam-forming in the field of signal processing. This technique keeps output energy constant at the same time suppressing the background to a minimum level [11, 12]. CEM is widely utilized for target detection in hyperspectral imagery. It detects the desired target signal source using a unity constraint while suppressing noise and unknown signal sources by minimizing the average output power [13]. Using partial unmixing based on the estimate of sample correlation matrix highlights target abundances [14]. In order to suppress undesired background and improve the target signature, the total output energy of all the pixels in the imagery is minimized, and the total energy of each individual pixel is projected to be equal to one. The resultant CEM image is the vector component, containing abundance information [15]. CEM algorithm requires the signature of the target only, and prior knowledge is not obligatory. An additional benefit of CEM is that as various signal sources cannot be recognized or observed with the bare eye, several materials may be detected by sensors leading to false [11, 12].
3.2.2 Spectral angle mapper (SAM)
SAM classification is based on a hypothesis that in satellite imagery, a single pixel represents one particular ground material and can be exclusively assigned to only one ground cover class [16]. The SAM classification technique classifies the pixels based on similar spectral properties with reference spectra. It utilizes endmember spectra that could be extracted directly from the image or spectral library [17]. The algorithm determines the spectral similarity between two spectra by calculating the angle among the spectra and treating them as vectors in a space with dimensionality equal to the number of bands [18]. These vectors are generated by connection of reflectance spectrum point with the origin. SAM is based on the spectral shape outline, whereas conventional classifiers are based on the statistical distribution of the pattern [15]. Smaller angles represent closer matches to the reference spectrum. Pixels further away than the specified maximum angle threshold in radians are not classified.
3.2.3 Adaptive coherence estimator (ACE)
The ACE method determines if a pixel spectrum certainly comprises of a known target signature. It gives the best results when the background conditions are variable and unknown. ACE algorithm is a uniformly most powerful invariant detection statistic that is derived from the Generalized Likelihood Ratio (GLR) approach [19]. The ACE is invariant to the relative scaling of input spectra and has a Constant False Alarm Rate (CFAR) with respect to such scaling. Similar to CEM and SAM, ACE does not require knowledge of all the end members within an image scene. ACE classifier considers both the statistical model as well as subspace projection model into account. Calculating the cosine square of the angle between two spectra yields information about how similar the test and reference spectra are related to each other. Since this approach is noise-sensitive, it is necessary to eliminate noise before target detection [20].
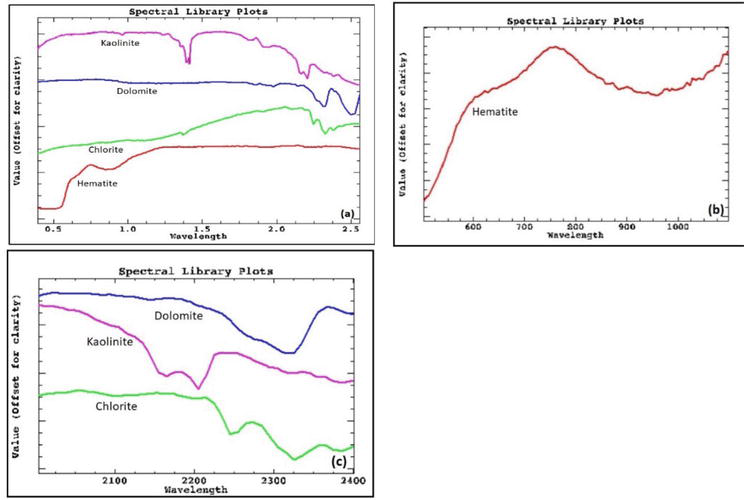
In this investigation, the reference spectra of selected endmember minerals, for implementing CEM, SAM and ACE algorithms were extracted from the USGS spectral library. These reference spectra were convolved to the spectral response function of AVIRIS-NG’s VNIR and SWIR bands. Selected endmembers spectra in this study are kaolinite, dolomite, chlorite and hematite (Figure 9a–c).
Figure 9.
Convolved USGS spectral library profiles with AVIRIS-NG Spectral response function using ENVI, (a) refers to the USGS spectra for the alteration minerals (kaolinite, dolomite and chlorite and hematite), (b) shows the spectral curves of hematite after resampled with VNIR bands of AVIRIS-NG sensor spectral response function, (c) represents the spectral curve of dolomite, kaolinite, and chlorite after resampled with SWIR bands of AVIRIS-NG sensor spectral response function.
The CEM, SAM and ACE algorithms were implemented on the VNIR-SWIR bands of AVIRIS-NG data separately (Figures 10 and 11) to obtain the desired outcome and results appear as a series of grayscale images for each selected end member. These algorithms were applied to the selected spatial subset AVIRIS-NG data of the study area to map the subpixel distribution of minerals collected from the USGS library. The RGB color composite was analyzed and found non-informative. The resultant gray image of each mineral was classified, and the grayscale in images shows high DN (digital number) values of the sub-pixel abundance of the mineral in the image. To ascertain the target mineral, each gray scale image was classified in gray scale through a density slicing approach. The highest value of density slicing was considered, and each value in the resultant image represents the sub-pixel abundance of the target alteration mineral in each pixel. Subtle differences between altered and non-altered rocks and hydrothermal alteration minerals were detected and mapped in the study area.
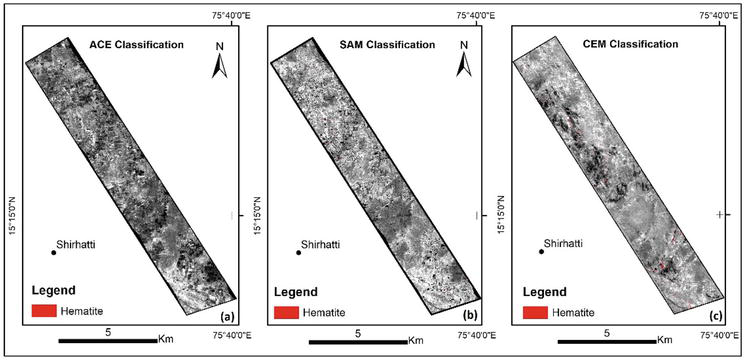
Figure 10.
The spatial distribution of hematite mineral in gray image, obtained by applying ACE, SAM and CEM spectral classification techniques on VNIR bands of AVIRIS-NG data of the study area. (a) Derived from ACE, (b) resulted by SAM and (c) through the CEM algorithm.
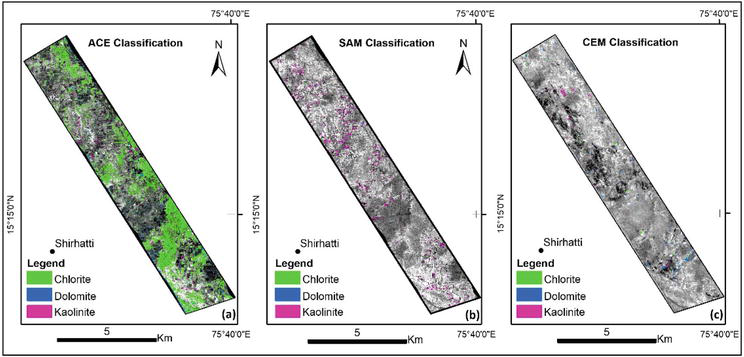
Figure 11.
The spatial distribution of kaolinite, dolomite and chlorite minerals in gray image, obtained by applying ACE, SAM and CEM spectral classification techniques on SWIR bands of AVIRIS-NG data of the study area. (a) Derived from ACE, (b) resulted from SAM and (c) through the CEM algorithm.
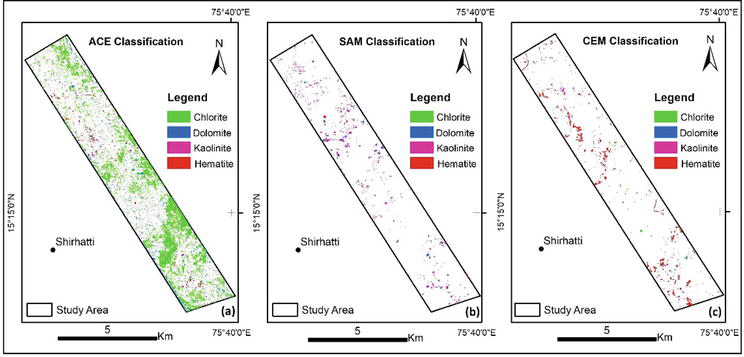
Figure 10a–c shows the spatial distribution of hematite mineral on gray image of AVIRIS-NG data obtained by applying ACE, SAM and CEM spectral classification techniques on VNIR bands of AVIRIS-NG data of the study area. Figure 11a–c displays the spatial distribution of kaolinite, dolomite and chlorite minerals on gray image of AVIRIS-NG data, derived by applying ACE, SAM and CEM spectral algorithms on SWIR bands of AVIRIS-NG. Figure 12 demonstrate combined resultant mineral maps derived from ACE and SAM algorithm applied on VNIR and SWIR bands of AVIRIS-NG image of the study area to map the minerals separately. Figure 12a–c shows the spatial distribution of kaolinite, dolomite, chlorite and hematite minerals obtained by ACE, SAM and CEM spectral classification methods.
Figure 12.
Combined resultant mineral maps derived from ACE and SAM algorithm applied on VNIR-SWIR bands of AVIRIS-NG image of the study area to map the minerals. (a–c) The spatial distribution of kaolinite, dolomite, chlorite and hematite minerals obtained by ACE, SAM and CEM spectral classification methods.
ACE and SAM did not perform well despite analyzing different threshold values. The SAM rule image was used to produce a classified image map. But, the image map contains a very noisy background, and classified mineral zones was not discernible from the background (Figure 12). Figure 12a shows the resultant image map derived from ACE algorithm in the study area. ACE has classified most of the study area as chlorite mineral. Hematite shows the concentration in the northern part, and the roads present in the area are also identified as target mineral hematite. Hematite and chlorite could not be recognized by the SAM algorithm as expected (Figure 12b). CEM was applied to map the subpixel distribution of kaolinite, dolomite, chlorite and hematite in the study area. The resultant gray image of each mineral was classified, and the grayscale in images shows high values of the sub-pixel abundance of the mineral in the image. Comparative analysis of the spectral classification results (Figure 12a–c) shows that all four minerals were well detected and mapped by CEM than ACE and SAM algorithms. The CEM algorithm can detect the detailed surface distribution of alteration minerals in the area better than other algorithms.
For better interpretation, visualization and understanding, results of mapped minerals displayed on the gray band of AVIRIS-NG and outline of the geology (Figure 13). Figure 13a shows the spatial distribution of the minerals on gray image of AVIRIS-NG data. Visual interpretation indicates that the majority of the mapped minerals are concentrated in the northern part and in some isolated areas in the south part of the research area. Figure 13b shows an outline of the geology area mapped by GSI and the results of the mapped minerals. Figure 13b attempts to establish the correlation of the detected minerals with known geology. Hematite mineral shows concentration along NW-SE trending banded ferruginous chert hosted in metabasalt. Kaolinite and hematite minerals have an overlapping relationship observed at places. Chlorite, dolomite and some hematite minerals are confined in metagabbro.
Figure 13.
The spatial distribution of the combined minerals (obtained separately from VNIR and SWIR bands) on gray image and correlation of mapped mineral with the existing geology of the study area. (a) Show the spatial distribution of kaolinite, dolomite, chlorite and hematite minerals on gray image. (b) Shows the correlation of the detected minerals with the known geology of the study area, mapped by GSI.
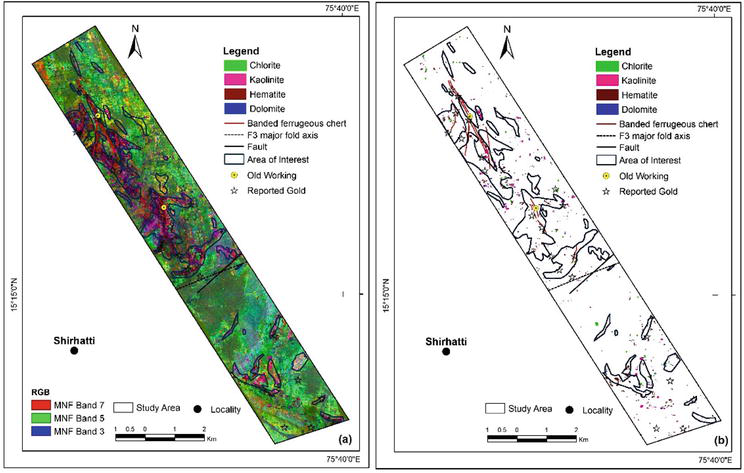
The prominent features and information highlighted in the MNF images of AVIRIS-NG were identified as areas of interest and vectorised. The area is well known for gold mineralization, and a database in the GIS platform on gold mineralization was prepared. The mapped minerals: kaolinite, dolomite, chlorite, hematite, known locations of gold mineralization and area of interest identified from the MNF image were integrated together to verify the remote sensing outputs in the study area and to identify the potential zones for mineral investigation (Figure 14). Figure 14a shows an outline of the area of interest (vector) demarcated from different MNF images, old workings and gold locations reported by GSI in the study area superimposed on the MNF image (R-7: G-5: B-3). Figure 14b shows an outline of the area of interest (vector) demarcated from different MNF images, old workings & gold locations reported by GSI and the mapped alteration minerals for better visualization and demarcation of the potential areas for field investigation. Old workings and other reported gold mineralization in the area show a good correlation with the mapped minerals through CEM, SAM and ACE classification.
Figure 14.
Shows integration of mapped minerals (kaolinite, dolomite, chlorite, hematite) derived from ACE, SAM & CEM algorithms, area of interest (potential zones) demarcated from different MNF images, the known location of gold mineralization and structures in the area. (a) Show boundaries of potential zones demarcated from different MNF images interpreted from different MNF images along with the known gold mineralization and structures in the area on MNF image (R-7: G-5: B-3) and (b) show boundaries of potential zones demarcated from different MNF images interpreted from different MNF images along with the known gold mineralization and structures in the area for better interpretation, visualization and identification of potential areas for detailed field investigation.
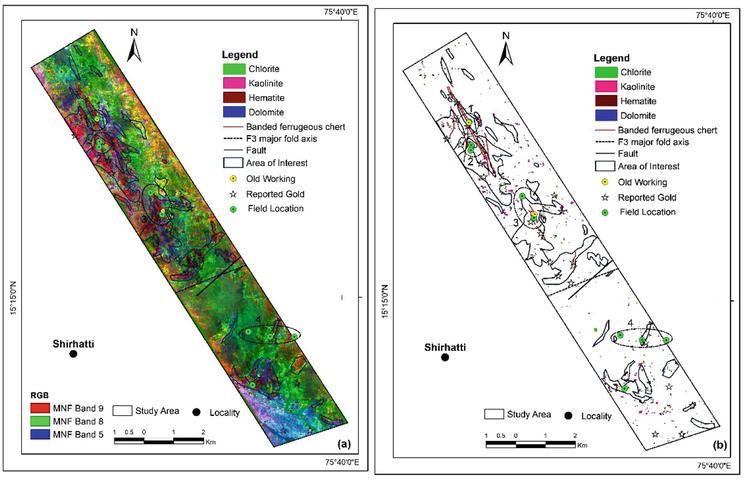
Comprehensive fieldwork and petrographic study were conducted in the study area to verify the remote sensing outputs. Based on the integration of all the inputs, the study area was grouped into four: L1, L2, L3 and L4 (marked as black dotted circles, Figure 15) that have been surveyed in the field for the verification of remote sensing outputs. Detailed criteria for the selection of each potential zone for field investigation are given in Table 1. Figure 15a shows four potential areas along with field location on the MNF image (R-9: G-8: B-5), and Figure 15b shows four potential areas along with field location for better visualization.
Figure 15.
Four identified areas grouped into four: L1, L2, L3 and L4 for field investigation, marked in black dotted circles along with sample collection locations. (a) Shows four potential areas along with field location on the MNF image (R-9: G-8: B-5), and (b), shows four potential areas along with field location shows without superimposing on image for better visualization.
Potential zones
Correlation with interpreted results
Correlation with geology
L1
Potential zone highlighted in different colors in MNF images and hematite alteration
Banded ferruginous chert, metabasalt and old working
L2
Potential zone highlighted in different colors in MNF images and hematite alteration
Banded ferruginous chert, metabasalt, the occurrence of gold
L3
Potential zone highlighted in different colors in MNF images, hematite and dolomite alteration
Banded ferruginous chert, metabasalt, the occurrence of gold, old working
L4
Potential zone highlighted in different colors in MNF images, hematite, kaolinite, chlorite and dolomite alteration
Metabasalt, the occurrence of gold
Table 1.
Detailed criteria for selection of potential zones for field investigation.
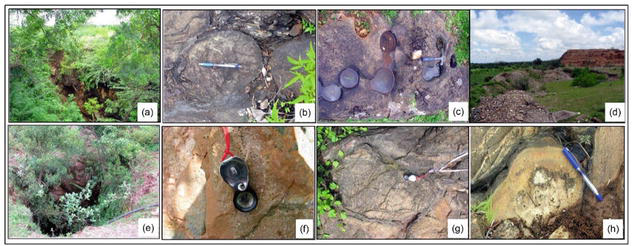
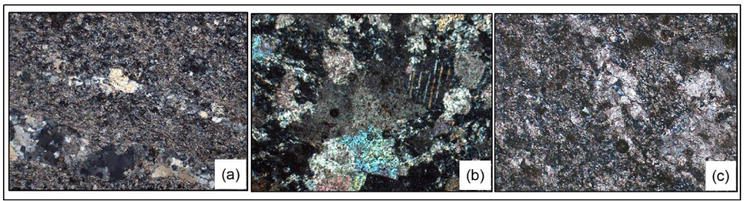
During the field survey, variants of metabasalt from fine to medium-grained, deformed, foliated and pillowed in nature were recorded. Iron leaching on the surface of the rocks is also very common in those areas where BIF is present. In addition, intense carbonate alteration was observed in the metabasalt. In the investigated area, several abandoned old workings were noticed. Pounding marks on the surface of the rocks in the survey area indicate gold mining activities in ancient times. (Figure 16a–h). To ascertain the results of the remote sensing techniques, a lab study of the samples collected from the investigated areas was conducted. The results from the remote sensing technique are well supported by the petrographic study (Figure 17a–c). Detailed field observations in four potential zones (L1–L4) and petrographic are given in Table 2.
Figure 16.
The area surveyed (L1, L2, L3 and L4) in the field for the verification of remote sensing outputs. In the field, various types of metabasalt are occurring as main rock, minerals altered to carbonate and the surface of rock exposures are iron leached. (a) (L1): Abandoned old working in the area; (b) (L1): Very fine-grained, pillowed metabasalt. (c) (L1): Pounding marks on rock surface indicates gold mining activity in ancient times. (d) (L2): Abandoned site of old working. (e) (L3): Abandoned site of old working. (f) (L3): Metabasalt with a limonitic surface containing grains of pyrite. (g) (L3): Deformed metabasalt. (h) (L4): Very fine-grained, pillowed metabasalt, primary minerals altered to carbonates.
Figure 17.
Different types of alteration minerals in the study area. (a) (L1): Microphotographs show minerals are very fine-grained and composed of carbonate and quartz. Primary minerals are replaced by carbonate. Sericite is also present as a minor mineral. (b) (L3): Microphotograph shows minerals are fine-grained and altered. Calcite is the main component, replacing all the primary minerals indicated by remnants of plagioclase. Sericite and iron oxide are also present. (c) (L4): Microphotograph shows highly altered rock and primary minerals completely replaced by carbonate.
Potential zones
Field observation and petrographic study
L1
During field inspection very fine grained pillowed metabasalt and banded ferruginous chert is observed. Abandoned Hosur Gold Mine is located in this zone and presence of pounding marks on rock surface indicates gold mining activity in ancient times in the area. Hematite alteration is mainly contributed is because of the iron leaching on the and banded ferruginous. In petrographic study, carbonate and sericite alteration minerals recorded
L2
Alteration in metabaslt recorded and abandoned Shirunj Mine is located in this zone. Hematite alteration is due to the presence of iron leached dump
L3
Pillowed, very fine grained metabasalt is altering in carbonate, limonitic rock surface and sulphide recorded. Yellishirur-Venkatapura abandoned mine is present in this zone. Petrographic study shows alteration of primary minerals in calcite and sericite. Iron oxide is also present
L4
Very fine grained, pillowed metabasalt altered in carbonate and medium grained dyke is noticed. Petrographic study shows alteration of primary minerals in carbonate
Table 2.
Location-wise field observations in four identified potential zones and petrographic study.
MNF, ACE, SAM and CEM advanced hyperspectral remote sensing techniques were applied on the AVIRIS-NG airborne data to map the kaolinite, dolomite, chlorite, hematite. In the MNF images, some areas prominently highlighted and identified as areas of interest. A comparative study of the results of all three algorithms reveals that CEM algorithm has classified the four minerals better than the ACE and SAM. The potential zones identified from the remote sensing data and the petrographic study were verified in the field. In the field, abandoned mines were present in three of the four potential zones that were well captured in MNF images. Altered minerals identified by CEM, SAM and ACE are well supported by field evidence and petrographic studies. Calcite and hematite alterations recorded in the field which are corresponding to metabasalt-banded ferruginous chert and leached surface. Lab study shows that metabasalt is altering in calcite, and iron oxides are also present. The advanced hyperspectral remote sensing approach used in this study has great implications for mineral mapping.
The authors place, on record, their sincere thanks to the Director General, Geological Survey of India, Kolkata and Dy. Director General & Head Mission-V, Geological Survey of India Training Institute, Hyderabad, for permission to publish the work.
References
1.Tripathi MK, Govil H. Evaluation of AVIRIS-NG hyperspectral images for mineral identification and mapping. Heliyon. 2019;5:e02931. DOI: 10.1016/j.heliyon.2019.e02931
2.Mishra S, Chattoraj SL, Benny A, Sharma Richa U, Ray PKC. AVIRIS-NG data for geological applications in Southeastern Parts of Aravalli Fold Belt, Rajasthan. Proceedings. 2019;24:16. DOI: 10.3390/IECG2019-06212
3.Nisha R, Tejpal S, Mandla VR. Mapping hydrothermal alteration zone through aster data in Gadag Schist Belt of Western Dharwar craton of Karnataka, India. Environmental Earth Sciences. 2020;79:526. DOI: 10.1007/s12665-020-09269-9
4.Kruse FA. Comparison of AVIRIS and hyperion for hyperspectral mineral mapping. In: Presented at the 11th JPL Airborne Geoscience Workshop; 4-8 March 2002; Pasadena. Boulder, Colorado, USA: California 1 Analytical Imaging and Geophysics LLC; 2002
5.Nisha R, Mandla VR, Tejpal S. Structural and alteration mapping using ASTER imagery and DEM for gold mineralization in the Gadag Schist Belt of Karnataka, India. In: Misra AA, Mukherjee S, editors. Atlas of Structural Geological and Geomorphological Interpretation of Remote Sensing Images. Chichester, West Sussex, UK: John Wiley & Sons Ltd; 2022
6.Nisha R, Mandla VR, Tejpal S. Spatial distribution of altered minerals in the Gadag Schist Belt (GSB) of Karnataka, southern India using hyperspectral remote sensing data. Geocarto International. 2016;10(3):225-237.DOI: 10.1080/10106049.2015.1132484
7.Shirmard H, Farahbakhsh E, Pour AB, Muslim AM, Müller RD, Chandra R. Integration of selective dimensionality reduction techniques for mineral Exploration using ASTER satellite data. Remote Sensing. 2020;12(8):1261. DOI: 10.3390/rs12081261
8.Mohamed E-M, Abdellatif A, Abdellah L, Abderrazak H, Ahmed A, Kawtar B. Contribution of multispectral remote sensing to mining exploration in the Rehamna massif, Moroccan Meseta. E3S Web of Conferences. 2020;2020:150. DOI: 10.1051/e3sconf/20201500
9.Feizi F, Mansuri E. Separation of alteration zones on ASTER data and integration with drainage geochemical maps in Soltanieh, Northern Iran. Open Journal of Geology. 2013;3(2):134-142. DOI: 10.4236/ojg.2013.32017
10.Farrand W, Harsanyi J. Mapping the distribution of mine tailings in the Coeur d'Alene River valley, Idaho, through the use of a constrained energy minimization technique. Remote Sensing of Environment. 1997;59:64-76. DOI: 10.1016/S0034-4257(96)00080-6
11.Qian D, Hsuan R, Chein-I C. A comparative study for orthogonal subspace projection and constrained energy minimization. IEEE Transactions on Geoscience and Remote Sensing. 2003;41:6
12.Shih-Yu C, Chinsu L, Chia-Hui T, Shang-Ju C. Adaptive window-based Contrained energy minimization for detection of newly grown tree leaves. Remote Sensing. 2018;10(1):96. DOI: 10.3390/rs10010096
13.Ren H, Du Q , Chang C-I, Jensen JO. Comparison between constrained energy minimization based approaches for hyperspectral imagery. In: IEEE Workshop on Advances in Techniques for Analysis of Remotely Sensed Data, 2003, Greenbelt, MD, USA. 2003. pp. 244-248. DOI: 10.1109/WARSD.2003.1295199
14.Ghulam A, Amer R. Mineral exploration and alteration zone mapping in eastern desert of Egypt using ASTER data. In: Conference Paper, ASPRS, Annual Conference, San Diego, California. 2010
15.San BT. Hyperspectral image processing of eo-1 hyperion data for lithological and mineralogical mapping [thesis]. Geological Engineering Department, Middle East Technical University; 2008
16.Ahmad N, Kazemi MAA, Javad A, Gholami H, Mahdavi R. Using pixel basis and subpixel based techniques to identify alteration zones (Case Study: Tange Bostanak Region). Quantitative Geomorphological Research. 2016;5(1):89-109
17.Lida N, Pour AB, Askari G, Taghipour N, Pradhan B, Chang-Wook L, et al. Comparison of different algorithms to map hydrothermal alteration zones using ASTER remote sensing data for polymetallic vein-type ore exploration: Toroud-Chahshirin Magmatic Belt (TCMB), North Iran. Remote Sensing. 2019;11(5):495. DOI: 10.3390/rs11050495
18.Wakila MH, Saepuloh A, Heriawan MN, Susanto A. Performance analysis of mineral mapping method to delineate mineralization zones under tropical region. IOP Conference Series: Earth and Environmental Science. 2016;42:012007. DOI: 10.1088/1755-1315/42/1/012007
19.Pour AB, Hashim M, Park Y. Alteration mineral mapping in inaccessible regions using target detection algorithms to ASTER data. IOP Conference Series: Journal of Physics. 2017;852:012022. DOI: 10.1088/1742-6596/852/1/012022
20.Ni L, Honggen X, Zhou X. Mineral identification and Mapping by synthesis of hyperspectral VNIR/SWIR and multispectral TIR remotely sensed data with different classifiers. IEEE Journal of Applied Earth Observations and Remote Sensing. 2020;13:3155-3163
Written By
Nisha Rani, Sumit Kumar Ahirwar, V.M. Anoop and K.V. Krishnamurthy
Submitted: 30 December 2022Reviewed: 13 January 2023Published: 21 September 2023
 Open access peer-reviewed chapter