 Open access peer-reviewed chapter
Abstract
There is no dearth of literature detailing individual inborn neurometabolic disorders (INMDs), but it is hard to find a systematic approach to precisely diagnose these. Early diagnosis can go a long way in managing them and improving quality of life and cure in some cases. A systematic structured approach taking into account age, type of presentation, clinical features, imaging, biochemical tests, histopathology and molecular diagnostics often helps in arriving at a particular diagnosis, or a broad category of disorders, which helps in further management. Newer treatment options such as bone marrow transplantation, umbilical cord blood stem cell transplantation, enzyme substitution, somatic gene therapy, and fetal neuronal transplants have given a ray of hope, making it imperative to arrive at early diagnosis of these conditions. Even if a child is lost to inborn error of metabolism (IEM), the cord blood of a normal sibling may be frozen as a reservoir for stem cells for an affected sibling in future pregnancies. In this chapter, we would try to evolve a systematic approach for diagnosis of IEMs and to narrow down the list of differentials. This will lead to cost-effective yet precise biochemical, genetic, and molecular tests to arrive at a final diagnosis.
Keywords
- inborn errors of metabolism
- neurometabolic
- MRI
- metabolic brain disorders
- proteomics
- genome sequencing
1. Introduction
Inborn errors of metabolism (IEM) are a group of disorders caused due to defects in a given biochemical pathway or a deficiency or abnormality of an enzyme, its cofactor, or a transporter resulting into an accumulation of a substrate or suppression of formation of a product. Circulating metabolites may have systemic toxic effects. Moreover, metabolites accumulated in a disorder can further inhibit enzymes; an example being methyl malonic acidemia (MMA). In MMA, methylmalonyl coenzyme A inhibits pyruvate carboxylase, and methylmalonic acid inhibits succinate dehydrogenase. Hence, gluconeogenesis is affected and manifests as hypoglycemia and ketosis, which can further affect the brain parenchyma. There may also be activation of alternative metabolic pathways. In urea cycle defects (UCDs), hyperammonemia may increase synthesis of glutamate, leading to excitotoxic injury to the brain parenchyma. INMDs are monogenic and lack genotype-phenotype correlation (evident from the presence of different phenotypes for the same genetic variation in a family). This further adds to their complexity and makes the diagnoses of such disorders difficult. The studies that applied targeted next generation sequencing panels could diagnose 11–51% of IEMs [1]. Navarette et al. using personalized exome sequencing panel, could confirm only 59% of IEMs [2]. Though individual diseases may be rare, as a whole, these group of disorders are not as uncommon as previously thought. Most of these disorders have genetic basis and are autosomal recessive; hence, they are more common in consanguinity. A proper approach to diagnose these disorders is very important. In this chapter, we would try to develop a systematic approach to diagnose INMDs without going into details of individual disorders.
2. Classification
Classification gives an overview and helps simplify approach. There are different ways of classifying inborn errors of metabolism: on the basis of organ systems involved (neurometabolic, systemic or mixed), cell organelles involved (mitochondrial, lysosomal, peroxisomal and golgi complex disorders), biochemical abnormality (organic acidurias, aminoacidemias, carbohydrate metabolism abnormalities, metal metabolism disorders), or the brain substance involved (polio-, leuko- or pandystrophies).
3. Clinical criteria
It is very important to systematically analyze patients’ illness based on the following criteria to direct further investigations:
3.1 Age of onset
Neurometabolic disorders can present at different ages (neonatal—birth to 1 month; early infantile—1 to 6 months; late infantile—6 months to 3 years; childhood—3 to 6 years, juvenile—6 to 16 years, adult—more than 16 years) depending on the genetic defect and residual enzyme activity. Even different phenotypes of the same disease can present at different ages. Most organic acidemias (primary lactic acidosis, UCDs, propionic acidemia, methylmalonic aciduria, isovaleric acidemia) present in the neonatal period. Others like glutaric aciduria, lysosomal disorders (Tay-Sachs and Sandhoff diseases), and mucopolysccharidoses (Hurler, Hunter, Maroteaux-Lamy disease) present in infancy. Diseases like Gaucher disease, metachromatic leukodystrophy (MLD), multiple sulfatase deficiency, Krabbe disease, GM1 and GM2 gangliosidoses, neuronal ceroid lipofuscinosis and mitochondrial myopathy, encephalopathy, lactic acidosis, and stroke-like episodes (MELAS) may have all the ages of presentation. Fabry disease, Leber hereditary optic neuropathy (LHON), and Kearns-Sayre syndrome are seen in the juvenile age. Premature birth, though uncommon in IEM, may be seen in glutaric aciduria type II [3].
3.2 Type of onset
The disease may present as acute illness or chronic encephalopathy or have an intermittent course. Ethylmalonic aciduria, 3-hydroxy-3-methylglutaryl (HMG) coenzyme A lyase deficiency, pyroglutamic aciduria, isovaleric acidemia, holocarboxylase synthetase deficiency, β-ketothiolase deficiency, and malonic aciduria mostly present as acute metabolic decompensation. Chronic progressive encephalopathy (with pyramidal or extrapyramidal signs) is seen in L2-hydroxyglutaric aciduria, N-acetylaspartic aciduria (Canavan disease), and 4-hydroxybutyric aciduria. Acute metabolic crises with interval progressive encephalopathy occur in propionic acidemia, methylmalonic acidemia, and glutaric aciduria type I.
3.3 Head circumference
The head circumference of every child suspected of having neurometabolic disorder should be measured and put in percentile by comparing to standard nomograms for that population. A head circumference (HC) between 5th and 95th percentile is considered normal; more than 95th percentile is macrocephaly (Van der knap disease, Canavan disease, Alexander disease, type I glutaric aciduria, L-2-hydroxyglutaric aciduria, GM2 gangliosidosis, vanishing white matter disease, mucopolysaccharidosis), and less than 5th percentile is microcephaly (Zellweger disease, Aicardi-Goutieres syndrome, Cockyne ds, Pelizaeus-Merzbacher disease). In addition to the initial assessment, the HC should be measured at regular intervals to see the progress with time. In Zellweger disease, the HC is normal at birth but progressively lags behind.
3.4 Neurological abnormalities
3.4.1 Pyramidal signs
Stroke-like picture is predominantly seen in leukodystrophies and is often progressive. It may be hemorrhagic or ischemic. Hemorrhagic stroke is seen in organic acidopathies (propionic, isovaleric and methylmalonic acidemias particularly during metabolic crisis [4, 5]). Ischemic stroke is seen in some aminoacidopathies like homocystinuria, ornithine transcarbamylase deficiency, L-carnitine and carbamyl phosphatase synthetase deficiency [6, 7, 8, 9]. Rarely, organic acidopathies such as HMG-coenzyme A lyase deficiency, 3-methylcrotonyl-coenzyme A carboxylase deficiency, cystinosis, Menkes disease, sulfite oxidase deficiency (molybdenum cofactor deficiency), and carbohydrate deficient glycoprotein syndrome may also cause ischemic stroke [10, 11, 12]. Fabry disease can have both ischemic and hemorrhagic complications. MELAS, myoclonus epilepsy and ragged-red fibers (MERRF), and Kearns-Sayre disease can have stroke-like episodes. Mitochondrial disorders may also show familial hemiplegic migraine and alternating hemiplegia.
3.4.2 Extrapyramidal movement disorders
Dyskinesis, choreoathetosis, and tremor are hallmarks of basal ganglia (BG) disorders [13]. Most IEMs have hyperkinetic movements. Very limited IEMs present with hypokinesia/hypokinetic rigid syndrome (HRS). HRS starting before 2 years of age is found in monoamine neurotransmitter defects, mitochondrial diseases, or neurodegeneration with brain iron accumulation disorders, while that starting in children above 2 years of age can be seen in many IEMs like Wilson disease, GLUT-1 deficiency, Niemann-Pick type C, Gaucher disease, and glutaric aciduria type 1 [14]. Motor symptoms show diurnal variation in monoamine neurotransmitter defects [1]. Status dystonicus may be seen in Wilson disease, pantothenate kinase associated neurodegeneration [15]. The distribution of movement disorders may also point toward particular pathology. Oromandibular dystonia may be seen in creatine deficiency, while dystonic hand syndrome is seen in AFG3L2-spinocerebellar ataxia type 28 [16].
3.4.3 Seizures
Seizures are common but non-specific. They may be missed in neonates and early infants unless specifically sought. This is because tonic clonic seizures are uncommon below 6 months of age, and mostly, the child has subtle signs like fixed glare, myoclonic jerks, particularly in UCDs, nonketotic hyperglycinemia, and organic acidopathies. Hypoglycemia-related seizures may be seen especially in fatty acid oxidation disorders and nesidioblastosis.
3.4.4 Tone abnormalities
Tone abnormalities also give some insight into the type of disease. Hypotonia may be seen in primary lactic acidosis, respiratory chain defects, multiple carboxylase deficiency, propionic acidemia (ketotic hyperglycinemia), 3-methylglutaconic aciduria, combined methylmalonic acidemia and homocystinuria, nonketotic hyperglycinemia, neonatal peroxisomal disorders (Zellweger syndrome), Menkes disease, sulfite oxidase deficiency, and UCDs [17]. Canavan disease and fatty acid oxidation defects may also have hypotonia. Hypertonia is seen in methylmalonic and isovaleric acidemias and Krabbe disease. Alternating hypo- and hypertonia suggests maple syrup urine disease (MSUD).
3.4.5 Peripheral neuropathy
Peripheral neuropathy is peculiar to lysosomal storage disorders (Krabbe disease, MLD, Farber disease), peroxisomal diseases (adrenomyelinoneuropathy), and galactossemia.
3.4.6 Visual disturbances
Visual disturbances are common in adrenoleukodystrophy (ALD), MLD, Krabbe disease, and LHON. It is pertinent to mention that in ALD, MLD, as well as Krabbe disease, there is a predominant involvement of posterior white matter including optic radiations, which well explains visual disturbances.
3.4.7 Psychiatric manifestations
Both acute metabolic crisis and end-stage disease may have psychiatric manifestations. Late onset diseases like acute intermittent porphyria, Wilson disease, and MLD may be missed when psychiatric symptoms are the initial manifestation [18].
3.5 Systemic abnormalities
It is very important to look for systemic manifestations, too. Failure to thrive is frequent in organic acidurias, UCDs, respiratory chain defects, and carbohydrate deficient glycoprotein syndrome. Mitochondrial diseases may show cardiomegaly; storage disorders or peroxisomal diseases mostly have heptosplenomegaly; skeletal abnormalities are seen in mucopolysaccharidoses and peroxisomal diseases. Meningitis and meningoencephalitis are also common in these patients and often trigger a metabolic crisis [19]. Neutropenia and thrombocytopenia are seen in organic acidopathies, while systemic hemorrhagic complications are found in ethylmalonic aciduria [20]. Anemia and thrombocytopenia are seen in Gaucher disease. Hemolytic anemia is seen in 5-oxoprolinuria. Acute pancreatitis may be seen in organic and aminoacidopathies, homocystinuria, MSUD, and cytochrome c oxidase deficiency [21, 22]. Inborn errors of metabolism, in particular, branched chain organic acidemias should be considered in children with pancreatitis of unknown origin.
3.6 Odor
The typical odor betrays some diseases. Isovaleric acidemia and glutaric aciduria type 2 have smelly cheese or sweaty feet odor; urine in MSUD has a sweet syrupy smell; multiple carboxylase deficiency has a cat urine smell; tyrosinemia smells like rotten cabbage. Urine of patients on carnitine treatment smells like rotten fish due to therapy-induced excessive trimethylamine formation and excretion.
3.7 Facies
Typical facies (depressed nasal bridge, epicanthal folds, short or long philtrum) are seen in organic acidopathies (propionic acidemia, methylmalonic aciduria, isovaleric acidemia, 3-methylglutaric aciduria). Facial dysmorphia is also seen in peroxisomal disorders and mucopolysccharidoses.
3.8 Skin stigmata
Patients with D-2-hydroxyglutaric aciduria have alopecia. Alopecia with skin rashes suggests biotinidase deficiency. Methylmalonic acidemia may lead to erosive desquamative dermatitis and hair loss. Skin pigmentation and scleroderma may occur in phenylketonuria. Hypopigmentation and photosensitivity are seen in Cockayne disease. Congenital ichthyosis is seen in Sjogren-Larson syndrome. Nipple abnormalities (inverted, hypoplastic, supernumerary) may be seen in propionic acidemia. Trichorrhexis nodosa, a beaded appearance of fragile hair, suggests arginosuccinic acid lyase deficiency, thus even helping in identifying the type of UCD [23].
3.9 Ophthalmologic abnormalities
Corneal clouding is very common in mucopolysccharidoses (except type II and III), many lysosomal storage disorders, multiple sulfatase deficiency, Fabry disease, Farber disease, some oligosaccharidosis, and cystinosis. Cataract is seen in galactossemia, isovaleric acidemia, 4-hydroxybutyric aciduria, cerebrotendinous xanthomatosis, and Cockayne disease. Kayser-Fleischer ring is pathognomonic of Wilson disease. Lens dislocation suggests homocystinuria and sulfite oxidase deficiency [24]. Cherry red spots help in identifying GM gangliosidoses, Niemann Pick disease, Farber disease, some mucolipidoses, and MLD. Retinitis pigmentosa is seen in many peroxisomal and mitochondrial disorders, neuronal ceroid lipofuscinosis, and abetalipoproteinemia. Electroretinographic abnormalities are seen in poliodystrophies and are exceptionally rare in leukodystrophies.
4. Imaging
MRI is the only radiological investigation relevant in assessing patients with neurometabolic disorders.
4.1 Sequences
The basic MRI sequences (T1W, T2W, TIW/IR) are mostly sufficient, but DWI, MR spectroscopy, and contrast studies add value in some cases. It is important to note that T1W/IR is better than T1W except for the detection of BG hyperintensity in hepatic encephalopathy, Krabbe disease, or GM2 gangliosidosis, where T1W is better than T1W/IR. Enhancement is better appreciated on T1W than T1W IR. T1W is recommended in children less than 12 months & T2W for the 12–18 month-age group for better delineation of myelin. Modular IR better delineates small lesions in the brainstem and deep gray matter nuclei. FLAIR differentiates cystic lesions from T2 hyperintensities of white matter (WM). T2W images are more sensitive than FLAIR for brainstem lesions. Longer TE and TR times should be used in T2W imaging to compensate for longer T2 relaxation due to higher water and lower myelin/lipid content in newborns and infants. FLAIR imaging is not very useful except in delineating cystic lesions as in Van der Knaap disease. The conventional spin echo technique is more sensitive than the fast spin echo technique but may not be practical at times due to longer scan times.
4.2 Structures to be assessed
Certain structures are more vulnerable at certain ages due to their specific energy and nutrient requirements [25]. Cerebral WM is vulnerable before 32nd week of gestation, while BG is vulnerable during the last three gestational months and first 3 years of life due to high metabolic rate. Myelinating and myelinated WM is involved in neonatal maple syrup urine disease (Figure 1). Homocystine accumulating in homocystinuria is destructive to fibrillin (resulting in lens subluxation) and toxic to vascular endothelium (predisposing to thrombus formation) (Figure 2). Hence, some brain structures need special attention while reading MRI of a patient suspected of having neurometabolic disorder. WM structures to be assessed are cerebral white matter, subcortical ‘U’ fibers, extreme capsule, external capsule, internal capsule, medullary laminae, corpus callosum, anterior commissure, mamillary bodies, central tegmental brainstem tract, and cerebellar white matter. GM structures to be assessed are cerebral cortex, claustrum, caudate nucleus, putamen, globus pallidus, thalamus, subthalamic nucleus, red nucleus, substantia nigra, dentate nucleus, and cerebellar cortex.

Figure 1.
A five day neonate with poor feeding, vomiting and seizures. a and b: DW images showing diffusion restriction in myelinated WM. c: Proton spectroscopy showing branched chain amino and keto acids at 0.9 ppm (arrow). Maple syrup urine disease.

Figure 2.
A one year child with right sided hemiparesis, loose skin. a and b: Axial T2W and coronal T2W/FLAIR images showing encephalomalacia suggestive of old infarct in left temporoparietal area. c: Time of flight MR angiography showing blocked left middle cerebral artery, left posterior cerebral artery and left posterior communicating artery. d: MR venography showing blocked left transverse sinuse: Fundoscopy image showing inferomedial dislocation of lens. Homocystinuria.
4.3 Approach to read MRI
A structured systematic approach that takes into account clinical information as detailed above usually helps define at least a broad group of disorders if not the disorder itself and gives further direction for work-up.
4.3.1 Rule out mimics of neurometabolic disorders
There is considerable overlap of MRI findings in neurometabolic brain disorders with other conditions like hypoxic ischemic encephalopathy (HIE), TORCH, viral infections, post viral demyelination, and so on (Figure 3). Newborns with HIE mostly stabilize 1–2 weeks after birth, while those with IEM mostly show progressive deterioration. WM changes of inborn errors of metabolism (IEM) need to be differentiated from periventricular leukomalacia, vasculitis, progressive multifocal leukoencephalitis, demyelinating diseases, HIV encephalitis, brucellosis, and toxic and postirradiation encephalopathy. Basal ganglia involvement should be distinguished from extrapontine myelinolysis, sequelae of prolonged hypoxemia, or anoxia [26]. Involvement of BG (globi pallidi, caudate nuclei and putamina) without thalamic involvement suggests metabolic diseases, while the thalamic and posterior parts of putamina are mostly affected in perinatal hypoxic-ischemic brain damage. Moreover, altered utilization of ATP may increase creatine in milder forms of HIE [27]. Wernicke encephalopathy may show hyperintensity in putamina, thalami, periaqueductal gray matter, and tectal plate, which may resemble Leigh disease, but hypothalamus and/or mamillary bodies are preferentially involved in Wernicke encephalopathy [28]. Superficial layers of cortex are typically involved in hypoglycemia, while deeper layers are involved in HIE [29]. Demyelination of the dorsal and lateral columns of the spinal cord in hyperhomocysteinemia may be confused with subacute combined degeneration [30].

Figure 3.
a and b: Axial T2W images showing periventricular T2 hyperintensities representing demyelination in a child with congenital rubella. c: Axial T2W image showing asymmetric T2 hyperintensities in left caudate nucleus, left lentiform nucleus (anteriorly), right lentiform nucleus (posteriorly), B/L thalami, left superior and right middle frontal gyri & right external capsule in a child with acute disseminated encephalomyelitis. d: Axial T1W image showing hyperintensities in B/L posterior lentiform nuclei and B/L thalami in a patient with HIE.
4.3.2 Myelination pattern
The myelination pattern assessment is of the utmost importance, whether myelination is normal or abnormal for the age. T1W images are better in assessing myelination before 12 months of age, while T2W images are better for children above 12 months. Myelinated structures appear slightly hyperintense on T1W and hypointense on T2W images. Normal myelination proceeds from central to peripheral, caudal to rostral, and dorsal to ventral. Sensory parts myelinate before motor parts. The brainstem, cerebellum, posterior limb of the internal capsule, optic tract, and perirolandic regions are myelinated in term neonates and seen on both T1W as well as T2W images. After that, T2W images lag behind T1W images in identifying myelination. Myelination of the anterior limb of the internal capsule is seen at 2–3 months on T1W images and 7–11 months on T2W images; that of the splenium of the corpus callosum is seen at 3–4 months on T1W images and 4–6 months on T2W images; and that of the genu of the corpus callosum at 4–6 months on T1W and 5–8 months on T2W images.
Abnormal myelination may include delayed myelination, demyelination, or dysmyelination. In addition to referring to the normal age of myelination, some illnesses in the first 18 months of age should also be taken into account before labeling delayed myelination. This is because myelination needs energy and nutrition, and any systemic (respiratory or cardiac) or neurologic disease such as meningoencephalitis during the initial 18–24 months of age can delay myelination, and the child can later catch up with myelination. Hence, it is important to repeat MRI at a gap of 6–12 months and look for the progress of myelination before labeling myelination delay as pathological. Demyelination refers to the loss of normal myelin, while dysmyelination refers to abnormal myelin. Such myelin is unstable and can lead to secondary demyelination. Demyelination appears hypointense on T1W images and hyperintense on T2W images, while hypomyelination is an unchanged pattern of deficient myelination on two successive MRI scans at least 6 months apart. Dysmyelination shows increased radial but normal axial diffusivities [31]. Metabolic disorders having a postnatal onset have normal myelin produced before the onset of metabolic derangement, while myelin produced after birth is defective and fragile. They show a myelination pattern like neonates or early infants with the oldest myelinated structures like the brainstem, cerebellum, and central corticospinal tracts being normal, while younger white matter structures show demyelination. L-hydroxyglutaric aciduria and homocystinuria show such a pattern.
4.3.3 Pattern recognition
Identifying the pattern of abnormal signal goes a long way in disease recognition [32]. It is important to recognize terminal zones of myelination that are classically located in the posterior periventricular region as well as frontotemporal subcortical regions and are normally seen up to the age of two years (Figure 4).

Figure 4.
a and b: Axial and coronal T2W images showing normal terminal zones of transition (arrows). These are abnormal above two years of age.
4.3.3.1 WM signal abnormalities’ pattern
WM abnormalities provide significant insight into the pathology. Anteroposterior gradient means signal abnormality starts anteriorly and is more prominent anteriorly (Figure 5a). This pattern is seen in Van der Knaap, Canavan, and Alexander diseases and L2-hydroxyglutaric aciduria, while posteroanterior gradient (disease starts posteriorly and is more prominent posteriorly) (Figure 5b) is seen in Krabbe disease and ALD. The centripetal gradient (signals abnormality progressing from the subcortical to the periventricular area) (Figure 5a) is seen in Canavan disease, Alexander disease, L2-hydroxyglutaric aciduria, and Van der Knaap disease, while the centrifugal gradient (signals abnormality progressing from the periventricular to the subcortical area) (Figure 5b) is seen in MLD, Krabbe disease, and ALD. External and extreme capsules are involved in L-2-hydroxyglutaric aciduria and fucosidosis (Figure 5a). Corpus callosum should be evaluated for signal and volume. It reflects the magnitude and possible progression gradient of involvement of the hemispheric WM. The inferior aspect of the body of corpus callosum shows prominent signal changes in Van der Knaap disease. The involvement of central tegmental structures of pons is non-specific but sensitive for metabolic and neurodegenerative processes. Corticospinal tracts should be analyzed from precentral gyrus, posterior limbs of the internal capsules, and cerebral peduncles up to decussation at the level of medulla (Figure 5c). The tigroid pattern of demyelination due to the sparing of perivenular white matter is seen in MLD and Palaezius Merzbacher disease (Figure 5d). Cerebellar hemispheric WM may be involved in Canavan disease, Krabbe disease, Van der Knaap disease, MLD, and ALD.

Figure 5.
a: Axial T2W image showing more WM signal abnormalities in anterior aspect than posterior (anteroposterior gradient) and subcortically than in periventricular aspect (centripetal gradient). b: Axial T2W image showing more WM signal abnormalities in posterior aspect than anterior (posteroanterior gradient) and periventrically than in subcortical aspect (centrifugal gradient). c: Axial T2W image showing hyperintensity in corticospinal tracts in cerebral peduncles (arrows). d: Axial T2W image showing T2 hyperintensity in B/L centrum semiovale sparing perivenular area giving tigroidappearance.
4.3.3.2 GM signal abnormalities’ pattern
Just like WM, GM signal abnormalities also help in suggesting diagnosis. Cortex is thin in GM2 gangliosidosis, Van der Knaap disease, and Canavan disease. Zellweger disease and fumaric aciduria may be associated with cortical dysplasias. The important thing to note is that diseases that are associated with structural malformations of the brain start prenatally and hence affect the normal development of the brain. Hypointensities suggestive of calcification or premature iron deposition suggest Wilson disease. The involvement or sparing of some structures helps in narrowing down the differentials. Claustra are spared in L-2-hydroxyglutaric aciduria but involved in Wilson disease (Figure 6a and b). Subthalamic nuclei are involved in kernicterus and leigh disease. Giant panda face is seen in Wilson disease and glutaric aciduria type I (Figure 6c). This happens due to the sparing of red nucleus, which stands out as hypointense in the background of hyperintense substantia nigra and periaqueductal WM on T2W images. Dentate nucleus is involved in organic acidopathies and cerebrotendinous xanthomatosis (Figure 6d). BG show signal changes in acute metabolic crises, kernicterus, and Wilson disease (Figure 7a) and are swollen in GM1 & GM2 gangliosidoses (Figure 7b). Cerebellar atrophy is seen in neuronal ceroid lipofuscinosis, 3-methylglutaconic aciduria, carbohydrate deficient glycoprotein syndrome, many lysosomal storage diseases, Menke’s disease, and mitochondrial diseases. Concomitant brainstem and cerebellar atrophy are suggestive of a neurodegenerative disease.

Figure 6.
a: Axial T2W image showing normal claustra in L2-hydroxyglutaric aciduria (white arrows). b: Axial T2W image showing T2 hyperintensity in claustra in Wilson disease (yellow arrows). c: Axial T2W image showing T2 hyperintensity in substantia nigra and periaqueductal WM with sparing of red nucleus giving ‘giant panda face appearance’. d: Axial T2W image showing T2 hyperintensity seen in B/L dentate nuclei (red arrows).

Figure 7.
a: Axial DW image showing diffusion restriction in basal ganglia in acute metabolic crisis. b: Axial T2W image showing swollen basal ganglia in GM2 gangliosidosis. c and d: Axial T2W images showing hyperintensity in left centrum semiovalein a patient with MLD (asymmetric involvement). Though both crus cerebri show signal abnormality, but left crus cerebri is more prominently involved.
4.3.4 Evolving lesions
Lesions evolve over time. In MLD, the subcortical ‘U’ fibers are initially spared but involved later on.
4.3.5 Symmetry
Looking for symmetry is equally important. Most of the neurometabolic disorders have a symmetric pattern of abnormality, but neurodegenerative diseases and toxic and hypoxic-ischemic encephalopathies are also symmetric. There may, however, always be some exceptions to this rule (Figure 7c and d).
4.3.6 Contrast enhancement
Few of the neurometabolic disorders show contrast enhancement. Most typical, rather diagnostic enhancement is seen in ALD where actively demyelinating inflammatory zone shows enhancement (Figure 8a). Alexander disease shows enhancement along the ependymal lining of lateral ventricles sometimes extending to more remote areas of frontal lobes and within deep GM structures. Krabbe disease shows patchy enhancement in periventricular white matter and cauda equina nerve roots [33] (Figure 8b).
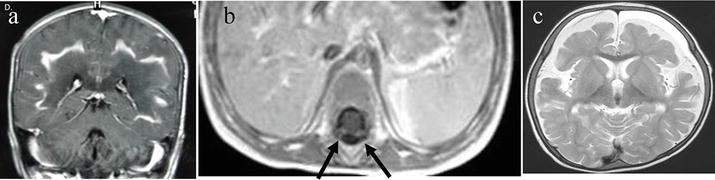
Figure 8.
a: T1W contrast enhanced coronal image shows enhancement of actively demyelinating zone in ALD. b: T1W contrast enhanced image shows enhancing cauda equina nerve roots in Krabbedisease (arrows). c: T2W axial image shows SDH in B/L frontal areas in a child with glutaric aciduria type I.
4.3.7 Associated findings
4.3.7.1 Subdural hematoma (SDH)
SDH may be seen in many disorders when atrophy sets in like glutaric aciduria type I (Figure 8c) [35], 3-methyl-crotonyl-glycinuria, and Menkes disease. This may be mistaken for child abuse.
4.3.7.2 Malformations
Some malformations are associated with particular neurometabolic disorders. Dysmorphic facies are seen in lysosomal storage disorders, peroxisomal disorders [36], and golgi complex disorders. Bilateral perisylvian polymicrogyria and germinolytic cysts are found in Zellweger disease [37], diffuse polymicrogyria and open operculae in fumaric aciduria [38], and pachygyria in glutaric aciduria type 2 and non-ketotic hyperglycinemia [39]. Callosal abnormalities are seen in nonketotic hyperglycenemia, glutaric aciduria type 2, pseudoneonatal adrenoleukodystrophy, salla disease, and mucolipidosis type IV [40, 41, 42]. Operculization is disturbed in glutaric aciduria type 1 [43]. Ethylmalonic aciduria shows Chiari I malformation and tethered cord [44].
4.3.8 Role of diffusion weighted imaging
DW imaging is based on the Brownian motion of particles. Neuropathologically, four types of edema are identified. Cytotoxic and myelin edema show restricted diffusion, while vasogenic and interstitial edema show increased diffusion, which is isotropic. These can be differentiated on DW imaging and not on T1W and T2W images. Hence, DW images enhance specificity. Vasogenic edema of non-myelinated WM is common in UCDs and sulfite oxidase deficiency. Scalloped ribbon pattern of diffusion restriction in the sulcal depth points toward UCDs where T1W and T2W images are non-specific [29]. In the context of neurometabolic disorders, cytotoxic edema is seen in acute gray matter diseases. Myelin edema is seen in active demyelination. In fact, we diagnosed a case of neonatal maple syrup disease on the basis of restricted diffusion (Figure 1). Diffusion restriction was seen in BG in patients of glutaric aciduria type I in a metabolic crisis (Figure 7a) and another patient with mitochondrial disease. Vasogenic edema may be seen in metabolic crises. DWI also helps in monitoring disease progression and differentiating between the active and burnt-out phase of diseases in both polio and leukodystrophies.
DTI detected differences in corticospinal tracts of neonates with Krabbe disease having an early onset of the disease. This is significant as DTI has the potential to be used as a marker of disease progression in neonates suspected to have Krabbe through screening programs, especially because enzyme activity and genetic mutation both cannot fully predict phenotype [45].
4.3.9 Proton spectroscopy
Proton spectroscopy provides molecular signatures of the tissue by identifying different biomolecules in the substrate. Short TE spectroscopy allows the detection of more metabolites and has a greater signal-to-noise ratio than longer TE; however, it is better to add long TE, too [46]. Being conversant with the normal spectrum at different ages helps. Generally, the N-acetyl aspartate (NAA) peak is small while choline is the most prominent in neonates. By 4 months of age, NAA becomes the most prominent peak; by 6 months of age, the spectrum assumes an “adult” appearance [47]. Lactate may be seen in the brain of premature infants and the first couple of weeks in term infants.
Lactate peak is seen in mitochondrial disorders, systemic lactic acidosis, metabolic crises of IEMs, hypoperfusion, and inflammation. We were able to diagnose a case of mitochondrial disorder correctly based on the very prominent lactate peak on spectroscopy, while the pediatrician suspected vanishing white matter disease. A genetic study revealed NDUFV1 mutation, suggesting mitochondrial disorder [48]. Estimating the lactate peak is better than CSF or plasma lactate in monitoring therapy in leigh disease. Moreover, demonstrating the lactate peak in a normal-appearing brain tissue better suggests IEM than lactate peak associated with focal lesion [27]. Glutamine and glutamate suggest UCDs, propionic acidemia, hepatic encephalopathy, and hypoxic-ischemic brain damage [49]. Phenylalanine (at 7.37 ppm) is the hallmark of phenylketonuria [50], and branched chain amino acids and ketoacids (at 0.9 ppm) of maple syrup urine disease, while glycine (at 3.55 ppm) is seen in nonketotic hyperglycinemia. Increased NAA is seen in Canavan disease [51]. The absence of creatine peak suggests guanidoacetate methyl-transferase deficiency. Spectroscopy may even prognosticate IEMs. The Myoinositol peak shows an inverse relation with the severity of UCD [46].
4.3.10 Pathognomic MRI patterns
Based on the above detailed approach to reading MRI, some neurometabolic disorders have pathognomonic MRI patterns. These include L-2-hydroxyglutaric aciduria (Figure 9), glutaric aciduria type 1 (Figure 10), neonatal maple syrup urine disease (Figure 1), Zellweger disease, X-linked ALD (Figure 11), Canavan disease, Alexander disease (Figure 12), Van der Knaap disease (Figure 13), leukodystrophy with brainstem and spinal cord involvement and high lactate, and mucopolysaccharidoses (Figure 14).

Figure 9.
Two year female had delayed milestones and learning disabilities. a–c: Axial T2W images at different levels showing T2 hyperintensities in WM with clear anteroposterior and centripetal gradients. Subcortical ‘U’ fibresare destroyed at many places (arrows). d: MR spectroscopy in involved areas shows reduced NAA and choline peaks. L2-hydroxyglutaric aciduria.

Figure 10.
A 1.5 year old boy had seizures, vomiting and altered sensorium after fever. a and b: Axial T2W and T2W/FLAIR axial images showing atrophy in B/L frontal and temporal areas with improper operculization seen as open operculae. SDH of different ages is seen in B/L frontal areas, subacute on left side and chronic on right side. c and d: DW and ADC maps show diffusion restriction in B/L corpora striata suggestive of acute metabolic crisis consistent with clinical presentation. Glutaric aciduria type I with acute metabolic decompensation.

Figure 11.
An 8 year male with declining academic performance, loss of speech, and spasticity. a: Axial T2W image shows T2 hyperintensity in WM mainly in periventricular area in B/L parietal lobes and splenium of corpus callosum. b: Axial T2W/FLAIR images showing some suppression of signal centrally, not peripherally suggesting central necrosis and peripheral edema. c and d: Axial and coronal T1W contrast images showing enhancement of actively demyelinating intermediate zone. e: MR spectroscopy in outer edematous zone showing normal peaks. f: MR spectroscopy in intermediate zone showing increased choline and reduced NAA peak suggestive of active demyelination. g: MR spectroscopy in inner zone showing prominent choline peak. While NAA and creatine peaks are even smaller than intermediate zone suggestive of necrotic inner zone (burnt out area). X-linked adrenoleukodyatrophy.

Figure 12.
A one year old macrocephalic female child had delayed milestones, failure to thrive and difficulty in swallowing. a: Axial T2W image showing hyperintense signal in B/L caudate and lentiform nuclei which are also slightly swollen. There is sparing of thalami. b: Axial T2W image at a slightly higher level shows hyperintensity in WM of B/L frontal area with involvement of subcortical ‘U’ fibers. Alexander’s disease.

Figure 13.
A seven year Aggarwal boy had delayed milestones and learning disability. a & b: Axial T2W and T2W/FLAIR images showing subcortical cysts in B/L temporal, frontal and parietal areas. c: Axial T2W image at a higher level showing hyperintensity in WM of B/L frontal and parietal areas, more prominent in frontal areas along with destruction of ‘U’ fibers in frontal areas, showing anteroposterior and centripetal gradient of signal change. Van der knap disease.

Figure 14.
A five year old boy had corneal clouding, dysmorphic face, short stature and hepatosplenomegaly. a: Axial T2W image showing periventricular T2 hyperintensity and prominent perivascular spaces (arrow). b: Axial T1W image showing these areas as hypointense. c: Sagittal image of dorsolumbarspine showing bullet shaped D12 vertebra. d: T2W sagittal image of craniovertebral (CV) junction showing narrowing of foramen magnum and slight impingement on cervicomedullaryjunction. Mucopolysaccharidosis.
4.3.11 Suggestive MRI patterns
Diseases like MMA (Figure 15), 3-methyl glutaconic aciduria, beta-ketothiolase deficiency, the late onset form of maple syrup urine disease, homocystinuria (Figure 2), Krabbe disease (Figure 16), MLD (Figure 17), GM2 gangliosidosis (Figure 18), vanishing white matter disease (Figure 19), leigh disease (Figure 20), Menke disease (Figure 21), Wilson disease (Figure 22), and mitochondrial disorders (Figure 23) have suggestive MRI patterns. Though not having exactly suggestive patterns, but we were able to diagnose UCD (Figure 24) based on the age of presentation, hyperammonemia, spectroscopy, and other clinical features.

Figure 15.
A 2.5 month female had seizures, failure to thrive and poor feeding. a: Axial T2W image showing hyperintensity in B/L globipallidi and intermedullary laminae. b: Axial T1W image shows the involved areas as hypointense. c and d: DW and ADC map show diffusion restriction in B/L globipallidi methylmalonic acidemia.

Figure 16.
A six month male presented with irritability and refusal to feed along with episodes of tonic spasms. a: CT scan showing hyperdense thalami b: Axial T2W image showing subtle hyperintensity in posterior limbs of internal capsules (posteroanterior gradient) c: Axial T2W image at a higher level showing periventricular hyperintensity more prominent posteriorly. d: Axial T1W contrast enhanced image showing enhancement of cauda equina nerve roots (arrows).

Figure 17.
A five year old boy presented with ataxia and regression of milestones. a & b: Axial T2W images at slightly different levels show hyperintensity in B/L centrum semiovalehaving typical tigroidpattern due to sparing of perivenular area. Though the signal abnormality is quite widespread, there is sparing of subcortical ‘U’ fibers. c: Axial T1W image shows hypointensityin same area. d: DW image shows hyperintensity in both genu and splenium of corpus callosum. Note that splenium is thin as compared to genu suggesting that atrophy has set in splenium, while involvement of genu is comparatively recent. This indirectly reinforces posteroanterior gradient. e: MR spectroscopy shows an mI peak at 3.56 ppm (arrow). Patient had elevated urinary sulfatides thus confirming metachromatic leukodystrophy.

Figure 18.
A seven month old female had failure to thrive and generalized tonic clonicseizures. Her head circumference was also increased. a: Axial T2W image showing comparatively swollen corpora striata, slight hyperintensity in B/L external and extreme capsules and hypointensityin B/L thalami. b: Axial T2W/FLAIR image shows swollen corpora striata and hyperintense thalami. Fundus examination of the child showed cherry red spots suggesting GM2 gangliosidosis.

Figure 19.
A three year female showed gait disturbance and mild learning disability a and b: Axial T2W images show wide gyri, destruction of subcortical ‘U’ fibers at places, rarefaction with cyst formation in B/L periventricular areas, more prominently seen radiating along frontal and occipital horns of B/L lateral ventricles. c: Axial T2W/FLAIR image shows fluid signal in cystic areas WM. d: MR spectroscopy shows significantly reduced NAA, choline and creatinine peaks. Vanishing white matter disease.

Figure 20.
A six month old male had delayed milestones, nystagmus and seizures. a–c: Axial T2W images at different levels show hyperintensity in B/L dentate nuclei, WM of B/L frontotemporal areas, B/L external capsules and corticospinal tracts in crus cerebri. d: DW image showing diffusion restriction in B/L frontal areas and B/L dentate nuclei. e: MR spectroscopy in normal appearing WM shows lactate peak. Leigh disease.

Figure 21.
A six month male child presented with seizure and lethargy. a: Photograph of head showing coarse, dry, lusterless, fragile hair (pili torti). b: DW axial image showing diffusion restriction in B/L periventricular area. c: Sagittal T2W image showing tortuous anterior cerebral arteries. d: Time of flight MR angiogram showing all intracranial arteries and circle of willisto be tortuous. Menkes disease.

Figure 22.
A five year old boy had dystonia and swallowing difficulties. a: Axial T2W image at the level of midbrain shows ‘giant panda face’. b: Axial T2W image at the level of basal ganglia shows necrosis of claustra (arrows) and subtle hyperintensity in B/L basal ganglia and thalmi c: Axial T2W image at higher level shows hyperintensity in WM of B/L frontal areas. d: Axial T2W image of liver shows mixed density of liver suggestive of cirrhosis. e: Slit lamp examination of eyes shows the pathognomonic Kaiser Fleischer ring at the periphery of cornea. Wilson disease.

Figure 23.
A 2.5 year old male child had developmental delay, learning disability and myopathy. a and b: Axial T2W images at different levels show hyperintensity along with cyst formation in B/L corpora striata, periventricular area and deep WM. c: Axial T1W image shows the involved areas/cysts to be hypointense. d: MR spectroscopy shows a prominent lactate peak and reduced NAA peak. Mitochondrial leukodystrophy.

Figure 24.
A 20 days ole neonate presented with lethargy, vomiting, hypotonia, hypothermia, and hyperventilation. a-c: Axial T2W images at different levels show brain swelling and vasogenic edema in B/L frontal and peri-insular areas. d and e: Axial T1W images show hypointensityin same areas. f: MR spectroscopy shows prominent glutamine-glutamate peaks at 2.2–2.4 ppm (arrow). The child had respiratory alkalosis. Blood ammonia level was elevated. A diagnosis of urea cycle disorders was made.
5. Associations
Some inborn errors may coexist, making the picture even more complex. Aminoacidurias may be associated with organic acidemias (e.g., association of homocystinuria with MMA).
6. Biochemical investigations
Analysis of body fluids (blood, urine, CSF), blood pH, glucose, ammonia, lactic acid, urine ketone bodies, and hepatic profile can help a lot in arriving at a diagnosis. Thrombocytopenia may be seen in organic acidemias like methylmalonic, propionic, and isovaleric acidemias [4]. Ammonia is normal or borderline elevated in maple syrup urine disease, UCDs, and organic acidemias. However, blood pH shows respiratory alkalosis in UCDs and metabolic acidosis in organic acidemias. Lactic acidosis with hypoglycemia is seen in HMG CoA lyase deficiency [52], some subtypes of 3-methylglutaconic acidemia, glutaric aciduria type 2, and medium and long chain fatty acid oxidation disorders. Oxidative phosphorylation diseases like primary lactic acidosis show lactic acidosis and normal glucose levels. Different forms of lactic acidosis like pyruvate dehydrogenase deficiency, pyruvate carboxylase deficiency, and cytochrome c oxidase deficiency may be identified with the help of the pyruvate-lactate ratio. Severe metabolic acidosis without lactic acidosis and ketosis is seen in 5-oxoprolinuria. Hypoglycemia is always present in fatty acid oxidation disorders, holocarboxylase synthetase deficiency, and neonatal onset 3-methylglutaconic aciduria and frequent in HMG coenzyme A lyase deficiency and can be seen in pyruvate carboxylase deficiency, propionic, methylmalonic ethylmalonic, and isovaleric acidemias. Fatty acid oxidation defect and HMG coenzyme A lyase deficiency show nonketotic hypoglycemia. Persistent hyperinsulinemic hypoglycemia in newborns of diabetic mothers and patients on insulin treatment may present as nonketotic hypoglycemia. Ketotic hypoglycemia can be seen in defects of gluconeogenesis, glycogenolysis, organic acidemias (isovaleric, propionic, and methylmalonic acidemia), galactossemia, and fructosemia. It may also be found in sepsis, adrenal insufficiency, dehydration, and acute GIT problems (vomiting, diarrhea). Hypoglycemia is never seen in beta-ketothiolase deficiency, 4-hydroxybutyric aciduria, late onset 3-methylglutaconic aciduria, biotinidase deficiency, glutaric aciduria type 1, and the late onset form of maple syrup urine disease. Diabetic ketoacidosis may be associated with hyperglycemia. Liver disease is seen in fatty acid oxidation and oxidative phosphorylation disorders. High plasma levels of phytanic, pipecolic, and very long chain fatty acids (VLCFA), and bile acid intermediates are common in peroxisomal disorders. CSF examination may be helpful in glutaric aciduria type I, L-2-hydroxyglutaric aciduria, propionic acidemia, methylmalonic acidemia, and certain mitochondrial diseases as the levels of abnormal metabolites in CSF may exceed those in plasma [53].
7. Advanced laboratory methods
Gas chromatography and mass spectroscopy of urine, high pressure liquid chromatography, tandem mass spectroscopy of blood, specific enzyme activity studies of fibroblasts, peripheral blood cell culture, and biopsy specimen are some other methods that can be helpful. PET may be more sensitive than MRI in the early detection of hypometabolism. Phosphorus MRS is particularly helpful in mitochondrial diseases. 31P MRS is very helpful in imaging organic acidurias (especially during metabolic decompensations and monitoring response to therapy) as it can measure in vivo pH. 13C isotope has low abundance in nature. To measure it, carbon MRS requires a high magnetic field strength. A technique referred to as proton observed carbon edited spectroscopy may be implemented on commercially available 1.5 T systems. Various metabolic pathways and their functions may be studied by administering 13C labeled metabolites.
8. Histological diagnosis
Some diseases are amenable to histopathologic diagnosis like peripheral nerve biopsy in MLD and Krabbe disease, muscle biopsy in mitochondrial disorders, and skin, mucosa, or liver biopsy in storage diseases and Wilson disease.
9. Diagnostic pitfalls
It is important to be mindful that one enzyme deficiency may affect other metabolic pathways also, thus complicating the diagnosis. Propionyl coenzyme A inhibits pyruvate dehydrogenase (energy production and gluconeogenesis), N-acetyl-glutamate synthetase (urea cycle), and glycine cleavage system. Hence, propionic acidemia presents with acidosis (metabolic and lactic), hypoglycemia, hyperammonemia, ketosis, and increased glycine level (as also seen in methylmalonic acidemia). Hyperammonemia may erroneously suggest UCD. Because the cofactor of the enzyme is biotin, other enzyme defects related to biotin deficiency (impairment of holocarboxylase synthetase or biotinidase) may cause differential diagnostic problems. Likewise, fatty acid synthesis, gluconeogenesis, and amino acid catabolism are impaired in 3-methyl-crotonyl-glycinuria, leading to diverse presentations [3].
10. Proteomics-based diagnosis
The proteomics approach allows the studying, identification, and quantification of total protein contents of a cell, some of which may act as markers for the disease. Mass Spectroscopy (MS), 2D Electrophoresis, LC-MS-MS, and MALDI-TOF/TOF are major proteomics methods in use. Mass spectroscopy is a promising analytical technique that allows semiquantitative and qualitative assessments of proteins by measuring the mass-to-charge ratio, thus allowing protein sequencing and identification with high sensitivity and accuracy [54]. Mass spectroscopy may allow the analysis and quantification of thousands of proteins in a single go. However, despite substantial advances in sample throughput, sensitivity, specificity, and reproducibility, concerns about the presence of false positive, time, speed, and cost remain. Automation in mass spectrometry made it possible to use this technology for newborn screening. Tandem mass spectrometry (TMS) is a sophisticated proteomic technique whereby two mass spectrometers are made to operate in tandem to analyze, quantify, and determine the structure of proteins. With just a drop of blood, more than 30 disorders may be quickly screened in newborns with no or minimal false positives.
11. Molecular genomic aspects
Whereas the conventional biochemical tests are time consuming, the metabolomics-based tests and procedures compounded with the Systems Medicine approach are more precise to comprehensively address IEMs, many of which are greatly influenced by complex gene-environment interactions [55, 56]. Any genetic disease can be studied at the level of genes/genome/DNA (genomics), RNA (transcriptomics), or proteins (proteomics). Gene sequencing enables to decode base by base information of the genome. The conventional Sanger Sequencing was difficult and cumbersome to perform. Its automation provided a robust, speedy, and cost-effective sequencing solution. Next Generation Sequencing (NGS) is a preferred genome-wide tool for diagnosing genomic imbalances for which there are multiple identifiable molecular targets. It is a massively parallel sequencing technology allowing ultra-high throughput, scalability, and speed.
Whole genome sequencing (WGS), Whole exome sequencing (WES), targeted exome sequencing (TES), and clinical exome sequencing (CES) can be used for comprehensively analyzing entire genomes. WGS provides a high resolution one-to-one viewing of the whole of the bases on the genome, capturing both large and small variants. Tremendous amount of data is generated in a short time, which enables the assembling of novel genomes. Gene expression array, chromosomal microarray analysis (CMA), and the array comparative genome hybridization (array CGH) are whole-genome high resolution diagnostic procedures that enable the detection of genome-wide gene expression profile, deletion and/or duplication of one or more sections of DNA, or detection of large deletions/duplications in the genome. In recent years, all these methods have been used with an attempt to capture the metabolic signatures in several neurometabolic diseases and IEMs [57, 58, 59]. Using WGS, single nucleotide variations may be studied to pin point functional variants to find the association of polymorphic genes to diseases, thus allowing predicting disease susceptibility. There may be situations where looking for genetic variations across the entire length of genome might be of potential benefit as the decision to go for a specific customized and personalized treatment would not be possible otherwise in the absence of the desired diagnosis. Because WGS may also cover variants involving InDels, chromosomal rearrangements, copy number variations, as well as the trinucleotide expansions, it is considered to be more sensitive.
In situations where the gene product might be of pathological interest, whole exome sequencing (WES) or clinical exome sequencing (CES) may be the preference. WES involves sequencing the protein-coding regions of the genome, which constitutes less than 2% of the genome but contains ~85% of known disease-related variants [60]. It detects variations in the coding regions. WES allows to focus on genes most likely to affect the phenotype. However, DNA variations outside the exons can also affect gene activity and hence phenotype. These variations may be missed by WES but may possibly be detected by combining the DNA and RNA-Seq analyses of specific genes [61]. WES is a cost-effective alternative to WGS where more manageable and analyzable data are produced compared to WGS. CES is used for the detection of exomic variants with known clinical association with a disease and has been gradually recognized as an affordable option as specifically the clinical exome is sequenced and only the variants of plausible clinical relevance are reported.
Alternatively, only the specific region of the genome that is of clinical relevance is sequenced instead of the whole genome. This approach is called targeted sequencing and is better in terms of cost and speed as WGS and WES are prohibitively expensive. Targeted sequencing enables multiple genes to be assessed across many samples in parallel and generates a focused and manageable amount of data, with a higher coverage allowing accurate identification of rare variants with high sensitivity and specificity. It is ideal for the detection of causative mutations and variants like Single Nucleotide Polymorphisms (SNPs) and InDels across multiple genomic regions with a short turnaround time and high depth. It can also detect copy number variations (CNVs) and the structural variants (SVs). Targeted sequencing allows the identification of variants at low allele frequencies and identifies causative novel or inherited mutations in a single assay. When a set of genes is known to cause a disease, targeted gene panel sequencing (TGPS) is performed. Gene panels are basically collections of genes grouped for the purpose of simultaneous testing of all the genes known to cause a particular disease, syndrome, or phenotype and enable deep sequencing. Although data are only generated for genes on the panel, virtual panels can also be added to WES or WGS-generated data to analyze sequencing information only relevant to the genes in the virtual panel(s). When there are multiple genomic areas of interest, gene panel sequencing is preferred. Focused panels have been devised, which contain a select set of genes or gene regions that are either known to cause a disease or have known or suspected associations with the disease or phenotype under investigation. Since a limited number of genes are included in the gene panel, it limits the number of variants requiring interpretation as well as results in fewer variants of uncertain significance (VUS). Compared to WGS and WES, TGPS allows greater depth and coverage. In the event of using a virtual panel, reanalysis of data in future is possible particularly for the patients in whom no variants were initially found. This is how additional genes associated with a disease can be analyzed for variants over time. Targeted gene panel sequencing has been successfully used for investigating complex neurometabolic phenotypes [62, 63, 64]. It, however, is unable to identify novel causative genes as it is limited to only those genes already known to cause the disease. Also, once a gene panel has been devised, it is challenging to add new genes to it. Besides gene panel sequencing is incapable of detecting structural rearrangements or copy number variants.
12. Collaborative multi‘omics’ approach
Neurometabolic imaging coupled with modern genomics, proteomics, and system medicine tools have revolutionized both the accuracy and precision of diagnosis of IEMs. Molecular imaging further adds to diagnostic accuracy and efficiency. Whereas CT and conventional MR imaging provide mere structural and anatomical details, molecular imaging allows the assessment of fine details of the molecular and cellular interplay of physiological events. Molecular imaging allows the metabolic activity of the affected cells to be directly visualized in vivo [27, 65, 66] and hence may be very useful in planning personalized therapy.
Although INMDs are now being diagnosed at a greater rate and precision owing to advances in next-generation sequencing technology, the pace of their diagnoses still remains slow particularly due to a lack of data on immediate functional significance of an identified variant in terms of uncertainty of its pathogenic effect, the challenges associated with prioritization of variants of unknown significance, or the candidate disease genes for potential differential diagnosis. The ‘Phenome’ signifies the sum of all the traits and characteristics expressed by a cell. ‘Phenomics’ is the study of the summation of qualitative and quantitative traits including clinical, biochemical, and imaging characteristics and may be treated as the metabolic fingerprint of a cell. It is about the changes that occur in response to genetic mutation and environmental influences. Combined use of genomics, proteomics and metabolomics may be of immense utility in understanding the metabolic diseases where the causation and connection between the genetic makeup and disease predisposition pose challenges for diagnosis [67]. With improvement in knowledge and technology, the term deep clinical phenotyping is increasingly gaining significance. Phenotyping enables comprehensive characterization of the discrete components of a patient’s clinical and biochemical phenotype. The “multiomics” approaches combined with phenomic annotation are increasingly gaining importance for the development of a stronger knowledge base, improvement in diagnostic procedures, and expansion of genomics, epigenomics, and metabolomics data interpretation tools. A cohesive and integrated effort involving state-of-the-art NGS, metabolomics technologies, and in depth clinico-radiological-cellular & molecular phenotyping should definitely prove valuable for developing newer diagnostic modalities for the diseases that otherwise remain difficult to diagnose at present due to their inherent complexity [68, 69].
13. Relevance
The phenotypical complexities often lead to delay or underdiagnosis of INMDs. Even after diagnosis, the prognosis is mostly guarded. This has led to a comparative lack of interest in such patients and hence slow progress in this field. This is also evident from the fact that most of the literature that we can refer to is quite old. In view of guarded prognosis, genetic counseling, early diagnosis, and preventive strategies are as important as ever in management. With more precise and early diagnosis, prognosis and quality of life in some of the diseases has improved. Early diagnosis can take the form of antenatal or postnatal screening/diagnosis. Deficient enzyme activity can be demonstrated in cultured amniocytes and chorionic villous samples as in propionic acidemia, UCDs, or Menke disease. Prenatal US and MRI may suggest diseases such as Zellweger disease, glutaric aciduria type 1, and nonketotic hyperglycinemia. Tandem mass spectroscopy (TMS) in neonatal urine and blood samples can screen for glutaric aciduria type I, classical phenylketonuria, homocystinuria, tyrosinemia, and histidinemia [70]. This preclinical screening can help in early intervention, leading to possible prevention or minimizing of the effects of the disease. Single gene testing may be done in cases where MRI is almost diagnostic. Suggestive MRI patterns may point to a disease category where a particular gene panel can be analyzed.
Some INMDs are incompatible with life, and even early diagnosis does not help in such cases. Few examples being neonatal peroxisomal disorders, severe forms of propionic acidemia, and maple syrup urine disease. Dietary control and/or supplementation may help others. Biotin supplementation may prevent irreversible brain damage in 3-methyl-crotonyl-glycinuria. High protein intake may aggravate UCDs. Bone marrow transplantation may be helpful in MLD, Krabbe disease, and some mucopolysaccharidoses [71]. It works well in MLD in early stages (preferably before symptoms appear) but can work even late in Krabbe disease, even reversing some symptoms. The transplantation of umbilical cord blood stem cells from unrelated donors before the onset of symptoms in Krabbe disease may help improve the outcome [72]. There can be various approaches for removing enzyme-related defects—restoration of a minimal enzymatic activity/enzyme substitution for achieving the optimal metabolic function, limiting or lessening of the accumulation of toxic substrates, or substitution of the deficient product. The mutated genes may be repaired or replaced with the normal copy of genes to allow the cell to resynthesize the normal protein. Intervention may be done at a metabolite level in order to regulate the metabolic flux [73]. Given the accessibility to the newer genomics, proteomics, and metabolomics tools and the issues of affordability, efficacy, and safety with the new therapeutic options, gene- and cell-based therapies [74, 75, 76] and fetal neuronal transplants [77] may prove successful in treating INMDs. Transplantation of kidney, liver or both is an option to manage late systemic complications of some diseases like Wilson disease or MMA.
This is just a glimpse of now available management options of INMDs to emphasize the role and relevance of early and proper diagnosis. Detailed description of treatment options is outside the scope of the present chapter.
14. Conclusion
Though properly diagnosing IEM is a challenge, an integrated structured approach taking into account the age and type of presentation, clinical features, odor, skin stigmata, imaging (both conventional and molecular imaging), biochemistry, histology, metabolomics (including genomics, transcriptomics and proteomics), and phenomics should pave the way for early diagnosis and new therapeutic regimens to effectively treat inborn neurometabolic disorders [78].
References
- 1.
Ortigoza-Escobar JD. A proposed diagnostic algorithm for inborn errors of metabolism presenting with movements disorders. Frontiers in Neurology. 2020; 11 :582160. DOI: 10.3389/fneur.2020.582160 - 2.
Navarrete R, Leal F, Vega AI, Morais-López A, Garcia-Silva MT, MartínHernández E, et al. Value of genetic analysis for confirming inborn errors of metabolism detected through the spanish neonatal screening program. European Journal of Human Genetics. 2019; 27 (4):556-562. DOI: 10.1038/s41431-018-0330-0 - 3.
Yoon HJ, Kim JH, Jeon TY, Yoo SY, Eo H. Devastating metabolic brain disorders of newborns and young infants. Radiographics. 2014; 34 (5):1257-1272. DOI: 10.1148/rg.345130095 - 4.
Fischer AQ , Challa VR, Burton BK, McLean WT. Cerebellar hemorrhage complicating isovaleric acidemia: A case report. Neurology. 1981; 31 (6):746-748. DOI: 10.1212/wnl.31.6.746 - 5.
Shigematsu Y, Mori I, Nakai A, Kikawa Y, Kuriyama M, Konishi Y, et al. Acute infantile hemiplegia in a patient with propionic acidemia. European Journal of Pediatrics. 1990; 149 (9):659-660. DOI: 10.1007/BF02034758 - 6.
Ruano MM, Castillo M, Thompson JE. MR imaging in a patient with homocystinuria. American Journal of Roentgenology. 1998; 171 :1147-1149 - 7.
Mamourian AC, du Plessis A. Urea cycle defect: A case with MR and CT findings resembling infarct. Pediatric Radiology. 1991; 21 (8):594-595. DOI: 10.1007/BF02012608 - 8.
Thompson JE, Smith M, Castillo M, Barrow M, Mukherji SK. MR in children with L-carnitine deficiency. American Journal of Neuroradiology. 1996; 17 (8):1585-1588 - 9.
Sperl W, Felber S, Skladal D, Wermuth B. Metabolic stroke in carbamyl phosphate synthetase deficiency. Neuropediatrics. 1997; 28 (4):229-234. DOI: 10.1055/s-2007-973705 - 10.
Steen C, Baungartner ER, Duran M, Lehnert W, Suormala T, Fingerhut SR, et al. A metabolic stroke in isolated 3-methylcrotonyl-CoA carboxylase deficiency. European Journal of Pediatrics. 1999; 158 (9):730-733. DOI: 10.1007/s004310051189 - 11.
Mize C, Johnson JL, Rajagopalan KV. Defective molybdopterin biosynthesis: Clinical heterogeneity associated with molybdenum cofactor deficiency. Journal of Inherited Metabolic Disease. 1995; 18 (3):283-290. DOI: 10.1007/BF00710416 - 12.
Van Geet C, Jaeken J. A unique pattern of coagulation abnormalities in carbohydrate- deficient glycoprotein syndrome. Pediatric Research. 1993; 33 (5):540-541. DOI: 10.1203/00006450-199305000-00024 - 13.
Hoon AH, Reinhardt EM, Kelley RI, Breiter SN, Morton H, Naidu S, et al. Brain magnetic resonance imaging in suspected extrapyramidal cerebral palsy: Observations in distinguishing genetic-metabolic from acquired causes. The Journal of Pediatrics. 1997; 131 (2):240-245. DOI: 10.1016/s0022-3476(97)70160-4 - 14.
Garcia-Cazorla A, Ortez C, Pérez-Dueñas B, Serrano M, Pineda M, Campistol J, et al. Hypokinetic-rigid syndrome in children and inborn errors of metabolism. European Journal of Paediatric Neurology. 2011; 15 (4):295-302. DOI: 10.1016/j.ejpn.2011.04.013 - 15.
Kurian M, McNeill A, Lin JP, Maher ER. Childhood disorders of neurodegeneration with brain iron accumulation (NBIA). Developmental Medicine and Child Neurology. 2011; 53 :394-404. DOI: 10.1111/j.1469-8749.2011.03955.x - 16.
Pierson TM, Adams D, Bonn F, Martinelli P, Cherukuri PF, Teer JK, et al. Whole-exome sequencing identifies homozygous aFG3L2 mutations in a spastic ataxia-neuropathy syndrome linked to mitochondrial m-AAA proteases. PLoS Genetics. 2011; 7 (10):e1002325. DOI: 10.1371/journal.pgen.1002325 - 17.
Poggi-Travert F, Fournier B, Poll-The BT, Saudubray JM. Clinical approach to inherited peroxisomal disorders. Journal of Inherited Metabolic Disease. 1995; 18 (Suppl 1):1-18. DOI: 10.1007/BF00711425 - 18.
Estrov Y, Scaglia F, Bodamer OA. Psychiatric symptoms of inherited metabolic disease. Journal of Inherited Metabolic Disease. 2000; 23 (1):2-6. DOI: 10.1023/a:1005685010766 - 19.
Al Essa M, Rahbeeni Z, Jumaah S, Joshi S, Al Jishi E, Rashed MS, et al. Infectious complications of propionic acidemia in Saudi Arabia. Clinical Genetics. 1998; 54 (1):90-94. DOI: 10.1111/j.1399-0004.1998.tb03702.x - 20.
Ozand PT, Rashed M, Millington DS, Sakati N, Hazzaa S, Rahbeeni Z, et al. Ethylmalonic aciduria: An organic acidemia with CNS involvement and vasculopathy. Brain & Development. 1994; 16 (Suppl):12-22 - 21.
Kahler SG, Sherwood WG, Woolf D, Lawless ST, Zaritsky A, Bonham J, et al. Pancreatitis in patients with organic acidemias (comment). The Journal of Pediatrics. 1994; 124 (2):239-243. DOI: 10.1016/s0022-3476(94)70311-6 - 22.
Simon P, Weiss FU, Zimmer KP, Koch HG, Lerch MM. Acute and chronic pancreatitis in patients with inborn errors of metabolism. Pancreatology. 2001; 1 (5):448-456. DOI: 10.1159/000055846 - 23.
Brusilow S, Horwich A. Urea cycle enzymes. In: Scriver CR, Beaudet AL, Sly WS, Valle D, Childs B, Kinzler KW, et al., editors. The Metabolic and Molecular Bases of Inherited Disease. 8th ed. New York: McGraw-Hill; 2001. pp. 1909-1963. Chapter 85 - 24.
Edwards MC, Johnson JL, Marriage B, Graf TN, Coyne KE, Rajagopalan KV, et al. Isolated sulfite oxidase deficiency: Review of two cases in one family. Ophthalmology. 1999; 106 (10):1957-1961. DOI: 10.1016/S0161-6420(99)90408-6 - 25.
Johnston MV, Hoon AH Jr. Possible mechanisms in infants for selective basal ganglia damage from asphyxia, kernicterus, or mitochondrial encephalopathies. Journal of Child Neurology. 2000; 15 (9):588-591. DOI: 10.1177/088307380001500904 - 26.
Ho VB, Fitz CR, Chuang SH, Geyer CA. Bilateral basal ganglia lesions: Pediatric differential considerations. Radiographics. 1993; 13 (2):269-292. DOI: 10.1148/radiographics.13.2.8460220 - 27.
Lai LM, Gropman AL, Whitehead MT. MR Neuroimaging in pediatric inborn errors of metabolism. Diagnostics. 2022; 12 (4). DOI: 861, 10.3390/diagnostics12040861 - 28.
de Oliveira AM, Paulino MV, Vieira APF, McKinney AM, da Rocha AJ, dos Santos GT, et al. Imaging patterns of toxic and metabolic brain disorders. Radiographics. 2019; 39 (6):1672-1695. DOI: 10.1148/rg.2019190016 - 29.
Poretti A, Blaser SI, Lequin MH, Fatemi A, Meoded A, Northington FJ, et al. Neonatal neuroimaging findings in inborn errors of metabolism. Journal of Magnetic Resonance Imaging. 2013; 37 (2):294-312. DOI: 10.1002/jmri.23693 - 30.
Hao M, Zhang Y, Hou S, Chen Y, Shi M, Zhao G, et al. Spinal cord demyelination combined with hyperhomocysteinemia: A case report. Neuropsychiatric Disease and Treatment. 2014; 10 :2057-2059. DOI: 10.2147/NDT.S70963 - 31.
Song SK, Sun SW, Ramsbottom MJ, Chang C, Russell J, Cross AH. Dysmyleination revealed through MRI as increased radial (but unchanged axial) diffusion of water. NeuroImage. 2002; 17 (3):1429-1436. DOI: 10.1006/nimg.2002.1267 - 32.
van der Knaap MS, Valk J, de Neeling N, Nauta JJ. Pattern recognition in magnetic resonance imaging of white matter disorders in children and young adults. Neuroradiology. 1991; 33 (6):478-493. DOI: 10.1007/BF00588038 - 33.
Vasconcellos E, Smith M. MRI nerve root enhancement in Krabbe disease. Pediatric Neurology. 1998; 19 (2):151-152. DOI: 10.1016/s0887-8994(98)00033-2 - 34.
van de Knap MS, van der Voorn P, Barkhof F, van Coster R, Krageloh-Mann I, Feigenbaum A, et al. A new leukoencephalopathy with brainstem and spinal cord involvement with high lactate. Annals of Neurology. 2003; 53 (2):252-258. DOI: 10.1002/ana.10456 - 35.
Osaka H, Kimura S, Nezu A, Yamazaki S, Saitoh K, Yamaguchi S. Chronic subdural hematoma, an initial manifestation of glutaric aciduria type-1. Brain & Development. 1993; 15 (2):125-127. DOI: 10.1016/0387-7604(93)90049-e - 36.
Clayton PT, Thompson E. Dysmorphic syndromes with demonstrable biochemical abnormalities. Journal of Medical Genetics. 1988; 25 (7):463-472. DOI: 10.1136/jmg.25.7.463 - 37.
Russel IM, van Sonderen L, van Straaten HLM, Barth PG. Subependymal germinolytic cysts in Zellweger syndrome. Pediatric Radiology. 1995; 25 (4):254-255. DOI: 10.1007/BF02011090 - 38.
Kerrigan JF, Aleck KA, Tarby TJ, Bird CR, Heidenreich RA. Fumaric aciduia: Clinical and imaging features. Annals of Neurology. 2000; 47 (5):583-588 - 39.
Fletcher JM, Bye AME, Nayanar V, Wilcken B. Nonketotic hyperglycinemia presenting as pachygyria. Journal of Inherited Metabolic Disease. 1995; 18 (6):665-668. DOI: 10.1007/BF02436754 - 40.
Frei KP, Patronas NJ, Crutchfield KE, Altarescu G, Schiffmann R. Mucolipidosis type IV: Characteristic MRI findings. Neurology. 1998; 51 (2):565-569. DOI: 10.1212/wnl.51.2.565 - 41.
Sonninen P, Autti T, Varho T, Hamalainen M, Raininko R. Brain involvement in Salla disease. American Journal of Neuroradiology. 1999; 20 (3):433-443 - 42.
Kyllerman M, Blomstrand S, Mansson JE, Conradi NG, Hindmarsh T. Central nervous system malformations and white matter changes in pseudo-neonatal adrenoleukodystrophy. Neuropediatrics. 1990; 21 (4):199-201. DOI: 10.1055/s-2008-1071495 - 43.
Forstner R, Hoffmann GF, Gassner I, Heideman P, De Klerk JB, Lawrenz-Wolf B, et al. Glutaric aciduria type I: Ultrasonographic demonstration of early signs. Pediatric Radiology. 1999; 29 :138-143 - 44.
Nowaczyk MJ, Blaser SI, Clarke JT. Central nervous system malformations in ethylmalonic encephalopathy. American Journal of Medical Genetics. 1998; 75 (3):292-296 - 45.
Escolar ML, Poe MD, Smith JK, Gilmore JH, Kurtzberg J, Lin W, et al. Diffusion tensor imaging detects abnormalities in the corticospinal tracts of neonates with infantile Krabbe disease. American Journal of Neuroradiology. 2009; 30 (5):1017-1021. DOI: 10.3174/ajnr.A1476 - 46.
Enokizono M, Aida N, Yagishita A, Nakata Y, Ideguchi R, Kurokawa R, et al. Neuroimaging findings of inborn errors of metabolism: Urea cycle disorders, aminoacidopathies, and organic acidopathies. Japanese Journal of Radiology. 2023. DOI: 10.1007/s11604-023-01396-0 - 47.
van der Knap MS, van der Grond J, van Rijen PC, Faber JA, Valk J, Willemse K. Age-dependent changes in localized proton and phosphorous MR spectroscopy of the brain. Radiology. 1990; 176 (2):509-515. DOI: 10.1148/radiology.176.2.2164237 - 48.
Wadhwa Y, Rohilla S, Kaushik JS. Cystic leukoencephalopathy in NDUFV1 mutation. Indian Journal of Pediatrics. 2018; 85 (12):1128-1131. DOI: 10.1007/s12098-018-2721-1 - 49.
Bergman AJ, van der Knap MS, Smeitink JA, Duran M, Dorland L, Valk J, et al. Magnetic resonance imaging and spectroscopy of the brain in propionic acidemia: Clinical and biochemical considerations. Pediatric Research. 1996; 40 (3):404-409. DOI: 10.1203/00006450-199609000-00007 - 50.
Biswas A, Malhotra M, Mankad K, Carney O, D’Arco F, Muthusamy K, et al. Clinico-radiological phenotyping and diagnostic pathways in childhood neurometabolic disorders—a practical introductory guide. Translational Pediatrics. 2021; 10 (4):1201-1230. DOI: 10.21037/tp-20-335 - 51.
Reddy N, Calloni SF, Vernon HJ, Boltshauser E, Huisman TAGM, Soares BP. Neuroimaging findings of organic Acidemias and Aminoacidopathies. Radiographics. 2018; 38 (3):912-931. DOI: 10.1148/rg.2018170042 - 52.
Gibson KM, Breuer J, Kaiser K, Nyhan WL, McCoy EE, Ferreira P, et al. 3-hydroxy-3-methylglutaryl-coenzyme A lyase deficiency: Report of five new patients. Journal of Inherited Metabolic Disease. 1988; 11 :76-87 - 53.
Hoffmann GF, Meier-Augenstein W, Stockler S, Surtees R, Rating D, Nyhan WL. Physiology and pathophysiology of organic acids in cerebrospinal fluid. Journal of Inherited Metabolic Disease. 1993; 16 (4):648-669. DOI: 10.1007/BF00711898 - 54.
Clayton PT. Applications of mass spectrometry in the study of inborn errors of metabolism. Journal of Inherited Metabolic Disease. 2001; 24 (2):139-150. DOI: 10.1023/a:1010358715835 - 55.
JJM J, Broeks MH, Verhoeven- Duif NM. Metabolomics in diagnostics of inborn metabolic disorders. Current Opinion in Systems Biology. 2022; 29 :100409. DOI: 10.1016/j.coisb.2021.100409 - 56.
Costanzo M, Zacchia M, Bruno G, Crisci D, Caterino M, Ruoppolo M. Integration of proteomics and metabolomics in exploring genetic and rare metabolic diseases. Kidney Diseases. 2017; 3 (2):66-77. DOI: 10.1159/000477493 - 57.
Hernandez MA, Schulz R, Chaplin T, Young BD, Perrett D, Champion MP, et al. The diagnosis of inherited metabolic diseases by microarray gene expression profiling. Orphanet Journal of Rare Diseases. 2010; 5 :34. DOI: 10.1186/1750-1172-5-34 - 58.
Wang J, Zhan H, Li FY, Pursley AN, Schmitt ES, Wong LJ. Targeted array CGH as a valuable molecular diagnostic approach: Experience in the diagnosis of mitochondrial and metabolic disorders. Molecular Genetics and Metabolism. 2012; 106 (2):221-230. DOI: 10.1016/j.ymgme.2012.03.005 - 59.
Pinheiro MI, Silva C, Lourenço L, Gonçalves D, Dória S, Guardiano M, et al. Array-CGH: Importance in the study of developmental delays in pediatrics. Revue Neurologique. 2020; 71 (5):171-176. DOI: 10.33588/rn.7105.2020211 - 60.
Gilissen C, Hoischen A, Brunner HG, Veltman JA. Disease gene identification strategies for exome sequencing. European Journal of Human Genetics. 2012; 20 (5):490-497. DOI: 10.1038/ejhg.2011.258 - 61.
Soriano-Sexto A, Gallego D, Leal F, Castejón-Fernández N, Navarrete R, Alcaide P, et al. Identification of clinical variants beyond the exome in inborn errors of metabolism. International Journal of Molecular Sciences. 2022; 23 (21):12850. DOI: 10.3390/ijms232112850 - 62.
Reid ES, Papandreou A, Drury S, Boustred C, Yue WW, Wedatilake Y, et al. Advantages and pitfalls of an extended gene panel for investigating complex neurometabolic phenotypes. Brain. 2016; 139 (11):2844-2854. DOI: 10.1093/brain/aww221 - 63.
Yubero D, Brandi N, Ormazabal A, Garcia-Cazorla À, Pérez-Dueñas B, Campistol J, et al. Targeted next generation sequencing in patients with inborn errors of metabolism. PLoS One. 2016; 11 (5):e0156359doi.org/10.1371/journal.pone.0156359 - 64.
Barbosa-Gouveia S, Vázquez- Mosquera ME, González-Vioque E, Álvarez JV, Chans R, Laranjeira F, et al. Utility of gene panels for the diagnosis of inborn errors of metabolism in a metabolic reference Center. Genes (Basel). 2021; 12 (8):1262. DOI: 10.3390/genes12081262 - 65.
Sharma V, Luker GD, Piwnica- Worms D. Molecular imaging of gene expression and protein function in vivo with PET and SPECT. Journal of Magnetic Resonance Imaging. 2002; 16 (4):336-351. DOI: 10.1002/jmri.10182 - 66.
Gropman AL, Anderson A. Novel imaging technologies for genetic diagnoses in the inborn errors of metabolism. Journal of Translational Genetics and Genomics. 2020; 4 :429-445. DOI: 10.20517/jtgg.2020.09 - 67.
Rahman J, Rahman S. The utility of phenomics in diagnosis of inherited metabolic disorders. Clinical Medicine (London, England). 2019; 19 (1):30-36. DOI: 10.7861/clinmedicine.19-1-30 - 68.
Biswas A, Malhotra M, Mankad K, Carney O, D’rco F, Muthusamy K, et al. Clinico-radiological phenotyping and diagnostic pathways in childhood neurometabolic disorders—A practical introductory guide. Transl Pediatr. 2021; 10 (4):1201-1230. DOI: 10.21037/tp-20-335 - 69.
Guéant JL, Feillet F. Inherited metabolic disorders beyond the new generation sequencing era: The need for in-depth cellular and molecular phenotyping. Human Genetics. 2022; 141 (7):1235-1237. DOI: 10.1007/s00439-022-02467-4 - 70.
Rashed MS, Bucknall MP, Little D, Awad A, Jacob M, Al-Amoudi M, et al. Screening blood spots for inborn errors of metabolism by electrospray tandem mass spectroscopy with a microplate batch process and a computer algorithm for automated flagging of abnormal profiles. Clinical Chemistry. 1997; 43 (7):1129-1141 - 71.
Peters C, Steward CG. National Marrow Donor Program, international bone marrow transplant registry, working party on inborn errors, European bone marrow transplant group. Hematopoietic cell transplantation for inherited metabolic diseases: An overview of outcomes and practice guidelines. Bone Marrow Transplantation. 2003; 31 (4):229-239. DOI: 10.1038/sj.bmt.1703839 - 72.
Escolar ML, Poe MD, Provenzale JM, Richards KC, Allison J, Wood S, et al. Transplantation of umbilical-cord blood in babies with infantile Krabbe’s disease. The New England Journal of Medicine. 2005; 352 (20):2069-2081. DOI: 10.1056/NEJMoa042604 - 73.
Fernández-Eulate G, Carreau C, Benoist JF, Lamari F, Rucheton B, Shor N, et al. Diagnostic approach in adult-onset neurometabolic diseases. Journal of Neurology, Neurosurgery, and Psychiatry. 2022; 93 (4):413-421. DOI: 10.1136/jnnp-2021-328045 - 74.
Willemsen MA, Harting I, Wevers RA. Neurometabolic disorders: Five new things. Neurology: Clinical Practice. 2016; 6 (4):348-357. DOI: 10.1212/CPJ.0000000000000266 - 75.
Yilmaz BS, Gurung S, Perocheau D, Counsell J, Baruteau J. Gene therapy for inherited metabolic diseases. Journal of Mother and Child. 2020; 24 (2):53-64. DOI: 10.34763/jmotherandchild.20202402si.2004.000009 - 76.
Ahrens-Nicklas RC. Heal thyself: The promise of autologous hematopoietic stem cell gene therapy in neurometabolic disorders. Molecular Therapy. 2022; 30 (4):1353-1354. DOI: 10.1016/j.ymthe.2022.03.006 - 77.
Ozand PT, Gascon CG. Treatment of inherited neurometabolic diseases: The future. Journal of Child Neurology. 1992; 7 (Suppl):S132-S140. DOI: 10.1177/08830738920070011711 - 78.
Ginocchio VM, Brunetti-Pierri N. Progress toward improved therapies for inborn errors of metabolism. Human Molecular Genetics. 2016; 25 (R1):R27-R35. DOI: 10.1093/hmg/ddv418