Open Access is an initiative that aims to make scientific research freely available to all. To date our community has made over 100 million downloads. It’s based on principles of collaboration, unobstructed discovery, and, most importantly, scientific progression. As PhD students, we found it difficult to access the research we needed, so we decided to create a new Open Access publisher that levels the playing field for scientists across the world. How? By making research easy to access, and puts the academic needs of the researchers before the business interests of publishers.
We are a community of more than 103,000 authors and editors from 3,291 institutions spanning 160 countries, including Nobel Prize winners and some of the world’s most-cited researchers. Publishing on IntechOpen allows authors to earn citations and find new collaborators, meaning more people see your work not only from your own field of study, but from other related fields too.
To purchase hard copies of this book, please contact the representative in India:
CBS Publishers & Distributors Pvt. Ltd.
www.cbspd.com
|
customercare@cbspd.com
These research focus on the application of marine geodesy in evaluating the potential risks that affect the positioning of any marine vessel while waiting on safe anchorage for further instruction in Mobil Oil Mining Lease (OML) 112, about 44-km offshore of Akwa Ibom state, Nigeria. Multibeam echo sounders, side-scan sonar and the shallow seismic recording system were used to investigate the seabed topography and shallow geology of EDOP PP vicinity. The results show that the area is stratigraphically subdivided into the upper soft silty clay unit, which grades into Clay and continues into Medium Sand to the penetration depth. The Side Scan Sonar imagery was studied carefully and interpreted accordingly. From the imagery, the area constitutes superficially soft Silty Clay sediment on the surface with some occasionally isolated strong sonar reflections. In the vicinity of the 500 m radius centered on EDOP PP, pipelines were observed to run out from the platform in the North-west, Eastern, and southern directions. Generally, these pipelines were observed to be exposed superficially along its length through to the coverage area.
Faculty of Environmental Sciences, Department of Surveying and Geomatics, Rivers State University, Port Harcourt, Nigeria
Lawrence Hart
Faculty of Environmental Sciences, Department of Surveying and Geomatics, Rivers State University, Port Harcourt, Nigeria
Gbenga Ajayi
Faculty of Engineering and Built Environment, Department of Land and Spatial Sciences, Namibia University of Science and Technology, Namibia
*Address all correspondence to: basildevote@gmail.com
1. Introduction
The ocean and coastal water contain 28% percent of the global natural gas production and 37% percent of global oil production: the gold of the sea [1]. Many gas and oil fields have been discovered and exploited during the last century and the role of methane hydrate, which can be found on the floor of almost all oceans, for industrial use has not even been exploited. The increasing demand for all kinds of sea food has also created a large and still growing fishing industry which will satisfy their clams in national and international waters [2]. More so, the current transition to cleaner and greener energy have yet presented another potential for the sea: Wind energy. The fastest way to create substantial amount of this green energy is to build offshore wind farms. The seas have space enough, the wind yield is higher than on shore and the visible impact, which is so a difficult hurdle to overcome on shore, is not an issue in the sea [3].
These coastal water and ocean surfaces have been the driving force of the climatic change of the planet earth. It is also the place where life started to develop and still the largest biosphere on earth [4, 5]. Ocean and coastal waters are not only important from the ecological point of views, but also from the economic aspect. It controls the world commerce as 90% percent of international exchange of data, information, goods, and service around the world are transported through either fiber optical cables buried in the sea bottom or large going ships that are getting bigger and bigger every day [6, 7].
Despite the tremendous potentials and natural resources of the Ocean surfaces and coastal waters which makes up 70% of the earth surface, unfortunately, the ocean surface and coastal water have not been adequately mapped. According to National Aeronautics and Space Administration (NASA), there are complete maps of the surface of the moon or mars than the ocean floor of the earth [8]. The mapping of the earth surfaces is the one of the major applications of geodesy [9]. Hence, it suffices to say that marine geodesy is the application of geodetic techniques in mapping of ocean and coastal environment, sea surface topography and marine geoid. Marine geodesy involves scientific investigations related to geology, geophysics, and glaciology [10].
Mapping topography of the ocean bottom has been very elusive for scientist and marine geodesist to achieve. The inhospitable underwater pressure and sheer expanse of the marine environment (70% of the earth surface) being the principal cause [11]. However, acoustic remote sensing techniques (sonar and seismic reflection profiling) have evolved within the last century allowing researchers the ability to effectively interpret and map large portion of benthonic environments [12].
Seafloor mapping is the first step in making a census of the geohazard-bearing features present within the seafloor [11]. It often provides the only tool for a comprehensive, although non-specific, seafloor geohazard assessment over large areas that are scarcely ground-truthed by acoustic prospection and seafloor sampling. Many hydrographic survey and visualization surveys of seafloors are primarily conducted acoustically using the single-beam echosounder, multibeam echosounder and Side Scan Sonar (Sound navigation and ranging) (SSS), which utilizes acoustic signals to determine the seabed topography.
Single-beam and Multibeam Echosounder S/MBES are acoustic sensors used in the mapping of underwater topography. These acoustic sensors transmit sound wave directly downward from the transducer that travels through the water column, and is reflected back to the transducers. The two-way time of travel of the acoustic signal is used to determine underwater depth [13]. Single-beam echo sounder reflects single point beneath the sonar, while multibeam echo sounder illuminates a swath elongated along across the bottom and perpendicular to the direction of the sailing [14]. To accurately determine and measure the direction which the acoustic signal was received at the transducer head, the position, heading, motion of the vessel, and variation in the speed of sound through the water column must be accurately measured, and time stamped in real time [15]. The operational principle of SSS is based on time series recording of the travel time and amplitude of acoustic signals from the SSS through the water column. These signals are being reflected in the direction of the SSS from the seabed and other benthic obstruction, the back-scatter effect [16, 17]. The strength of the return echo reflection is continuously recorded, creating a picture of the ocean bottom. SSS relies on the physics that the strength of the return signal is directly proportional to the reflectivity of the seabed material called spectral signature. In basic terms, strong reflectors create strong echoes, while weak reflectors create weaker echoes. Knowing these characteristics, researchers, and marine geodesist such as [17, 18, 19] have been able to use the strength of acoustic returns from side scan sonar to examine the composition of the sea floor.
However, the characterization of geohazard features on a morphological basis alone is limited, and more detailed investigations are needed to define the character and state of activity of potentially hazardous features. Such investigations include the use of deep-tow or autonomous platforms designed to acquire high-resolution data at depth as well as in situ measurements, both being very expensive activities not applicable over large areas. Thus, seafloor mapping is often not only the first and the main but also the only tool for a comprehensive seafloor geohazard assessment [20].
Several regions of the world’s oceans and coastal areas lack detailed seafloor mapping data, leading to significant gaps in our understanding of the underwater terrain. This lack of coverage hampers hazard assessment efforts, making it difficult to predict and mitigate potential threats. Oil Mining Lease (OML) 112 is an offshore oil drilling facility, which is operated by the Mobil oil producing company Ltd. Due to the ongoing exploration and exploitation activities, several ships and tankers usually navigate and anchor within the vicinity of the production facility. The need for regular seafloor mapping of the production site is critical not just for navigational purpose, but also to ensure safe anchoring without damaging oil delivering pipelines buried under the seabed. This study focuses on the application of seafloor mapping in evaluating potential risks that affect positioning and safe anchorage of marine vessel in Mobil Oil Mining Lease (OML) 70, about 44-km offshore of Akwa Ibom state, Nigeria. Its fundamental objective is the identification of potential hazard on, and shallow geology of the benthonic area. It involves the complete sonification of OML 112 offshore Mobil oil platform areas using acoustic sensors.
Sonar and Seismic profiling surveys have been used to map the benthic regions since the nineteenth century with marine reflection surveys coming to prominence in the 1950s when they were used in acoustic bathymetry, seabed identification using multibeam and side scan sonar instrument [21]. Side scan sonar investigations and marine seismic identification of seabed object were conducted in Punggur waters, Indonesia. C-Max (CM2) instrument was deployed connected with a 50-meter cable the 7–16-m altitudes above the seabed. The results obtained from side scan sonar recording are with high-resolution seabed imagery. The side scan sonar imagery investigation shows 4 objects detected at 187.8, 137.1, 70.9, and 23.7 m. The increased knowledge about pockmark features have resulted from this survey, it was mainly achieved by the side scan sonar which was towed at an optimum altitude (10–26 m) above the bottom, regardless of the (actual) water depth [22].
1.1 Study area
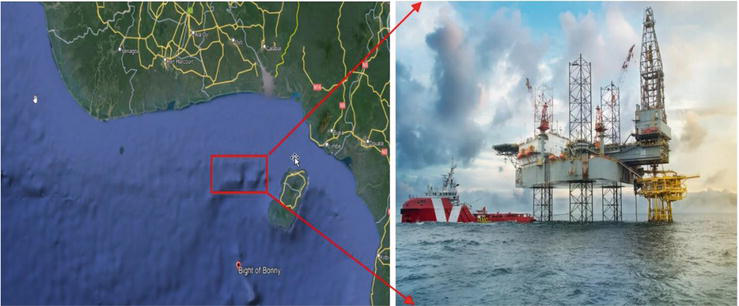
The study area is in OML 112 (AFREN Field) which is in Ikot Abasi Local Government Area of Akwa Ibom State. It is in the South – Western part of the state on Nigerian territorial waters in the Gulf of Guinea, Nigeria. OML 112 is a located within latitude 3° 50́ 3.74” N and 3° 38 42.82” N, and latitude 7° 47 02.85″ E and 8° 02 36.99″ E, belonging to the Exxon Mobil oil company, Nigeria (Figure 1).
The study relies on primary data acquires from the complete sonification of the benthonic area. It entails the deployment of the following equipment given in Table 1.
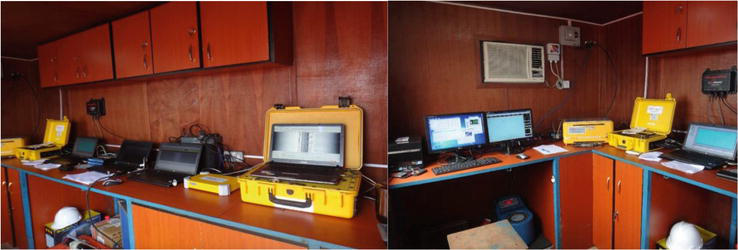
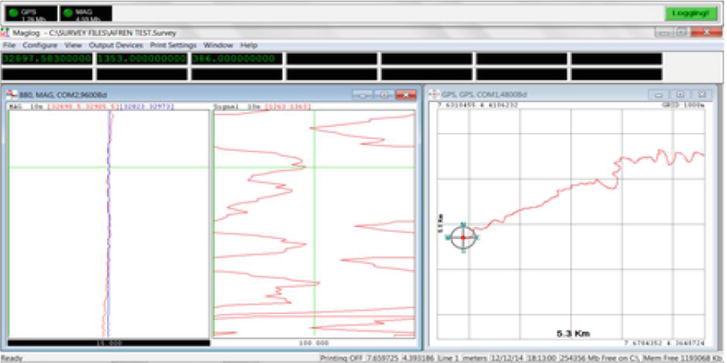
The data acquisition involves the setup, calibration of various sensor onboard the survey vessel (MV C- RACER) as show in Figure 2, and complete sonification of the study area. The setup involves measurement of sensors offset with respect to the vessel reference systems (VFR). The vessel Central Reference Point (CRP) was taken as the origin of measurements for determining the horizontal positions of installed sensors, while the deck was taken as the reference for the vertical position of all installed sensors on the survey vessel. The offset positions as determined are listed in Table 2.
Figure 2.
The set-up configuration of the various sensors.
SN
Equipment
DX (meters)
DY (meters)
DZ (meters)
1
CRP
0
0
0
2
DGPS Antenna (Secondary)
1.286
−16.141
6.94
3
Motion Reference Unit
0.657
−13.229
3.23
4
DGPS Antenna (Primary)
1.119
−10.664
6.94
5
Magnetometer (Tow Point)
−6.71
−36.214
—
6
Sub bottom Profiler (Tow Point)
0.42
−36.174
—
7
Side Scan Sonar (Tow Point)
6.716
−36.139
—
8
SBES Transducer
8.965
−20.733
−3.78
9
MBES Transducer
8.965
−20.033
−3.78
Table 2.
Offset measurement of the survey vessel.
2.2 Sensors calibration
The calibration involves rub test, patch test, and chirp test for the side scan sonar, multi-beam echo sounder, and sub bottom profiler respectively.
2.2.1 Rub test
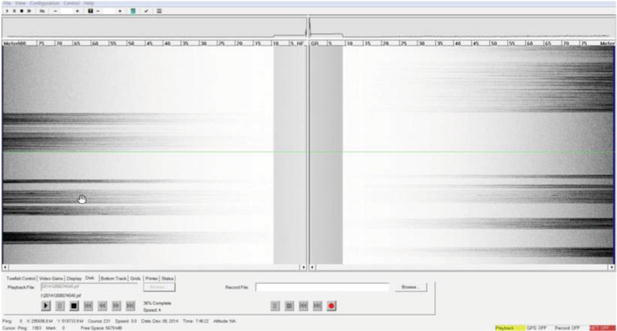
The result of rub test (rubbing the sonar sensors of the side scan sonar by hand) on the two channels to ascertain its functionality is as shown in Figure 3. This confirms the sensitivity of sonar sensors. The Edgetech dual frequency SSS has a two (2) channel side scan display, image correction capability, selectable color palettes, a tow cable of 1500 m, towing speed of 3–5 knots, frequency of 100 kHz – 105 ± 10 kHz; 500* kHz – 390 ± 20 kHz, and a scan range of 25 to 600 m (100 kHz – 500 m swath, 500* kHz – 200 m swath). The CMAX dual frequency SSS has a range from 100 m to 500 m at 100 kHz, 25 m – 150 m at 325 kHz and 12.5 m – 37.5 m at 780 kHz. It has an operating depth from 0 to 2000 m, operating speed of 1–8 knots and a maximum towing speed of 12 knots, a water temperature sensor, and a tow cable of about 1000 m [16].
Figure 3.
Side scan sonar rub test.
2.2.2 Patch test
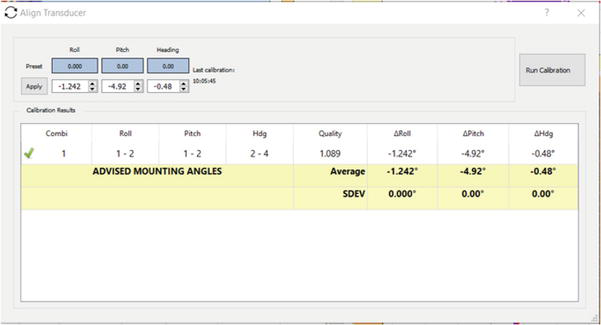
The Multi-Beam Patch test involves the determination of the mounting angle (Roll, Pitch, and Heading) of the multi-beam sonar head, with the motion sensor and gyroscope, and the sychronisation of time (latency) between the sensors [15]. It is critical for the conversion of the slang range of the swath sonar to it equivalent depth, and correction of the dynamic motion of ocean surfaces. The determination of the calibration value was done using the classical method, which requires a pre-knowledge of the terrain characteristic of the seabed. Roll biases estimation requires surveying a flat seabed on opposite direction, for the pitch biases, a sloping seabed is required while the yaw (heading or azimuth) biases requires surveying a flat seabed terrain from two parallel and overlapping survey tracks heading in the same direction [23]. The result of the patch test is as given in Figure 4.
Figure 4.
The result of the multi beam patch test.
2.2.3 Magnetometer field test
The test of the magnetometer involves the introduction of a magnetic fluctuation within the magnetic field of the magnetometer. The tow fish was placed on the vessel deck away from any magnetic material while the system was started. Fluctuations in the magnetic field around the tow fish were noticed as soon as the magnetic material got close to the tow fish, increasing in signal strength as the material gets closer to the tow fish, and disappearing as soon as the material was further away as shown in Figure 5.
Figure 5.
Magnetometer field test.
The Geometrics 882 magnetometer has an operating range from 20,000 to 100,000 nT, absolute accuracy of <2 nT throughout range, operates within temperature of −30°F to +122°F (−35°C to +50°C), maximum operating depth of 9000 m and a tow cable of 500 m.
2.2.4 Sub bottom profiler chirp test
The sub bottom Profiler (SBP) was tested to confirm that it was in good working condition by carrying out the ‘chirp test’. This was done by setting up the system with the sub-bottom towfish placed on the deck of the vessel. The system is turned on and acquisition started, while the towfish is monitored. The towfish is expected to emit a ‘chirp’ sound to confirm that it is in good working condition. The Edgetech sub bottom profiler has a vertical resolution of 4–8 cm, frequency range between 4 and 24 kHz, a typical penetration depth of 2 m in coarse calcareous sand and 40 m in clay, and a maximum operating depth of 300 m.
Data acquisition was done simultaneously on all sensors and the output from each sensor was logged digitally from the various systems/software. A log of all events, time and quality of data acquired was also kept.
The Kongsberg-GeoAcoustics GeoSwath+ MBES and ELAC Hydrostar 4300 dual frequency (30 kHz/200 kHz) SBES were used to acquire bathymetry data during the survey. The transducers were installed rigidly to their brackets and side mounted on the survey vessel. The transducer shoe is sufficiently deep and well positioned not to experience turbulence and aeration from the vessel during data acquisition.
Hydroacoustic method of depth determination is based on the propagation of sound wave through the water column. However, the speed of sound wave is refracted due to temperature, pressure and conductivity [6, 15]. Hence, the speed of sound wave needs to be accounted for accurate representation of the seabed. For this study, the sound velocity profiles taken with a measured using Mini-SVP, which was imputed in both the multibeam and single-beam data acquisition and processing software.
Quality control of the acquired data was done by comparing the difference between the single-beam and the multibeam bathymetric data, which was observed to be within ±20 cm.
3.2 Side scan sonar
The EdgeTech 4200 Dual frequency (100/500 kHz) and C-MAX Dual Frequency (325/780 kHz) digital Side Scan Sonar Systems were deployed and tuned between 75 m and 100 m slant range to scan the seabed for debris and seabed features. However, based on the field situation (depth variation) the range was tuned for better data quality ensuring a theoretical 75% /100% overlap on 100 m line spacing. Cable out was noted at the start of each line and whenever there was alterations. The output from the SSS essentially provided detailed representation of the sea bottom features and characteristics of the seabed.
3.3 Sub-bottom profiler
An EdgeTech X-Star Sub-bottom profiler, a high-resolution and greater penetration subsurface profiler with SB-216S tow-fish (2–16 kHz) was deployed to investigate the seabed and the depth to reflecting discontinuities in the near sub-surface. This was used for the shallow seismic data acquisition during the survey.
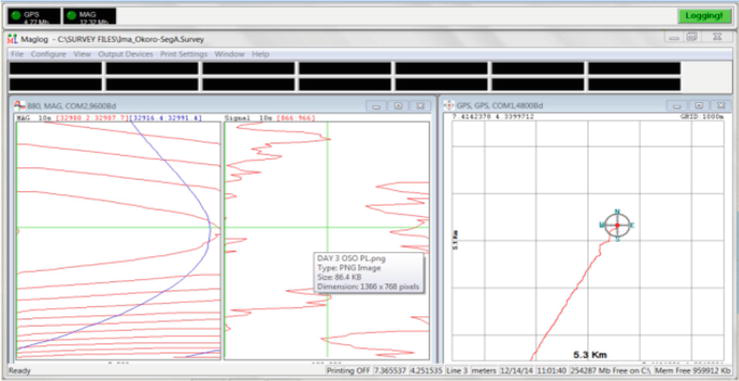
3.4 Magnetometer
The Geometrics G882 marine magnetometer was used for data acquisition. The data was displayed as profiles on the acquisition system. The magnetometer was towed at 150 m astern of the survey vessel and operated on the 32,000–33,200 Nano Tesla (nT) range, which is the typical range of magnetic field of this Latitude/Longitude Positions. The Geometrics MagLog software was used to log the magnetometer data. The software was interfaced to the DGPS directly. Different sub-windows setups during acquisition were navigation, signal strength, magnetic field data and depth showing data in numeric and graphical format. The simultaneous display of this information were used to perform the online QC Checks of the data quality.
The presence of pipelines and other metallic objects within the pipeline survey area were detected with the magnetometer. These were observed as deviation from the background value. Their degrees of exposure were seen as a result of their strong signal strength.
3.5 Data processing
The data acquired from individual sensors were processed using quality integrated navigation software (Qinsy) to produce the digital bottom model and the subsea geomorphological images, which requires geophysical interpretation. Digitally recorded depth data (SBES & MBES) were referenced to Lowest Astronomical Tide (LAT) in meters by correcting for tidal levels using tidal prediction tables for OPOBO River Entrance (a standard port). The height of water, referenced to LAT, was subtracted from the depth measurement to refer it to datum.
The side scan sonar imageries logged digitally were processed to produce a mosaic that was plotted in plain view. This plot was used to characterize the sea bottom. Bottom characterization was accomplished by interpreting the side-scan sonar records in conjunction with sounding data, sub-bottom data, and visual observations. The high-resolution sonar sub-bottom data was processed and analyzed to show the detailed sub-bottom profile of the surveyed area. The MagPick Software package was used to process the magnetometer data. Internal functions available in MagPick were used to perform the Projection Transformation. All the magnetic anomalies of the survey area were picked manually as the Manual Target Picking option offers more flexibilities of the surveyed area.
The data processed from various sensors was analyzed to give an overview of the seabed characteristics along the surveyed corridor.
4.1 Bathymetric result
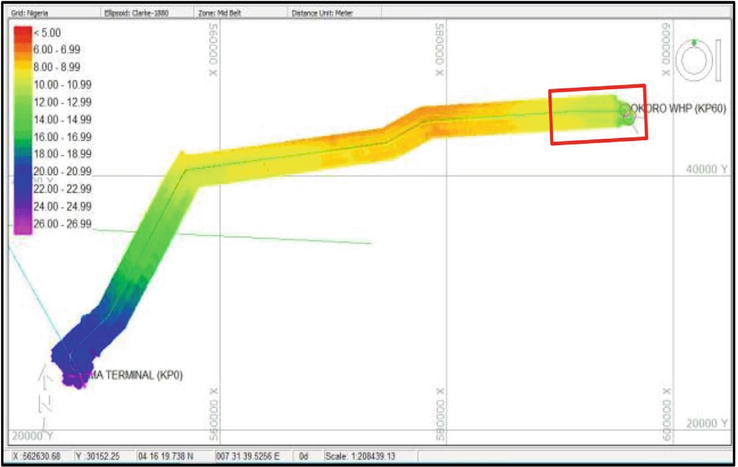
The bathymetry study of the seabed was done using data from the SBES and MBES and presented in Table 3 and Figure 6. The result of the bathymetric survey show that the study area has an average depth of 10 m with a maximum depth of 12 m and a minimum depth of 8 m.
KP (Km)
Eastings (m)
Northings (m)
Water Depth (m)
60
595725.91
44984.48
11.7
57.5
594012.764
45089.891
11.2
55
591512.767
45085.942
10
52.5
589016.15
44977.328
9.4
50
586520.928
44822.843
8.9
47.5
584025.705
44668.358
8.2
Table 3.
Water depth within the study area.
Figure 6.
MBES bathymetry DTM of KP0 to KP60 with pipeline route and structures underlay (KP50 to KP60 in red rectangle).
4.2 Side scan sonar interpretation
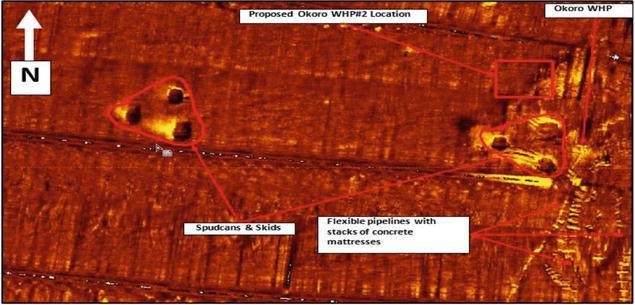
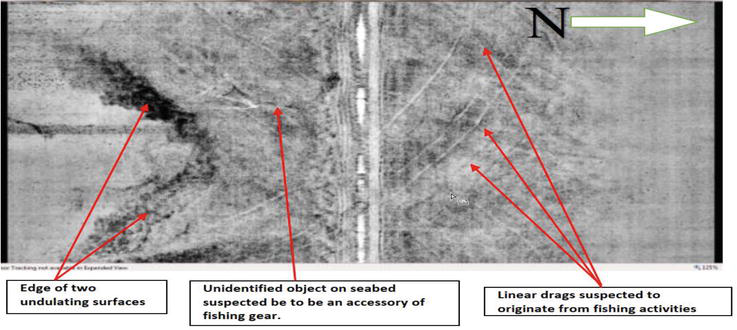
The analysis of the Side Scan Sonar imagery presented is presented in Table 4 below. As can be seen in Figures 7 and 8, the surveyed corridor exhibits a smooth texture, with a rough surface furrowed at some points. There were physical scars which were suspected to be anchor drags, as well as some linear features suspected to be a result of fishing activities in the area. Various sonar contacts were picked as well as seabed sediments.
Side Scan Sonar Features (KP60 – KP50)
Features ID
East (m)
North (m)
Length (m)
Width (m)
Height (m)
Description
SSS 01
592329.962
45526.36
4.8
2.7
—
Debris
SSS 02
586157.582
45227.859
3.2
1.1
—
Debris
SSS 03
585572.604
45279.128
31.6
10.6
—
Seabed disturbance with Debris
SSS 04
589012.508
45482.766
45.3
9.8
—
Strong sonar reflection
SSS 05
585411.79
45013.966
Continuous
53
—
Edge of thick mud patch with erosional surface
SSS 06
592991.73
45320.295
9.8
7.3
—
Debris
SSS 07
585386.8
44822.551
7.9
4.1
—
Debris
SSS 08
589115.94
44589.034
8.4
1.2
0.5
Debris
SSS 09
584311.91
44748.303
Continuous
37
—
Set of linear scars
SSS 10
592922.73
44524.206
5
0.2
—
Stretch of linear object
SSS 11
592591.08
44501.67
34.8
14.3
—
Object on seabed
SSS 12
584189.26
44013.989
16.3
2.4
—
Object on seabed
SSS 13
585685.7
44102.544
8.1
4.5
0.2
Object on seabed
SSS 14
588448.79
45701.67
19.5
6.3
—
Group of Debris
SSS 15
585457.96
45486.53
150
10.7
—
Stretch of littered isolated debris
SSS 16
594598.91
45410.745
10.3
0.5
—
Linear object on seabed
SSS 17
595636.23
45294.642
5.7
2.1
—
Object on seabed
SSS 18
595401.09
45226.313
20.2
19.8
—
Spud can
SSS 19
595443.05
45202.691
19.2
18.7
—
Spud can
SSS 20
595434.95
45249.314
20.5
19.3
—
Spud can
SSS 21
595704.76
45192.873
20.5
19.3
—
Spud can
SSS 22
595742.83
45168.701
19.2
19.7
—
Spud can
SSS 23
595744.35
45212.552
21.5
1.7
—
Spud can
SSS 24
595770.96
45186.548
10.4
9.6
—
Platform
SSS 25
595702.49
44942.109
Continuous
—
—
Observed flexible pipes from the platform clamped down with concrete mattresses
SSS 26
595757.16
45051.505
Continuous
—
—
Observed flexible pipes from the platform clamped down with concrete mattresses
SSS 27
595800.5
45127.561
Continuous
—
—
Observed flexible pipes from the platform clamped down with concrete mattresses
Table 4.
Analysis of the side scan sonar feature (KP60 – KP 50).
Figure 7.
MBES bathymetry DTM of KP0 to KP60 with pipeline route and structures underlay (KP50 to KP60 in red rectangle).
Figure 8.
Edgetech mosaic showing activities on the seabed.
4.3 Sub-bottom profile interpretation
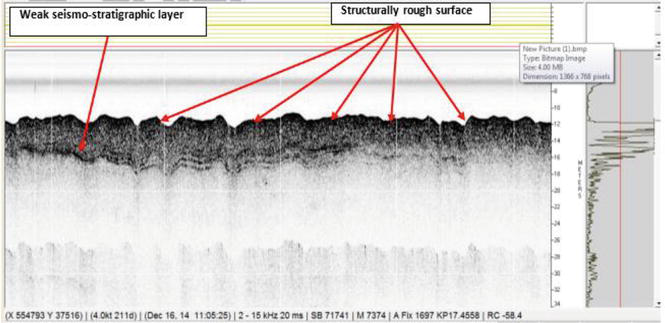
The shallow geology of the surveyed corridor was analyzed from the Sub-Bottom Profiler data as shown in Figure 9. The seismic profiles of the surveyed area suggest the presence of a weak seismo-stratigraphic layer just below the seabed. It varies in thickness from about 4 m at the OKORO Well Head Platform end. No contact was made within this section of the study.
Figure 9.
Sub-bottom profile showing surface structural imperfection within the surveyed corridor.
4.4 Magnetometer contact
Within the study area, only two (2) magnetic anomalies were observed along the surveyed corridor, and their details are as presented in Table 5 and Figure 10. This shows the presence of magnetic materials below the seabed, which was suspected to be ships anchors.
Magnetometer Contacts (KP60 – KP50)
Anomaly ID
East (m)
North (m)
Amplitude (nT)
Type of Anomaly
MAG 01
589256.534
45078.926
12
Negative
MAG 02
588876.059
45149.887
3
Negative
Table 5.
Magnetic contact list.
Figure 10.
Magnetic data distortion above Oso gas pipeline crossing.
This study shows the application of marine geodesy in evaluating potential risks that affect the positioning of any marine vessel in Akwa Ibom state, Nigeria using hydroacoustic sensors. Marine geodesy is a multidisciplinary field that provides essential data and tools for hazard investigation and mitigation in coastal and underwater environments. The increasing development of offshore and coastal facilities and growth of marine services involving mineral exploration and exploitation coupled with advances in instrumentation and methodology shows the potential of this emerging field. Marine geodesy has a very wide scope of work with a large variety of activities. It has become a nearly independent field of research with relations to many other areas of geodesy and influences from geology, geophysics, glaciology, and navigation. Marine Geodesy is not just interesting from the scientific point of view, but marine geodesy is also a lucrative business area for geodesist.
References
1.Devi R. Oceanography: The Surface of the Sea. Ansari Road, New Delhi: Random Publications; 2018
2.Bavestrello G, Silva N, editors. Oceanography and Benthic Ecology of Patagonian Fjords - 500 Years from the Discovery of the Strait Magellan. Lausanne: Frontiers Media SA; 2022. DOI: 10.3389/978-2-88976-889-9
3.Hill ED. From Seafloor Mapping to clean energy: hydrograph’s key role in sustainable world. Hydro International Journal. 2023;27:3, 8-11
4.Xu G, editor. Sciences of Geodesy. Vol. 1. Berlin Heidelberg, Dordrecht London, New York: Springer-Verlag; 2010 ISBN 978-3-642-11740-4
5.Santosh KG. Ecology and Environmental Studies. Nai Sarak, Delhi: Khanna Publishers; 2006. ISBN: 81-7409-218-8
6.IHO. Manual on Hydrography (M-13) - First Edition May 2005. International Hydrographic Bureau MONACO; Cedex Principauté de Monaco. 2005
7.Ojinnaka O. Principles of Hydrographic Surveying from Sextant to Satellite. Enugu, Nigeria: El’ Demark Publishers; 2007
8.NASA. Seafloor Features Are Revealed by the Gravity Field. 2016. Available from the NASA Visible Earth website: http://visibleearth.nasa.gov/
9.Torge, Muller. Geodesy. 4th ed. Berlin: Walter de Gruyter; 2012
10.Lu Z, Qu Y, Qiao S. Geodesy: Introduction to Geodetic Datum and Geodetic Systems. Berlin Heidelberg: Springer Publishing; 2014 ISBN:978-3-642-41244-8
11.Menandro PS, Bastos AC. Seabed mapping: A brief history from meaningful words. Geosciences. 2020;10(7):273
12.Paolo T, Simon MM, editors. Remote Sensing for Geomorphology. Developments in Earth Surface Processes. Vol. 23. AE Amsterdam, Netherlands: Elsevier; 2020
13.Abraham D. Modern Acoustics and Signal Processing. Switzerland: Springer Nature; 2019. ISBN: 978-3-319-92981-1
14.Ferreira IO, Andrade LCD, Teixeira VG, Santos FCM. State of art of bathymetric surveys. Bulletin of Geodetic Sciences. 2022;28(1):e2022002
15.Basil DD, Hart L, Tamuno JPK. Assessment of the effect of sensor misalignment of a multi beam hydrographic survey. World Journal of Geomatics and Geosciences. 2022;2:1
16.Blondel P. The Handbook of Sidescan Sonar. Spring Praxis Publishing Ltd.; Berlin, Heidelberg: Springer; 2009. ISBN: 978-3-642-43463-1
21.Manik HM, Rohman S, Hartoyo D. Underwater multiple objects detection and tracking using multibeam and side scan sonar. International Journal of Applied Information System. 2014;2(2):1-4
22.Lubis MZ, Anurogo W, Chayati SN, Sari LR, Taki HM, Pujiyati S. Sonar investigation and marine seismic investigation. Journal of Physics; Conference Sciences Series. 2020;1442. DOI: 10.1088/1742-6596/1442/1/012004
23.Godin A. Calibration of Shallow Water Multibeam Echo-Sounding Systems. M. Eng. Report, Department of Geodesy and Geomatics Engineering Technical Report No. 190, Fredericton, Canada: University of New Brunswick; 1998. 182 pp
Written By
Daniel Devote Basil, Lawrence Hart and Gbenga Ajayi
Submitted: 05 December 2022Reviewed: 06 December 2022Published: 03 October 2023
 Open access peer-reviewed chapter