Open Access is an initiative that aims to make scientific research freely available to all. To date our community has made over 100 million downloads. It’s based on principles of collaboration, unobstructed discovery, and, most importantly, scientific progression. As PhD students, we found it difficult to access the research we needed, so we decided to create a new Open Access publisher that levels the playing field for scientists across the world. How? By making research easy to access, and puts the academic needs of the researchers before the business interests of publishers.
We are a community of more than 103,000 authors and editors from 3,291 institutions spanning 160 countries, including Nobel Prize winners and some of the world’s most-cited researchers. Publishing on IntechOpen allows authors to earn citations and find new collaborators, meaning more people see your work not only from your own field of study, but from other related fields too.
To purchase hard copies of this book, please contact the representative in India:
CBS Publishers & Distributors Pvt. Ltd.
www.cbspd.com
|
customercare@cbspd.com
DNA Finger Printing of three goat breeds Red Sokoto (RS), West African Dwarf (WAD) and Sahel White (SW) in Nigeria was carried out. Standard procedures for blood sample collection, DNA extraction and analyses were employed. Analyses carried out included PCR amplification, band scoring, Population Differentiation investigations and percentage variability studies. Results obtained revealed 58.33%, 100% and 50% amplifications of the RS, WAD and SW breeds respectively; band scoring revealed polymorphism across the goat breeds; population differentiation showed four population structures and percentage variability studies gave 100% variability within the goat breeds and 0% among breeds. These results indicate high genetic variability of the three goat breeds and presents the ISSR primer as an appropriate tool for diversity studies of these breeds.
Faculty of Biological Sciences, Department of Animal and Environmental Biology, Cross River University of Technology, Calabar, Cross River State, Nigeria
*Address all correspondence to: hannahetta@unicross.edu.ng
1. Introduction
Goats (Capra aegagus hircus) like other livestock species, play a significant role in sustainable agriculture Goats constitute the largest group of small ruminant livestock in Nigeria totaling about 53.8 million. Goat in Nigeria constitutes 6.25% of the world’s goat population. Traditionally reared stock contributes about 99.97%, while 0.03% of the stock is commercially managed [1].
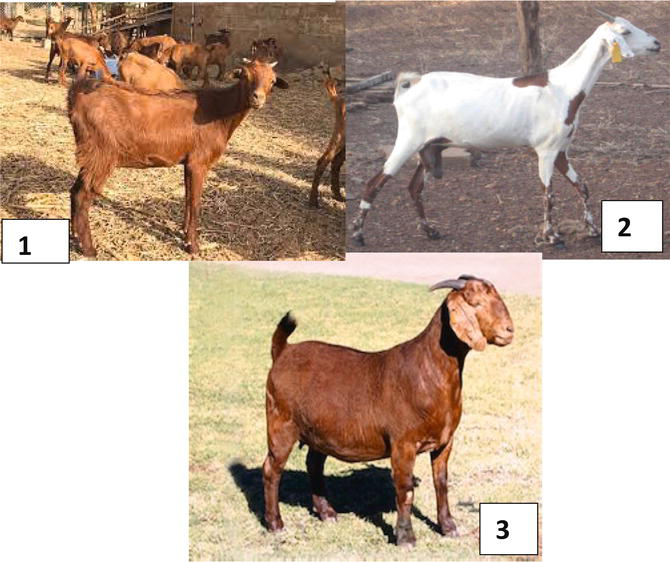
The Nigerian indigenous goat breeds possess adaptive features that enable them to thrive in their different environments (Figure 1) [2]. Some of these adaptive features include small body size and generation interval [3], ability to thrive in hard conditions and ability to survive on poor quality diets provided by scarce grazing on marginal lands [4]. The adaptability of these breeds in different zones give variation of germplasm [5].
Figure 1.
Goat breeds involved in the study. (L-R) west African dwarf goat; white Sahel and Sokoto red. Source: [2].
The adaptability and survival of a specie is affected to a great extent by genetic diversity [6]. As changes occur in the habitat of a population, there is need to adapt if the population must survive. How the population successfully copes with challenges in the ever changing environment depends on how easily the population was able to adapt to the changes [7].
DNA fingerprinting also known as genetic fingerprinting, DNA typing or DNA profiling is a molecular genetic method that enables identification of individuals using hair, blood, semen or other biological samples, based on unique patterns (polymorphism) in their DNA [8]. Several methods of DNA finger printing exist either using RFLP or PCR or both. These methods mostly target different areas of DNA especially those with known variation in single nucleotide polymorphism; (SNPs), short tandem repeats (STRs) and other variations that repeat polymorphic regions. Repeating sequences and their sizes, in our genetic make-up makes it easy to identify an individual correctly [8]. Inter-simple sequence Repeats (ISSR) are molecular markers which have been proven to be valuable tools in the characterization and evaluation of genetic diversity within and between spaces and populations [9].
Inter Simple Sequence Repeat (ISSR) technique is a PCR base technique, reported by [10] which involves amplification of DNA segments between two identical microsatellite repeat regions oriented in opposite direction using primers designed from microsatellite core regions. ISSR primers generate polymorphism whenever one genome misses the sequence repeat or has a deletion or insertion or translocation that modifies the distance between the repeats.
This investigation was designed to carry out DNA fingerprinting of the local goat breeds in Cross River State of Nigeria as there’s no such records yet. It is hoped that inferences from the investigation will provide baseline information for conservation and future breeding practices by goat breeders in Cross River State and Nigeria as a whole.
Three main varieties of goats are recognized in Nigeria - the Sahel, Desert or West African long-legged goat, the Sokoto Red and the West African Dwarf. These are the species we investigated.
The Sahelian goat is found along the northern border of Nigeria particularly in Borno, where it is often known as Balami, although this name has not been adopted as it would lead to confusion with the better known sheep race, Balami [11]. In Nigeria the Sahel goat is generally the variety preferred by pastoralists. Sahel goats are very similar in appearance to the sheep with which they are often herded. The coat is white or dappled, the ears are pendulous and the legs are notably longer than other breeds [12].
The sokoto red, Kano brown or Maradi goat is probably the most widespread and well known type in Nigeria [13]. It is the usual village goat in the North. The Sokoto red is the only Nigeria breed for which there is a record of systematic attempts to stabilize. The Sokoto red is still known for its suitability for fine leather. The skins have coarse thinly-spaced outer hairs and small sweat and wax glands and they lack fat.
Although the West African dwarf goat is found in many local types [14] there’s no record that they are actually different. The WAD are believed to be originally from the forest belt but they have been identified in Borno state, Cameroun and Chad showing a wider distribution of the breed. [15] described the breed as Grassland dwarf in Cameroun. Indeed, like Muturu cattle, they may once have been the main race of goat over most of Nigeria. Just as the Zebu has replaced the Muturu, so WAD goats have been driven to remote areas in the savannas. The West African goat is usually black, although patched and occasionally all white animals can be seen, even on the coast. Paradoxically, physiological experiments have shown that the WAD goat is not practically adapted to high ambient temperature [16].
Blood samples were collected into EDTA vacutainers and stored in ice until commencement of molecular analyses. The CTAB method was used for DNA extraction. The DNA was quantified, assessed and then diluted to 100 mg/μL DNA prior to polymerase chain reaction (PCR) set up. As it was detailed in [17], 25 μL volume of 2.0 μL of 50 mM mgcl2 (Biolino), 0.2 μL 500 μ tag DNA polymerase and 2.0 μL of 2.5 mM dNTPs (Biolino); 1.0 μL of 10 μM each primer, 16.05 μ of 500 ml and 1.0 μL DMSO (dimethly sulfoxide) were used to carry out the PCR amplification with DEPC-treated water (in vitrogen corporation). Routine PCR cycling profile was used for the reaction and involved 940C cycle for 2 minutes, another 40 cycles of 2 minutes and a 720C 5 minute final extension [17].
Electrophoresis was conducted using a 1.5% agarose gel containing 0.5 mg/ml ethidium bromide. A transilluminator UV light was used for photographing the plates. The amplification was repeated at least twice to ensure reproducibility.
Fingerprint analyses was carried out using py Elph version 1.4. The Principal Coordinate analyses was done using SPSS ver. 21 while DNA gel analyzer 2010 was used for band scoring of the blood samples [18].
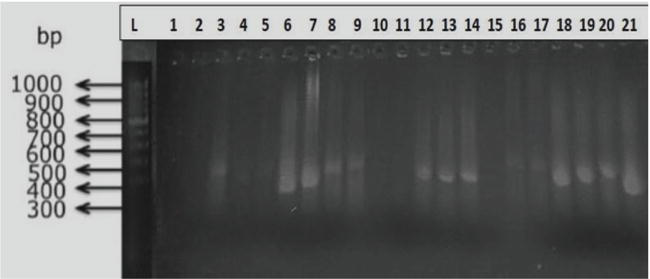
Figures 2 and 3 presents the results of PCR amplification products of 21 blood samples obtained from 3 goat breeds (Figures 1-3) using Agarose gel electrophoresis. L is the 100 bp DNA ladder. Samples 1–12 were obtained from the Red Sokoto breed, samples 13–16 were from the sahel white while the remaining samples 17–21 were that of the West African dwarf goat. Of the 12 samples taken from the Red Sokoto breeds, only 7 of the genomic DNA were amplified between the 400-600 bp in the DNA ladder (Table 1). 2 bands from SW were polymorphic and all 5 samples from WAD were polymorphic (Figure 2).
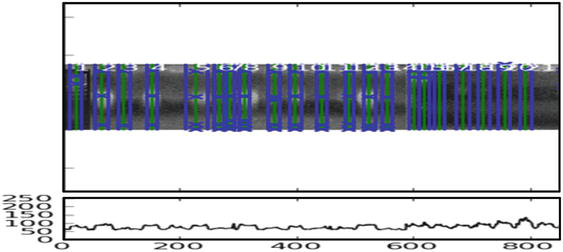
Figure 2.
Electrophoregram showing PCR products during amplification with the primers. Source: [19].
Table 2 shows the results of band scoring indicating monomorphism or polymorphism among the 21 samples obtained from Red Sokoto (RS), Sahel white (SW) and the West African dwarf (WAD) breeds of goats in Calabar. Absence of band was indicated with zero (0) score while the presence of band was indicated with 1 score. The absence of band or 0 score in any simple loci for any primer used indicated polymorphism while presence of bands in all loci or score of 1 all through indicates a monomorphic condition. Thus, as shown in Table 2, all the 21 samples from the 3 goat breeds were all polymorphic showing great genetic variations between the three breeds.
Band scoring showing polymorphism for all 21 samples obtained from 3 breeds of goats.
WAD = West African dwarf goat.
3.3 Population differentiation
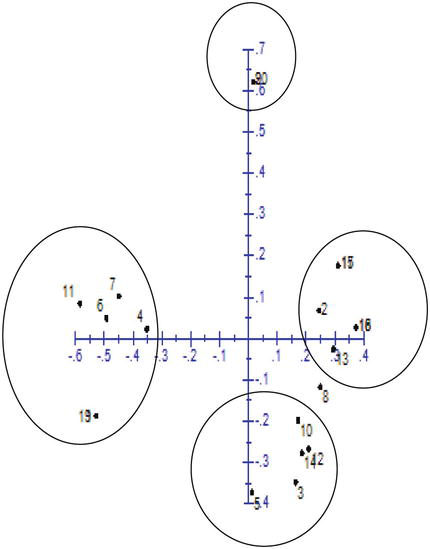
Table 3 presents the results of principal component analysis (PCoA) generated from 5 principal components which anchors of the molecular data generated. Principal component 1 contributed 31.21% to the total molecular variability observed among the breeds of goats evaluated. The results also differentiated the sample population into four different population structures as shown in Figure 3.
Primers
NPB
TBN
MAF
No. of Alleles
Gene diversity Polymorphism % PIC
Primer
1
1
3
0.43
6
0.568
74.02
0.654
Primer
2
1
3
0.36
8
0.793
27.00
0.769
Primer
3
3
3
0.24
9
0.852
53.45
0.834
Primer
4
2
4
0.26
10
0.889
61.30
0.813
Primer
5
2
4
0.26
10
0.884
88.23
0.782
Primer
6
4
8
0.30
10
0.766
59.23
0.692
Primer
7
5
10
0.60
9
0.754
51.10
0.710
Primer
8
4
5
0.36
8
0.480
26.54
0.365
Primer
9
4
6
0.28
8
0.748
71.00
0.709
Primer
10
1
4
0.32
9
0.835
75.80
0.818
Primer
11
1
4
0.26
7
0.768
79.00
0.760
Primer
12
4
5
0.24
9
0.768
65.00
0.760
Primer
13
4
5
0.34
8
0.860
65.40
0.654
Primer
14
2
4
0.33
9
0.772
45.30
0.453
Primer
15
1
2
0.44
6
0.564
32.40
0.324
Primer
16
1
2
0.42
8
0.556
45.53
0.543
Primer
17
1
2
0.21
12
0.678
65.44
0.654
Table 3.
Genetic diversity analysis for 21 samples obtained from three breeds of goats.
KEY: NPB = Number of polymorphic bands; TBN = Total number of bands; Mi = Marker Index; MAF = Major Allelic Frequency; PIC = polymorphic information content.
The principal coordinate analysis threats an edge length sum of 4.6177, a mean error of −0.001, a mean absolute error of 0.0696, maximum absolute error of 0.26007 and a mean square error of 0.0085, with a cophenetic (r) value of 0.9645 as fit criterion for the population differentiation.
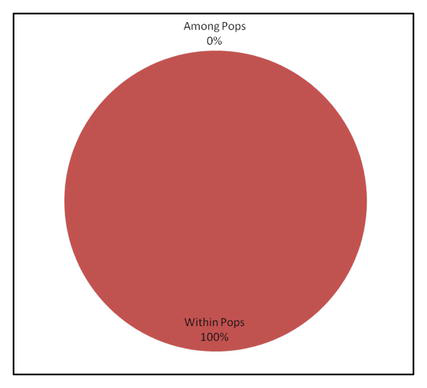
3.4 Percentage variability
Figure 4 presents the variability results among and within the investigated goat breeds. 100% variability was singled out within the species attributable to variations in the DNA molecules while 0% variability recorded among populations was attributable to environmental influence.
Figure 4.
Scattered plots showing population differentiation among 21 samples collected from 3 breeds of goats.
As presented in Table 3, primer 8 produced the least gene diversity index of 0.480 among the samples while the highest gene diversity of 0.889 was obtained with ISSR primer 4. Generally, the results of gene diversity as revealed by the ISSR primers was high for most of the primers. Gene diversity of 0.852, 0.889, 0.884, 0.835 and 0.860 were revealed by ISSR primers 3,4,5, 10 and 11. Gene diversity of 0.793, 0.766, 0.754, 0.748, 0.768, 0.768, and 0.772 were revealed by ISSR primers 2,6,7,9,11,12 and 13 while ISSR primers 1,8,15,16 and 17 revealed gene diversities of 0.568, 0.480, 0.564, 0.556 and 0.678 respectively. The high gene diversity observed among the goat samples is an indication of high genetic variability existing among the breeds evaluated (Figure 5).
Figure 5.
Percentage variability among and within populations.
The experimental goats showed variability in genetic characteristics and the results indicated the effectiveness of ISSR analysis in detecting polymorphisms [20]. The electropherogram in Figure 1 reveals that out of the 21 samples evaluated, 15 amplified with the ISSR primers used between 300 and 1000 bps of DNA ladder. 58.33% amplification was observed from the RS population and 50% of the samples taken from the SW breed were amplified by the primers at 400-500 bp DNA ladder size (Figure 1 and Table 1). Interestingly, as shown in Figure 1 and Table 1, all the samples taken from the West African dwarf goat were amplified by the primers between 400 and 600 bps of the molecular ladder to produce a 100% amplicon. Estimation of higher level of genetic variation in the breeds might be consistent with the fact that they are highly polymorphic animals. In ref., [18] obtained values lower than the values calculated between breed band sharing (BS) here. The value for these 2 breeds obtained was lower (0.43 to 0.66) than within breed BS value, which was 0.70 to 0.93 in Malvi breed and 0.68 to 0.88 in Sahiwal breed found within similar genetic distances [18].
In this study, all the 21 samples from the 3 goat breeds were polymorphic showing great genetic variations between the three breeds (Table 3). Population differentiation investigations showed four population structures as seen on the scattered plots diagram (Figure 3). The high polymorphism of the WAD breed (100%) found in this study indicates that this goat breed has the required amount of genetic variation to make genetic improvement in the near future. This result resonates with that reported by [19] where they had 93.49% polymorphism among three goat breeds studied as well.
The percentage variability studies suggest greater genetic diversity occurred within the three populations than among individuals within the three populations (Figure 4). This indicates that the local goat populations are genetically differentiated along geographical localities. In ref., [21, 22] reported similar results in their research on chickens. This also agrees with results presented by [23, 24] where they reported high intra- population genetic diversity (91%), in comparison to inter-population genetic diversity among states (6.17%) and within states (2.77%). These results negates those earlier presented by [25] were they recorded a large proportion of genetic variation (87.46%) among populations while only 12.54% residing among individuals within populations in Psammochloa villosa population detected by ISSR markers too.
Inter simple sequence repeats (ISSR) amplification has been shown to be a suitable molecular marker assisted technique for DNA finger printing of the Nigerian indigenous local goat breeds. Thus in future selective breeding programs, this technique may be employed by animal breeders and other stake holders, in the improvement and conservation of the local goat population.
This DNA finger printing investigation of three goats breeds in Cross River state, Nigeria, have shown that the indigenous goats (Capra aegegrus hircus) found within the Calabar environs are genetically different and do not have any evolutionary relatedness.
It will therefore be necessary to recommend that an indepth breeding and conservation program for the Red Sokoto, WAD and White Sahel breeds of goats be put in place by the Cross River State government and/or individuals to boost supplies of mutton varieties for both local and international consumption. Other aspects of molecular studies, like the evolutionary trees, for these breeds can also be explored. There’s need for Inbreeding programs among the goat breeds to be initiated too for sustainability and perpetration of these goat breeds.
I wish to acknowledge Ms. Minka Ogar Mbeh, who helped with the field work and her colleagues who all worked in the field. The laboratory staff at both Biosolutions Laboratory, Akure and in the Department of Genetics and Biotechnology, University of Calabar, Calabar, that helped with the molecular and data analyses respectively. And finally the goat farmer who availed us his goat breeds for sample collection.
References
1.FAO Statistics. Food and Agricultural Organization of the United Nations. Feedipedia - Animal Feed Resources Information System - INRAE CIRAD AFZ and FAO. 2011
2.Field work, 2020
3.Abdul-Aziz M. Present status of the world goat populations and their productivity. Lohmann Information. 2010;45(2):42-52
4.Adedeji TA, Ozoje MO, Peters SO, Sanusi AO, Ojedapo LO, Ige AO. Goat pigmentation and wattle genes effect on store haematological characteristics of heat stressed and extensively reared west African dwarf goats. World Journal of Life Science Medical Resources. 2011;3:48-55
5.Kumar J, Rao BV. Registration of ICCV 96029, a super early and double podded chickpea germplasm. Crop Science. 2001;41(2):605
6.Frakham R, Ballou JD, Briscoe DA. Introduction to Conservation Genetics. London: Cambridge University Press; 2002
8.Russel J, Fuller J, Macaulay M, Hatz B, Johoor A, Powell WR. Direct comparison of levels of genetic variation among barley accessions detected by RFLPs, AFLPs SSRS and RAPDs. Theoretical and Applied Genetics. 1997;95:714-722
9.Zietkiewicz E, Rafalski A, Labuda D. Genome fingerprinting by simple sequence repeat (SSR)-anchored polymerase chain reaction amplification. Genomics. 1994;20:176-183
10.Mason IL. A World Dictionary of Livestock Breeds, Types, and Varieties. Third ed. Wallingford, UK: CAB International; 1988
11.Adedibu II, Sola-Ojo FE, Lawal M. Sokoto red and Sahelian goats: The untapped potential for improving meat production in the developing economy of Nigeria. Nigerian Journal of Animal Production. 2017;44(4):325-332
12.Iheanacho AC, Ali EA. Marketing of Sahelian Goats in north-eastern Nigeria: Experience from Borno state. Sahel Journal of Veterinary Science. 2010;9(1):56-61
13.Chiejina SN, Behnke JM, Fakae BB. Haemonchotolerance in West African Dwarf goats: contribution to sustainable, anthelmintics-free helminth control in traditionally managed Nigerian dwarf goats. Parasite. 2015;22:7. DOI: 10.1051/parasite/2015006
14.Ndamukong KJN, Sewell MMH, Asanji MF. Disease and mortality in small ruminants in the north West Province of Cameroon. Tropical Animal Health and Production. 1989;21:191-196. DOI: 10.1007/BF02250833
15.Luiting P, Montsma G, Verstegen M, Hofs P, Hel W, Zijlker JW. Effects of high ambient temperature on the metabolism of West African Dwarf goat. International Journal of Biometeorology. 1985. DOI: 10.1007/BF02189001. Corpus ID: 85202661
16.Al-dawood A. Towards heat stress management in small ruminants—A review. Annals of Animal Science. 2017;17:59-88. DOI: 10.1515/aoas-2016-0068
17.Popoola AM, Saka AA, Olaniyi AT, Yahaya OM, Adebisi LG. Influence of temperature humidity index on skin temperature of west African dwarf goats raised in Nigeria. Agricultural Advances. 2014;3(1):28-32
18.Laryngoscope. Author manuscript; available in PMC 2010 Jun 14. Published in final edited form as. The Laryngoscope. 2009;119(4):727-733. DOI: 10.1002/lary.20116
19.Sharma M, Singh S, Kushwah A, Sarkhel BC. Molecular characterization of Malvi and Sahiwal breed of cattle by RAPD-PCR. The Indian Journal of Animal Sciences. 2009;79:44-46
20.David I. Intersimple sequence repeat (ISSR) polymorphisms as a genetic marker system in cotton. Molecular Ecology Notes. 2001;1(3):205-208
21.Al-Barzinji YMS, Hamad AO. Characterization of local goat breeds using RAP-DNA markers. In: 6th International Conference and Workshops on Basic and Applied Sciences. 2017. DOI: 10.1063/1.5004287
22.Ansari SA, Narayanan C, Wali SA, Kumar R, Shukla N, Rahangdale SK. ISSR markers for analysis of molecular diversity and genetic structure of Indian teak (Tectona grandis L.f.) populations. Annals of Forest Research. 2012;55(1):11-23
23.Field Studies. 2021
24.Li A, Ge S. Genetic variation and clonal diversity of Psammochloa villosa (Poaceae) detected by ISSR markers. Annals of Botany. 2001;87(5):585-590. DOI: 10.1006/anbo.2001.1390
25.Wani CE, Yousif IA, Ibrahim ME, Mua HH, Eamin KM. Morphological, reproductive and productive characteristics of Sudanese native chicken. Animal Genetic Resources. 2014;54:33-41
Written By
Hannah Etta
Submitted: 09 December 2022Reviewed: 02 January 2023Published: 23 April 2023
 Open access peer-reviewed chapter