Open Access is an initiative that aims to make scientific research freely available to all. To date our community has made over 100 million downloads. It’s based on principles of collaboration, unobstructed discovery, and, most importantly, scientific progression. As PhD students, we found it difficult to access the research we needed, so we decided to create a new Open Access publisher that levels the playing field for scientists across the world. How? By making research easy to access, and puts the academic needs of the researchers before the business interests of publishers.
We are a community of more than 103,000 authors and editors from 3,291 institutions spanning 160 countries, including Nobel Prize winners and some of the world’s most-cited researchers. Publishing on IntechOpen allows authors to earn citations and find new collaborators, meaning more people see your work not only from your own field of study, but from other related fields too.
To purchase hard copies of this book, please contact the representative in India:
CBS Publishers & Distributors Pvt. Ltd.
www.cbspd.com
|
customercare@cbspd.com
The earthquake catalogue of Ghana since the first recorded earthquake and recently collected seismic data in earthquake-prone locations of the Greater Accra Region, Ghana’s capital, are covered in this chapter. This study lists the locations, periods, magnitudes, and intensities of 44 earthquakes and tremors from the past 408 years using the country’s seismic inventory. The HoliSurface approach was also utilised to conduct Multichannel Analysis of Surface Wave (MASW) surveys to collect seismic data from 22 sites in the southern Greater Accra Region’s seismically active zones. The earthquake catalogue data and geophysical data will help determine if Ghana is facing a major earthquake. This analysis shows that consistent earth tremors over the previous few years increase the risk of a devastating earthquake. The Gutenberg-Richter relations further emphasise the probabilities of a looming earthquake threat in the Ghana. The geophysical investigations also revealed areas with relatively weak subsurface materials that might contribute to more destruction in the event of an earthquake. The fundamental periods of the sites being in resonance with the buildings is also another disaster in waiting.
Despite the fact that Ghana is located far away from the active global plate boundaries, the country has suffered damaging earthquakes as far back as 1615. Over the years, it was observed that earthquakes in Ghana have been concentrated in the southern part of the country [1, 2, 3]. Knowledge of Ghana’s earthquake dataset will serve as a medium for understanding the trend in the country’s seismic activity and serve as reliable input data for seismic hazard assessment. There is much importance in cataloguing historical earthquake events on a national scale so as to be well-informed on the level of seismicity of the area in question [4]. Furthermore, the catalogued records could be subsequently processed, analysed and utilised for future predictions such as the return periods, magnitude and intensity of potential earthquakes, ground response analyses and tectonic investigations among others. All these pieces of information would go a long way to assist in hazard assessment activities, disaster preparedness and control, designation of construction sites, urban planning activities and other mitigation and disaster prevention mechanisms.
The use of shear wave velocity (VS) is commonly employed to estimate ground motion and predict the impact of earthquakes [5, 6]. Thus, conducting an on-site survey to measure VS is considered a practice in earthquake related engineering. Shear wave velocity directly correlates with the stiffness or rigidity of materials as indicated by the elastic shear modulus (G). Therefore, VS acting as a substitute for G is extensively utilised in the fields of construction, engineering and seismic response studies. It is crucial to conduct tests and accurately interpret the results to ensure assessment of resistance against seismic activity. One key quantitative measure used for site evaluation is VS30, which represents the shear wave velocity within the 30 meters of soil or rock [7]. This measure is widely used as an indicator for assessing site response in engineering practices. As a result, it finds application in seismic construction regulations set by organisations like the European Committee for Standardisation [8] and the National Earthquake Hazards Reduction Program (NEHRP) [9]. The parameter Vs30 is frequently incorporated into ground motion prediction equations (GMPEs) to characterise sites and facilitate micro zonation purposes [10, 11].
The geological formations in Ghana are predominantly composed of ancient rocks dating back to the Paleoproterozoic, Neoproterozoic, and potentially the early Palaeozoic eras. However, it is worth noting that in the coastal regions, the prevalence of Palaeozoic, Mesozoic, and Cenozoic rocks is more pronounced. The primary Precambrian rock formations encompass the metamorphosed and folded Dahomeyan, Birimian, Tarkwaian System, Togo Series, and the Buem Formation. The Palaeozoic geological strata encompass notable formations such as the Voltaian System and the Sekondi-Accraian Formations [12]. The continental platform of West Africa was formed through the amalgamation of the Paleoproterozoic Complex, Voltaian Basin, Akwapim-Togo Belt, and Pan-African Province during the Neoproterozoic—Cambrian Pan-African tectono-metamorphic event. The geological stability of this platform was rather consistent, with only minor sedimentary basins forming at its limits and tectonic events occurring as a result of the Atlantic Ocean’s formation [12, 13].
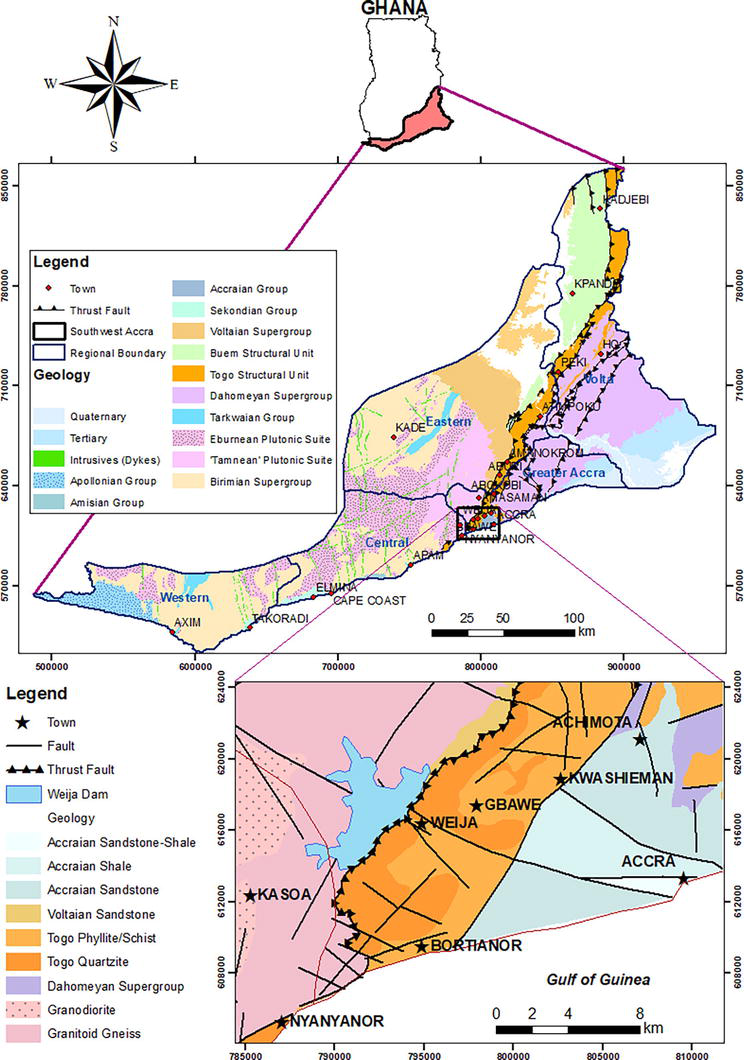
The tectonic configuration of Southeastern Ghana and its offshore region is distinguished by the presence of three separate zones exhibiting unique tectonic components. The geological features under consideration include the Akwapim fault zone, faults located in the coastal area and near the coast shelf, with the primary characteristic being the coastal boundary fault, as well as the Romanche Fracture Zone [2, 4, 14]. The St. Paul’s transform zone system, which extends from Cote D’Ivoire and turns eastward to form the Akwapim thrust fault, intersects with the splay of the Romanche transform fault, giving rise to the Coastal boundary fault. This geological configuration has implications for the seismicity of the Accra region, as the activation of the St. Paul’s transform zone system can partially influence seismic activity in this area. The fault system under consideration comprises of splays originating from the Romanche fault and the eastward deviation of the St. Paul’s fault system. This fault system has been associated with various seismic events of historical significance in the Accra region [14]. The zone encompasses various areas, including Weija, Gbawe, Bortianor, and Accra central, among others. The geological map of Southern Ghana (Figure 1) reveals the presence of the Akwapim fault zone, which extends in a northeast-southwest direction. This fault zone acts as a boundary, separating the Birimian supergroup located to the west from the Pan African Mobile Belt situated to the east. The region in question is known for being the primary location of both historical and modern seismic events within the country. This can be attributed to the inherent instability present at the contact point of the thrust fault in this area.
Figure 1.
Geological map of earthquake-prone zones in Ghana [15].
The first ever documented earthquake in Ghana occurred within the Elmina township in 1615. This earthquake was estimated to have an epicentral intensity of 8. However, the first destructive earthquake in the country was recorded in December, 1636 within a town known as Axim; the quake had a surface wave magnitude of 5.7. In June 1939, the most destructive earthquake in Ghana’s history occurred in Accra. This earthquake had a magnitude of 6.3, causing 130 injuries, 17 deaths and destruction of many buildings and properties [4, 14, 16]. The 1939 earthquake was followed by a series of minor earthquakes and earth tremors.
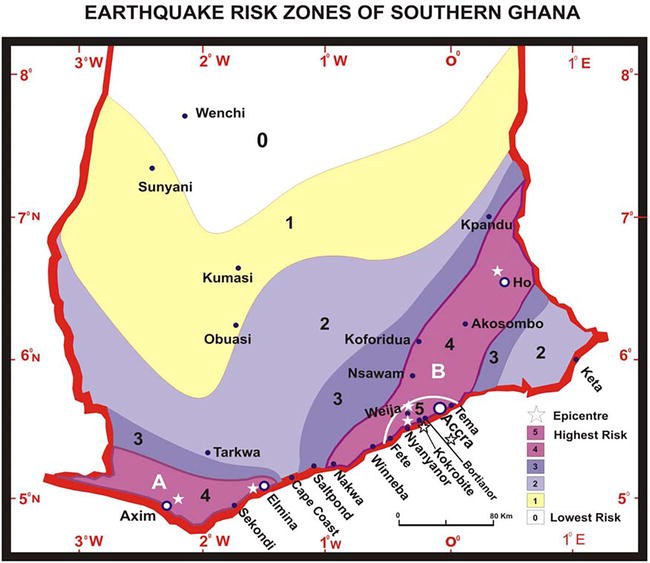
Over the 408-year earthquake period, the Greater Accra Region recorded the highest number of earthquake events (over 27), with Accra and Weija having the highest occurrences of at least 10 each (Figure 2). Other areas within the region that have experienced the phenomenon are Amasaman, Kwashiman, Achimota, Kokrobite, Abokobi, Bortianor and Gbawe among other suburbs. These areas are found within the Southwestern section of the region and are noted to record earthquake/tremor events most frequently, especially from 1964 till date. The Central Region records the second-highest number of earthquakes in the country. This region is situated to the immediate west of the Greater Accra Region, hence manifesting some seismic traits of the seismically active region. Coastal towns in the region such as Elmina, Cape Coast, Apam, Gomoa Fete and Nyanyanor have all been hit by earthquakes and tremors with different magnitudes [4].
Figure 2.
Seismic zonation map of Ghana showing the earthquake risk zones [14].
The Western Region, where the first recorded destructive earthquake occurred is one of the scarcely stricken regions along the coast. After the 1636 event in Axim, the next was recorded in 2007 in Takoradi, the regional capital. This trend might seek to portray the Western Region as one of the most seismically stable regions in the country with regards to the return period of earthquakes. It should however be noted that anytime there is an earthquake activity in the region, the magnitudes are relatively high (5.7 and 5.2). The Volta and Eastern Regions have also recorded earthquake events in the past. One of the highest earthquake magnitudes/intensities (6.5/9 Io) in the country was recorded in Kpando in 1862. Other towns within the Volta Region that have recorded such an event are Ho, the regional capital, Kadjebi and Peki. The towns within the Eastern Region that have recorded earth tremor events are Amanokrom, Kade, Atimpoku and Aburi among others [4, 15].
Over the past 5 years (2018 to 2023), earth tremors have been occurring within the Greater Accra Region at an alarming rate with Richter magnitudes ranging from 2.6 to 4. This continuous occurrence has raised an eyebrow; giving indications of a pending potential massive earthquake event. The continuous tremors result in gradual loss of friction between the fault planes due to the wearing off of rock fragments during the movement of the blocks. As this phenomenon continues, the fault planes would no longer be able to resist the sliding of the blocks past each other when a seismic wave triggers. This phenomenon would result in a greater displacement of the blocks, producing a much more intensive seismic activity.
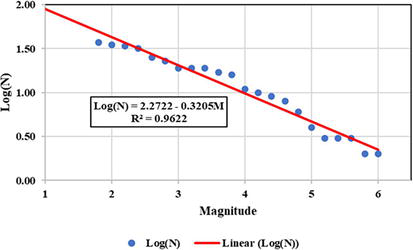
The earthquake catalogue presented in Table 1 can be analysed to provide further earthquake parameters such as the probability of recurrence, annual frequency of occurrence among others using the Gutenberg-Richter relation [18, 20]. The Gutenberg-Richter law states that there is a linear relationship between the logarithm of the frequency and the magnitude of the earthquake. The relationship is often plotted to the data that is accessible for any geographical area [18]. The Gutenberg-Richter relation can be represented as:
Year
Month
Latitude
Longitude
Magnitude (ML)
Io
Location
Reference
1615
—
5.1
−1.3
—
8
Elmina
AMB
1636
December
5.1
−2.2
5.7
9
Axim
AMB
1836
December
5.1
−1.28
—
6.5
Cape Coast
AMB
1862
July
7.0
−0.4
6.5
9
Kpando
AMB
1870
November
5.3
−0.7
4.5
5
Apam
AMB
1872
April
5.5
−0.4
4.9
7
Accra
AMB
1889
April
5.9
−0.2
4.0
4
Amanokrom
AMB
1906
November
6.5
−0.3
5.0
7.5
Ho
ALY
1907
February
6.1
−0.9
4.1
4
Kade
AMB
1910
December
5.6
−0.2
—
5
Accra
AMB
1911
June
5.5
−0.2
—
4
Accra
AMB
1939
June
5.4
−0.25
6.3
8
Accra
ALY
1948
—
6.2
−0.4
—
4
Atimpoku
AMB
1950
October
7.5
−0.5
—
4
Kadjebi
AMB
1964
March
5.9
−0.39
4.4
6
Amasaman
AMB
1966
—
5.58
−0.35
—
4
Weija
ALY
1969
February
5.5
−0.2
4.8
5.5
Accra
ALY
1977
November
5.58
−0.38
2.3
—
Weija
GSD
1978
February
6.58
0.13
2.9
—
Peki
GSD
1978
September
5.53
−0.35
3.9
—
Weija
GSD
1979
January
5.5
−0.33
2.3
—
Kasoa
GSD
1987
November
5.58
−0.32
2.6
—
Weija
GSD
1988
March
5.6
−0.11
3.5
4
Accra
ISC
1989
March
5.59
−0.33
2.0
—
Kwashiman
GSD
1990
April
5.59
−0.34
3.0
3
Weija
GSD
1991
August
5.62
−0.33
3.9
—
Weija
GSD
1992
March
5.62
−0.33
2.1
—
Achimota
GSD
1993
June
5.59
0.32
2.5
—
Weija
GSD
1994
January
5.38
0.34
2.6
—
Nyanyanor
GSD
1995
October
5.5
−0.35
4.0
—
Kokrobite
GSD
1996
August
5.44
−0.48
2.5
—
Gomoa Fete
GSD
1997
March
5.6
−0.33
4.8
5.5
Weija
GSD
1998
December
5.52
−0.22
2.0
—
Nyanyanor
AMP
1999
May
5.79
−0.25
2.5
—
Abokobi
AMP
2000
November
5.83
−0.24
2.7
—
Aburi
AMP
2002
June
5.5
−0.3
3.0
—
Bortianor
AMP
2003
May
5.57
−0.32
2.9
—
Weija
AMP
2006
January
5.53
−0.21
3.7
—
Accra
GSD
2007
September
4.92
1.73
5.2
—
Takoradi
GSD
2018
December
5.56
−0.33
2.6
—
Weija
GSD
2019
January
5.6
−0.23
2.6
—
Accra
GSD
2020
June
5.59
−0.25
4.0
—
Accra
GSD
2022
June
5.57
−0.31
3.5
—
Gbawe
GSD
2023
December
5.55
−0.27
2.8
—
Accra
GSD
Table 1.
Ghana’s earthquake catalogue from 1615 to 2023.
(Sources: ALY modified after Ambraseys and Adams [3]; AMB [3]; AMP [4]; GSD - Geological Survey Department [15]; ISC, International Seismological Centre [1]; and [17]. Abbreviations: N – the number of earthquakes with magnitudes greater than M for time period [18]; Io – Epicentral Intensity [19]).
log10N=a−bMorN=10a−bME1
where, N is a number of earthquakes having magnitude larger than M during a time period “t”, logN is a logarithm of the number of earthquakes with magnitude M, “a” is a constant that measures the total number of earthquakes at the given source or measure of seismic activity, and “b” is a slope of regression line or measure of the small versus large events. From Figure 3, parameters “a” and “b” in Eq. (1) can be found to be 2.2722 and − 0.3205 respectively.
Figure 3.
Plot of log(N) versus magnitude.
These parameters provide the basis for calculating some important values that help in estimating the likelihood of future earthquake occurrences. Some of these estimates are the annual frequency of exceeding the M event magnitude N1(M), the probability of occurrence of at least one earthquake of magnitude greater than M in the next t years P(t) and the number of years in average that an earthquake occurs with magnitude greater than M (TR) among others. These estimations as are given by the relations below after [20]:
N1M=10a−bM−logtE2
Pt=1−e−N1M∗tE3
TR=1N1ME4
The first known magnitude of earthquakes recorded in Ghana was in 1636, thus 388 years duration of recorded earthquake activities in the country. Hence, the time period “t” considered was 388 years in calculating N1M (Table 2).
Magnitude
N1(M)
P(t) (%)
TR (Years)
t = 2
t = 10
t = 50
t = 100
4.0
0.025
4.91
22.27
71.63
91.95
39.69
4.5
0.017
3.42
15.99
58.15
82.49
57.40
5.0
0.012
2.38
11.35
45.25
70.02
83.01
5.5
0.008
1.65
7.99
34.06
56.52
120.06
6.0
0.006
1.15
5.60
25.02
43.78
173.63
6.5
0.004
0.79
3.90
18.05
32.85
251.12
7.0
0.003
0.55
2.72
12.86
24.07
363.19
Table 2.
Earthquake estimations for Ghana based on catalogued data.
The following deductions can be made from Table 2: considering a magnitude of 5 for instance, an annual frequency of earthquakes greater than 5 is expected to be 0.012; in 2 years, the probability of an earthquake with magnitude 5 occurring is 2.38%, whereas in 100 years, a similar magnitude earthquake has a 70.02% chance of occurring; the estimated return period of an earthquake with magnitude 5 to occur is 83.01 years.
4.1 Shear wave velocity data collection and processing
The holisurface technique employs a holistic analysis of surface waves (Rayleigh and Love waves) expressing the fact that the method analyses the propagation of surface waves in a complete and holistic way. The uniqueness of this method over the traditional refractive analysis and Multichannel Analysis of Surface Waves (MASW) is the utilisation of the single three-component (3C) geophone in the acquisition of surface waves [21]. This acquires radial and vertical components of Rayleigh waves and the transversal component of Love waves. The technique follows the active geophysical principle, where an active source (sledgehammer) is used to trigger surface waves by employing a number of stackings. In this work, a total of 10 stacks were applied with a 20-tonne sledgehammer on a nylon strike plate for the survey over a total spread separation (offset) of 20 m.
Shear wave velocity (Vs) profiles are obtained after a series of processing stages. The HoliSurface™ software was used to conduct a joint inversion of two components (2C inversion). These components may be the vertical or radial components of the Rayleigh wave (ZVF or RVF) together with the transverse component of the Love wave. A group velocity spectrum is then generated from the datasets which displays the fundamental mode and other higher order modes. With the help of the fundamental and the higher modes, shear wave velocity profiles are then generated using the concept of frequency-depth relationship [22, 23]. The Vs30 values are then calculated using the Vs within the first 30 m depth of the traverse. Essential geotechnical parameters that aid in estimating the ability of the ground to withstand seismic impacts are then computed [24].
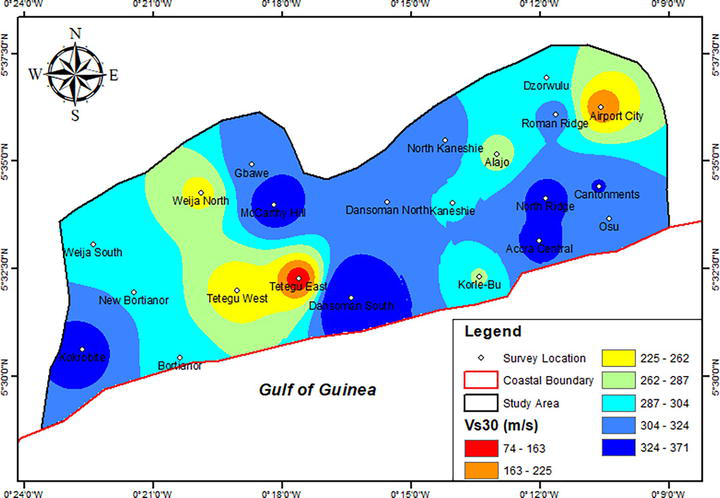
The site classification for this study was conducted using the Eurocode 8 Standard for seismic site classification. From the 22 sites that were surveyed, 19 of them fall within the C site class indicating subsurface deposits of medium-densified coarse-grained soils or medium-consistent fine-grained soils with substrate depths greater than 30 m and mechanical qualities that improve with depth. The shear wave velocity of this class ranges from 180 m/s and 360 m/s (Table 3). One (1) of the sites (Dansoman South) recorded the highest Vs30 (371 m/s), making it to be classified as B. This signifies that the site is underlain by soft rocks and deposits of very dense coarse-grained soils or very consistent fine-grained soils, characterised by an increase in geo-mechanical properties with depth. This class of sites has shear wave velocities between 360 and 800 m/s. The Airport City and Tetegu East sites recorded relatively low Vs30 values of 177 and 74 m/s respectively. The former was classified as D, indicating subsurface deposits of poorly thickened coarse-grained soils or poorly consistent fine-grained soils, whereas the latter classified as E with unconsolidated or weak cohesionless materials; thus, could take on the description of class D materials. These results were used to generate an interpolation map using the Inverse Distance Weighting (IDW) technique (Figure 4).
SN.
Area
Vs30 (m/s)
Bulk Density, ρ (g/cm3)
Shear Strength, Su (MPa)
Young’s Modulus, E (MPa)
Fund. Period, T (s)
Eurocode 8 Class
1
Accra Central
332
1.66
183.02
461.61
0.36
C
2
Airport City
177
1.46
45.87
119.22
0.68
D
3
Alajo
273
1.60
119.00
298.65
0.44
C
4
Cantonments
326
1.65
175.83
446.76
0.37
C
5
Dzorwulu
294
1.62
140.08
362.70
0.41
C
6
Kaneshie
302
1.63
148.60
365.97
0.40
C
7
Korle-Bu
285
1.61
130.82
319.81
0.42
C
8
North Kaneshie
316
1.64
164.18
396.29
0.38
C
9
North Ridge
337
1.67
189.14
505.53
0.36
C
10
Roman Ridge
314
1.64
161.90
401.42
0.38
C
11
Weija North
250
1.57
98.06
229.29
0.48
C
12
Osu
307
1.63
154.07
408.42
0.39
C
13
McCarthy Hill
344
1.67
197.89
491.04
0.35
C
14
Kokrobite
337
1.67
189.14
466.40
0.36
C
15
New Bortianor
304
1.63
150.77
386.61
0.39
C
16
Bortianor
295
1.62
141.13
342.30
0.41
C
17
Dansoman South
371
1.70
233.68
585.01
0.32
B
18
Tetegu East
74
1.23
6.73
16.92
1.62
E
19
Tetegu West
227
1.54
79.30
210.98
0.53
C
20
Dansoman North
307
1.63
154.07
379.93
0.39
C
21
Gbawe
321
1.65
169.95
423.53
0.37
C
22
Weija South
296
1.62
142.18
360.19
0.41
C
Table 3.
Geotechnical parameters and site classification from shear wave velocity.
Figure 4.
Distribution of shear wave velocities in survey area.
As presented in Table 3, the geotechnical parameters derived from the Vs indicate a direct correlation in the subsurface properties. The Tetegu East site which had the lowest shear wave velocity was observed to have recorded the least bulk density value of 1.23 g/cm3, shear modulus of 6.73 MPa and Young’s modulus of 16.92 MPa. On the other hand, Dansoman South recorded the highest geotechnical parameters such as a bulk density of 1.70 g/cm3, shear modulus of 233.68 MPa and Young’s modulus of 585.01 MPa; proving to be the most competent site.
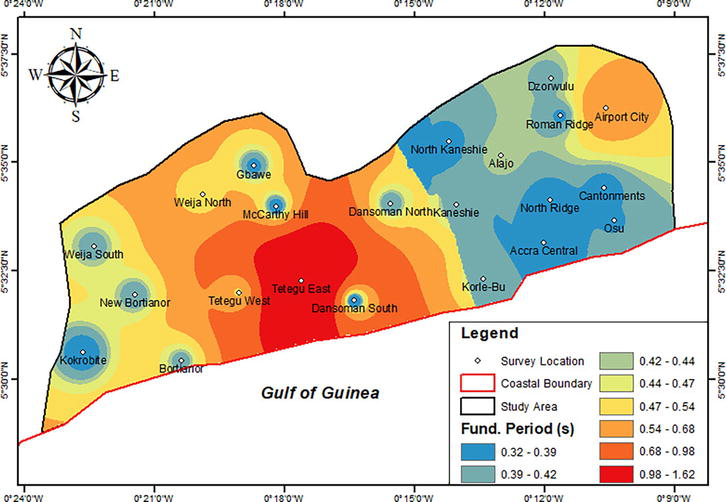
Regarding the fundamental periods of the overburden materials in the respective survey locations, it was observed that the values ranged basically from 0.35 to 0.53 s, which corresponds to the C class of Eurocode 8. There were however outliers like 1.62 s (Figure 5) which corresponds to the E class of the Eurocode 8, 0.68 s belonging to class D and 0.32 s tallying with the B class. Based on the classification concentrically braced steel frame (CBF) storey buildings and their corresponding fundamental periods [28], storey buildings with 15 floors would have a fundamental period of 1.8 to 2.2 s, whereas that of 12 storeys would be 1.3 to 1.7 s, 6 storeys being 0.5 to 0.7 s and 3 storey to single storeys ranging from 0.2 to 0.33 s. it can thus been seen that the higher the storey building, the higher the fundamental period (T) and vice versa. On the other hand, the greater the thickness of an unconsolidated or overburden material, the higher the fundamental period. Also, the shallower the depth to bedrock or the more consolidated and thinner the overburden is, the lower the fundamental period.
Figure 5.
Distribution of fundamental periods of soil overburden in survey area.
With respect to the earthquake catalogue of the country, it can be said that there is the likelihood of a large magnitude earthquake occurrence owing to the continuous earth tremors being recorded in recent times. The intensity of an earthquake depends on a number of factors such as the ground conditions, which includes the faulting systems, the site’s seismic response properties, the duration and magnitude of the earthquake, the frequency of the resulting seismic waves, the natural ground frequency and the peak frequency of the structures at the location of the earthquake. Based on the estimations made from the catalogue data using the Gutenberg-Richter relations, it can be said that there is a looming earthquake threat in Ghana. It may take some decades to occur, but the focus should be on avoiding disaster whenever the phenomenon strikes.
From the geophysical and geotechnical parameters obtained, it could be said that majority of the sites within the earthquake-prone areas have relatively competent subsurface. Only Tetegu East and the Airport City showed relatively incompetent materials. With this, the nature of buildings should be carefully looked at to ensure there is no resonance effect in case an earthquake event occurs. Areas with weak overburden materials have low natural frequencies or high fundamental periods. If high rise buildings which also generally have low natural frequencies or high fundamental periods are situated in such sites, there will be a resonance effect in the event of a high magnitude earthquake. This may lead to the collapse of the buildings and other engineering structures in those areas, causing fatal disaster. Unfortunately, this is the situation in Airport city where a fundamental period of 0.68 s was obtained. As stated earlier, storey buildings with about 6 floors (which can be found in that area) would have a fundamental period of 0.5 to 0.7 s. During a significant seismic event, there would be resonance effect, since the building and the subsurface will be oscillating at the same frequency or period. Such an imminent disaster should be avoided by altering the building designs to avoid resonance.
Appreciation goes to the Ghana Geological Survey Authority (GGSA), Architectural and Engineering Services Limited (AESL) and HGL Consult Limited, all in Accra, Ghana for their support during the data collection and processing stages.
The authors also thank the University of Mines and Technology for funding the PhD programme from which this survey was conducted.
1.Junner NR. The Accra earthquake of 22nd June, 1939. Gold Coast Geological Survey. 1941;13:3-41
2.Quaah AO. Microseismicity, Past Seismic Activity and Seismic Risk in Southern Ghana [Thesis]. London: University of London; 1980. p. 213
3.Ambraseys NN, Adams RD. Seismicity of West Africa. Annales de Geophysique. 1986;4B(6):679-702
4.Amponsah P, Leydecker G, Muff R. Earthquake catalogue of Ghana for the time period 1615-2003 with special reference to the tectono-structural evolution of south-East Ghana. Journal of the African Earth Sciences. 2012;75:1-13. DOI: 10.1016/j.jafrearsci.2012.07.002
5.Boore DM. Determining subsurface shear-wave velocities: A review. In: Third International Symposium on the Effects of Surface Geology on Seismic Motion. 2006. pp. 1-21. Available from: http://www.daveboore.com_www.daveboore.com/pubs_online/boore_103_revised_12july06.pdf
6.Moss RES. Quantifying measurement uncertainty of thirty-meter shear-wave velocity. Bulletin of the Seismological Society of America. 2008;98:1399-1411
7.Kamai R, Darvasi Y, Peleg Y. Measurement and interpretation uncertainty in site response of nine seismic network stations in Israel. Seismological Research Letters. 2018;89:1796-1806
8.European Committee for Standardization (CEN). Eurocode 8: Design of Structures for Earthquake Resistance - Part 1: General Rules, Seismic Actions and Rules for Buildings. Brussels, Belgium: The European Union; 2004
9.Building Seismic Safety Council (BSSC). NEHRP (National Earthquake Hazards Reduction Program) recommended provisions for seismic regulations for new buildings and other structures. FEMA. 1997;302:303
10.Abrahamson N, Silva W. Summary of the Abrahamson & Silva NGA ground-motion relations. Earthquake Spectra. 2008;24:67-97
11.Kamai R, Abrahamson NA, Silva WJ. VS30 in the NGA GMPEs: Regional differences and suggested practice. Earthquake Spectra. 2016;32:2083-2108
12.Kesse GO. The Mineral and Rock Resources of Ghana. Rotterdam, Netherlands: A.A Balkema; 1985
13.Junner NR. Geology of the Gold Coast and western Togoland (with revised geological map). Gold Coast Geological Survey Bulletin. 1940;11:1-40
14.Kutu JM. Seismic and tectonic correspondence of major earthquake regions in Southern Ghana with mid-Atlantic transform-fracture zones. International Journal of Geosciences. 2013;4:1326-1332. DOI: 10.4236/ijg.2013.410128
15.Hirdes W, Toloczyki M, Davis DW, Agyei Duodu J, Loh GK, Boamah K, et al. Geological Map of Ghana 1:1000000. BGR: GSD; 2009
16.Amponsah PE. Seismic activity in Ghana: Past, present and future. Annales de Geophysique. 2004;47:539-543. DOI: 10.4401/ag-3319
17.Amponsah PE. Seismic activity in relation to fault systems in Southern Ghana. Journal of the African Earth Sciences. 2002;35:227-234
18.Gutenberg B, Richter CF. Seismicity of the Earth and Associated Phenomena. Princeton, USA: Princeton University Press; 1949
19.Bao X, Jin Z, Cui H, Chen X, Xie X. Soil liquefaction mitigation in geotechnical engineering: An overview of recently developed methods. Soil Dynamics and Earthquake Engineering. 2019;120:273-291. DOI: 10.1016/j.soildyn.2019.01.020
20.Noora S. Estimating the probability of earthquake occurrence and return period using generalized linear models. Journal of Geoscience and Environment Protection. 2019;07:11-24. DOI: 10.4236/gep.2019.79002
21.Dal Moro G. Surface Wave Analysis for Near Surface Applications. Amsterdam, Netherlands: Elsevier; 2015. DOI: 10.1016/C2013-0-18480-2
22.Dal Moro G, Moura RMM, Moustafa SSR. Multi-component joint analysis of surface waves. Journal of Applied Geophysics. 2015;119:128-138. DOI: 10.1016/j.jappgeo.2015.05.014
23.Dal Moro G, Keller L. Unambiguous determination of the vs profile via joint analysis of multicomponent active and passive seismic data. In: Proceedings of 19th European Meeting of Environmental and Engineering Geophysics. Bochum, Germany: European Association of Geoscientists & Engineers; 2013. pp. 9-11
24.Ewusi A, Miezah-Adams M, Klu AK, Ansah E, Seidu J. Application of Holisurface technique in MASW and HVSR surveys for site characterisation at Ewoyaa, Ghana. Ghana Journal of Technology. 2023;7:30-43
25.Park C. MASW for geotechnical site investigation. The Leading Edge. 2013;32:656-662. DOI: 10.1190/tle32060656.1
26.Takewaki I. Earthquake resilience evaluation of building structures with critical excitation methods. In: Critical Excitation Methods in Earthquake Engineering. 2nd ed. Butterworth-Heinemann, Elsevier; 2013. pp. 363-380. DOI: 10.1016/b978-0-08-099436-9.00015-8
27.Anbazhagan P, Uday A, Moustafa SSR, Al-Arifi NSN. Correlation of densities with shear wave velocities and SPT N values. Journal of Geophysics and Engineering. 2016;13:320-341. DOI: 10.1088/1742-2132/13/3/320
28.Christidis AA, Dimitroudi EG, Hatzigeorgiou GD, Beskos DE. Maximum seismic displacements evaluation of steel frames from their post-earthquake residual deformation. Bulletin of Earthquake Engineering. 2013;11:2233-2248. DOI: 10.1007/s10518-013-9490-z
Written By
Albert Kafui Klu, Edmund Nana Asare, Jamel Seidu and Nicholas Opoku
Submitted: 01 September 2023Reviewed: 18 September 2023Published: 02 February 2024
 Open access peer-reviewed chapter