Open Access is an initiative that aims to make scientific research freely available to all. To date our community has made over 100 million downloads. It’s based on principles of collaboration, unobstructed discovery, and, most importantly, scientific progression. As PhD students, we found it difficult to access the research we needed, so we decided to create a new Open Access publisher that levels the playing field for scientists across the world. How? By making research easy to access, and puts the academic needs of the researchers before the business interests of publishers.
We are a community of more than 103,000 authors and editors from 3,291 institutions spanning 160 countries, including Nobel Prize winners and some of the world’s most-cited researchers. Publishing on IntechOpen allows authors to earn citations and find new collaborators, meaning more people see your work not only from your own field of study, but from other related fields too.
To purchase hard copies of this book, please contact the representative in India:
CBS Publishers & Distributors Pvt. Ltd.
www.cbspd.com
|
customercare@cbspd.com
The Kathmandu Valley, with many monumental and heritage structures, lies in a zone of high seismic risk. The neo-tectonic activities in the Himalayan region and the unconsolidated soil sediment are the major reasons for the high intensities of the ground motion in the valley. The conservation of the monument zones against the possible future earthquakes has been an issue of global concern. A probabilistic method to simulate the seismic ground motion parameters specific to sites lying in earthquake-prone region with a limited earthquake records is presented. Seismic hazard curves indicating the seismicity of a site is developed, risk consistent spectral shapes and corresponding power spectral density functions are obtained using empirical relationships, and ground acceleration time histories are simulated using Monte Carlo technique. One dimensional wave propagation analysis, with consideration of both linear and nonlinear behaviors of soils, is carried out to obtain the free field ground motion and the input response spectra for the structures. The method is illustrated by determination of site-specific seismic ground motion of three Bhaktapur city sites in the Kathmandu Valley. The significant influence of linear or nonlinear behavior of soil in the free field ground motion is observed in the monument zones.
Department of Civil Engineering, Pulchowk Campus, Institute of Engineering, Lalitpur, Nepal
*Address all correspondence to: pnmaskey@hotmail.com
1. Introduction
Seismic response analysis of structures at a site is an essential step toward the earthquake risk mitigation. Apart from the determination of seismic hazard potential of the site, the ground motion parameters specific to the site are required for the analysis of the structures in the site. These values for a site depend on the earthquake source mechanism, geologic path from source-to-site, and soil sediment properties of the site. Most of the regions in developing countries are characterized by a long history of earthquakes but with the lack of adequate earthquake records. The prevalent codes may give some features of design earthquake value for a site facilitating the general design process, but mere such codal values may not represent the realistic ground motion characteristics specific to the site. A realistic ground motion representation for a specific site may be considerably different from the values stipulated in the codes, which are basically developed for general purpose of design and applicable for a large region or zone. The development of ground motion parameters specific to a site in a probabilistic format could result into an improved method of design. A region with varying soil sediment characteristics may have to be microzoned with different possible ground motion at the free field.
The site-dependent earthquake ground motion for seismic input may be in the form of time histories, power spectral density, or response spectra. In the absence of enough earthquake records for a site, generation of such earthquake ground motions is the best alternative. The simulation of ground motion time histories for a specific region plays a vital role in generation of a realistic ground motion representation for a site.
Many researches have been carried out and results are available in the literature on generation of ground motion parameters based on the earthquake records. Tan [1] obtained response spectra from a set of simulated acceleration time histories generated based on evolutionary power spectrum, using 159 strong-motion records in Taiwan. A simulation technique for strong ground motion based on seismic hazard analysis for the Philippines was presented by Torregosa et al. [2]; using the database for historical earthquake occurrences from 1907 to 1998, ground motion time histories for major cities of Philippines were developed. Barranco-cicilia and Silva-ballesteros [3] developed a methodology to obtain ground motion time histories matching response spectra of seismic zones of Mexico City and compared with the real earthquake recorded in 1985. Ishii et al. [4] proposed a methodology for simulation of earthquake ground motion, for probabilistic risk assessment of structures, characterized by the parameters in terms of Peak ground acceleration, acceleration response spectra, and ground motion duration. Most of the researches carried out on generation of ground motion and reported in the literature are based on the historical earthquake records. The researches on ground motion applicable to regions with scanty or no earthquake records is not many.
In view of need to generate ground motion due to possible earthquakes in future specific to a region characterized by a long history of earthquake but with a limited record, a probabilistic method to simulate the ground motion is presented. In the method, probabilistic seismic hazard analysis is carried out to obtain the hazard curve, indicating the seismic hazard potential of a site. The hazard analysis is extended to determine the risk-consistent response spectra at the bedrock level using empirical relationship of spectral ordinate with earthquake magnitude and source-to-site distance. Risk-consistent acceleration time history is simulated from the power spectral density function based on the spectral shapes at the bedrock level. One-dimensional wave propagation analysis is carried out to estimate the soil sediment effect at the site for linear, as well as nonlinear conditions. Free field hazard curves and the ground motion parameters, especially the risk-consistent response spectra are obtained considering the soil amplification.
The proposed method is numerically illustrated by its application in generation of earthquake-induced ground motions for sites of Bhaktapur city, representing a typical area of Kathmandu Valley.
A probabilistic seismic hazard analysis is carried out to identify the seismic hazard potential of a site of interest. A seismic hazard curve, representing a relation between the seismic intensity parameter in terms of peak ground acceleration (PGA) and its annual probability of exceedance, can be used as basic information in estimation of seismic force on structures of the site of interest. The seismic hazard curve is obtained following the procedure outlined by Cornell [5] and Der Kiureghian and Ang [6]. The annual occurrence rate of the intensity parameter ‘A’ (PGA) exceeding a specified value ‘a’ for a particular site is obtained by
νA≥a=∑kνK∑j∑iPA≥amirjPKmiPKrjE1
Where PKmi and Pkrj represent the probability mass function of magnitude and distance from site to earthquake sources at the k−th zone, respectively. νK is the annual occurrence rate of earthquakes in the zone k. PA≥amirj is the conditional probability of ‘A’ exceeding ‘a’ given mi and rj.
The events of earthquake occurrence are assumed to be independent of each other in time and space, that is, Poisson’s process, and accordingly, the annual probability of exceedance is obtained by the relation
PA≥a=1−exp−νA≥aE2
Since the probability of occurrence of earthquakes of large magnitudes is very low, the distribution function for magnitude of earthquake is assumed to be a simple exponential distribution. The mean annual rate of exceedance of magnitude m is given by
λm=10a−bm=expα−βmE3
Where 10a is the mean yearly number of earthquakes greater than or equal to zero, and b describes the relative likelihood of large or small earthquakes. The probability density function (PDF) of the magnitude of earthquake is obtained by
PMm=βe−βm−m0E4
In which, β = 2.303b and m0 is the lower threshold magnitude of earthquake, earthquakes smaller than which are eliminated, and m is the magnitude of earthquake.
The risk-consistent response spectrum at the site of interest is developed for given interval of seismic intensity parameter for the purpose of seismic input values for response analysis of structures. Peak ground acceleration (PGA) is adopted as the seismic intensity parameter to obtain the risk-consistent response spectra, as was considered in the development of seismic hazard curve.
The risk-consistent response spectrum at the bedrock is obtained by an empirical relationship, which relates the normalized ordinates of response spectrum with the magnitude of earthquake and the source-to-site distance. The typical empirical attenuation equation of the spectral acceleration for the evaluation of spectral shape given by Takemura et al. [7] is:
lnSaT=aTM−bTlnX+cTE5
in which, SaT is the spectral acceleration at bedrock in cm/s2, M is the magnitude of earthquake, X is the source-to-site distance in km, T is the time period in second, and a (T), b(T) and c(T) are coefficients that are determined by regression analysis of earthquake motions and are given in the form of curves as shown in Figure 1. These values are valid for normalized response spectrum corrected to 2% damping.
Figure 1.
Variation of constants with time period.
The probabilistic estimation of the response spectra of ground motion is done by expanding the method to evaluate seismic hazard as described in Section 2. In the method, it is assumed that a normalized response spectrum normalized by its maximum acceleration SNT value is an empirically determined function of magnitude M and distance R (epicentral or hypocentral), and, as a second-order approximation that it is a log-normally distributed random variable. Accordingly,
SN∗=lnSNT=lnSNMRTE6
in which, T represents the natural period.
The conditional probability mass function of magnitude and distance given that the intensity parameter A (PGA in the case) is between a1 and a2 due to an earthquake event in the kth zone, denoted by Pkmirj/a1≺A≤a2 is given by
in which, Pkmi and Pkrj represent the probability mass functions of magnitude and distance from source-to-site distance at the kth zone, respectively. The conditional mean value of the natural logarithm of response spectrum for the kth zone is given by:
S¯NK∗=EkSN∗Ta1<A≤a2=∑j∑iSN∗mirjTPkmirja1<A≤a2E8
The conditional mean value, considering all seismic zones, is given by:
S¯NT=ESN∗Ta1<A≤a2=∑j∑iSN∗mirjTPkmirja1<A≤a2E9
Where νk represents the annual occurrence rate of earthquake in the k−th zone.
4. Power spectral density function of ground motion
A power spectral density function (PSDF) is obtained from the response spectrum using an empirical relationship derived by various investigators. Der Kiureghian [6] has proposed the following relationship to obtain the PSDF, which is adapted in the present method.
Sbω=ωp+2ωp+ωfp2ξωπ+4πτDωξpsω02,ω≥0E10
in which, ω is frequency in radians per second, τ is the duration of earthquake shaking and is taken as 15 sec, ps(ω)0 is the peak factor of white noise, and ωf and p are two constants, which can be obtained by iteration procedure. In the present study, the values ωf and p are taken as 0.705 and 3.0 as suggested by Der Kiureghian [6]. D(ω,ξ) is the ordinate of the risk-consistent response spectrum for displacement, and Sb(ω) is the PSDF of acceleration. The relationship given by Eq. 10 is ideally suited if the process is relatively broad-banded. If the process is narrow-banded, then suitable values of ωf and p are to be obtained by iteration procedure and the method of spectral analysis no more remains attractive.
In general, the earthquake ground motions for a site are generated based on the seismic ground motion characteristics provided from real earthquake records. It has been well recognized that in the absence of adequate earthquake records and paucity of such records generation of earthquake-induced ground motion time histories compatible with an elastic response spectrum, such as stipulated in practical codes, will be an acceptable procedure.
Considering the strongest earthquake ground motion as a stationary zero-mean random process with Gaussian distribution, and being expressed by a spectral density function Sb(ω), sample ground acceleration time histories v¨gt are obtained by using the spectral representation method proposed by Shinozuka and Deodatis [8]. The strong ground motion, in this method, is considered of a series of harmonic components, having deterministic amplitudes and random phase angles:
v¨gt=2∑n=1NAncosωnt+φnE11
where An is the amplitude of the harmonic component given by An=2SbωnΔω; ωn = nΔω is the frequency beyond which Sb(ω) can be considered zero, and φn are N independent random phase angles uniformly distributed between 0 and 2π. Thus, sample earthquake-like ground acceleration time histories, which are consistent with the risk considered, are simulated at the bedrock level.
The hazard curve and the risk-consistent ground motion parameters obtained for bedrock level are modified considering the soil sediment amplification effect to obtain the free field parameters at a site. For the purpose, site response analysis is essentially carried out by a one-dimensional wave propagation analysis (Figure 2). The soil profile above the bedrock is generally multilayered having different soil properties in each layer. For a certain input excitation at the bedrock level, some of these layers can undergo nonlinear excursion. The one-dimensional wave propagation analysis is carried out by numerical integration of the equation of motion in the incremental form for a prescribed time history of acceleration at the bedrock level [9].
Figure 2.
One-dimensional wave propagation analysis.
The PGA amplification due to the overlying soil is obtained considering two conditions, namely linear and nonlinear behavior of soil layers. The free field PGA is obtained by multiplying the PGA at the bedrock level by the PGA soil amplification factor. The conditional probability in Eq. (1) is then modified by considering the free field PGAs in place of bedrock PGAs to modify the bedrock seismic hazard curves into the free field hazard curves. The time history of the free field absolute ground acceleration is found by integrating the equation of motion for the soil layers subjected to the base acceleration for both linear and nonlinear conditions. The risk-consistent response spectrum of absolute acceleration at the free field is obtained from the free field time history of the absolute acceleration.
The application of the proposed method is illustrated by determining the site-dependent earthquake ground motion parameters for sites of Bhaktapur City, a typical region of Kathmandu Valley. Seismic hazard curves and risk-consistent ground motion parameters are determined for sites of the Bhaktapur City, which is surrounded by eight identified active faults as the earthquake sources.
7.1 Ground motion parameters at the bedrock level
The seismic hazard curve and the risk-consistent ground motion parameters at the bedrock level are computed for the center of the city because these values do not significantly vary across the length and breadth of the city due to not large dimension of the city. The important parameters for the calculation of the seismic hazard curve are shown in Table 1.
#
Active faults
Source-to-site distance (km)
Mean annual rate, νi
Value of coefficients
Probability density function of magnitude
Α
β
M5
M6
M7
M8
M9
1
MCT- 3.3
34.51
5.012
14.279
2.073
0.7365
0.0927
0.0117
0.0015
0.0002
2
HFF-1.13
53.33
1.585
11.976
2.303
0.7304
0.0720
0.0073
0.0007
0.0001
3
LH-4.10
60.12
5.012
14.279
2.073
0.7394
0.0931
0.0117
0.0015
0.0002
4
MBT- 2.5
66.66
1.585
11.976
2.303
0.7293
0.0729
0.0073
0.0007
0.0001
5
MBT- 2.4
95.55
1.585
11.976
2.303
0.7304
0.0730
0.0073
0.0007
0.0001
6
MBT- 2.6
142.22
1.585
11.976
2.303
0.7384
0.0728
0.0073
0.0007
0.0001
7
MBT- 2.3
180.15
1.585
11.976
2.303
0.7288
0.0729
0.0073
0.0007
0.0001
8
MBT- 2.7
230.09
1.585
11.976
2.303
0.7288
0.0729
0.0073
0.0007
0.0001
Table 1.
Seismic parameters of the earthquake sources (faults).
The same table also presents the seismic characteristics of the eight earthquake sources. The average rate of threshold magnitude exceedance for each of the potential earthquake sources is given, based on Eq. (3), by the following:
νi=expαi−βimoE12
in which, α = 2.303a and β = 2.303b, and.
mo = the lower threshold magnitude of earthquake, which is set to 4.5 in the study.
Since there is no attenuation law developed for the region due to scanty earthquake data, 24 various existing empirical attenuation relationships are used for calculation of the seismic intensity in terms of PGA at the bedrock level of Bhaktapur City. These 24 empirical attenuation laws, as described by Douglas [10] are by: 1. Taleb; 2. Donovan and Bornstein; 3. Donovan; 4. Esteva and Rosenblueth; 5. Davenport; 6. Merz and Cornell; 7. Cornell, Banon, and Shakal; 8. Battis; 9. Fukushima and Tanara; 10. Ambresseys and Bommer; 11. Tento, Franceschina and Marcellini; 12. McGuire; 13. Orphal and Lahoud; 14. Milne and Davenport; 15. Mickey; 16. Ohashi; 17. Joyner and Boore; 18. Sabetta and Pugliese; 19. Esteva and Villaverde; 20. Campbell; 21. Abrahamson and Litchiser; 22. Theodulidin and Papazachos; 23. Peng, Wu and Song (a); and 24. Peng, Wu and Song (b).
7.2 Hazard curve at the bedrock level
The seismic hazard curve for the center of Bhaktapur City at its bedrock level is constructed as described in Section 2, using the exponential function for PDF for earthquake magnitude, assuming earthquake occurrence as Poisson’s Process and adopting 24 available attenuation laws as described above. The hazard curve at the bedrock level is presented in Figure 3.
Figure 3.
Seismic hazard curve for the center of Bhaktapur City at the bedrock level.
7.3 Risk-consistent response spectrum (spectral shape)at the bedrock level
The normalized risk-consistent response spectrum (spectral shape) is obtained for this site using the empirical relationship between the magnitude of earthquake and the response spectrum ordinates given by Eq. (5). The values for coefficients a(T), b(T), and c(T) in the equation are taken from Takemura et al. [7] and are shown in Figure 1. The normalized acceleration response spectra for the site are obtained for six various PGA intervals and median values of which are 0.03, 0.08, 0.13, 0.18, 0.23, and 0.28 g, respectively. Thus obtained risk-consistent spectral shapes for the center of Bhaktapur City at the bedrock level are shown in Figure 4. As is seen from the figure, the shape of the acceleration response spectrum is not very sensitive to the PGA intervals.
Figure 4.
Risk-consistent response spectrum for the Center of Bhaktapur City at the bedrock level (for various PGA intervals).
7.4 Power spectral density function at the bedrock level
The risk-consistent power spectral density functions are obtained at the bedrock level for all PGA intervals from their respective risk-consistent response spectrum, using Eq. (10). The power spectral density function at the bedrock obtained from the risk-consistent response spectrum for a PGA value of 0.13 g is shown in Figure 5.
Figure 5.
Risk-consistent power spectral density function for the Center of Bhaktapur City at the bedrock level.
7.5 Sample time history of ground acceleration at the bedrock level
Figure 6 presents a sample time history of ground acceleration generated from the PSDF for PGA level 0.13 g at the bedrock level. Note that PGA value, as read from the time history, is nearly equal to 0.13 g. The frequency contents of the time history obtained by Fourier decomposition are shown in Figure 7. It is observed from the figure that the frequency contents are quite large within the frequency band, where PSDF has high ordinates, as it would be expected.
Figure 6.
Simulated time history of acceleration from the PSDF for the Center of Bhaktapur City at the bedrock level.
Figure 7.
Frequency contents of simulated time history of acceleration at the bedrock level of Bhaktapur City Center.
7.6 Local soil sediment effects
The soil properties of Bhaktapur City vary from one place to another, and accordingly, the soil sediment effect on the ground motion parameters would not be the same. Three different sites of Bhaktapur city with their soil profiles are considered to assess the effect of local soil conditions on the hazard curve and the risk-consistent ground parameters obtained for the bedrock level. The majority of the soil layers are either clay or sandy clay. In order to obtain the hazard curve and the site-dependent ground motion parameters at the top of each of the three sites, the risk-consistent time history of ground acceleration generated at the bedrock level is used as the input for carrying out site response analysis. One-dimensional wave propagation analysis is performed for both linear and nonlinear soil behaviors to obtain the time histories of the free field ground accelerations at the sites.
7.7 Free field ground motion parameters
The PGA amplification for the three sites when soil behavior is assumed to be linear, is shown in Table 2. Evidently, the PGA amplification substantially differs from one site to the other.
Site No.
Location
PGA amplification
1
Durbar Square, Khauma
2.67
2
Taumadhi Square
2.10
3
Salan Ganesh Square
1.92
Table 2.
PGA amplification for three typical sites (linear).
The free field seismic hazard curves constructed considering the PGA amplifications become different for the three sites. A typical hazard curve at the free field of the Site No.1 (Durbar Square, Khauma) is shown in Figure 8. The hazard curve at the bedrock level is also shown in the same figure. The figure indicates that the hazard curve for the free field provides significantly greater probabilities of exceedance of PGA values compared to the same for the bedrock.
Figure 8.
Typical seismic hazard curve (free field and at the bedrock level). at site No. 1 Durbar Square, Khauma.
The PGA amplification for two sites for different levels of PGA values when nonlinear behavior of the soil is taken into consideration, is presented in Table 3. It may be seen from the table that the PGA amplification decreases with the increase in the input PGA value. It is because the nonlinear effect becomes more for higher level of excitation resulting in more dissipation of energy within the soil mass. For higher values of PGA (0.28 g), the free field PGA may be deamplified (amplification less than one). It is noteworthy that the PGA amplification is independent of the PGA level at the bedrock for linear behavior of the soil and is much greater than that for nonlinear soil behavior for higher values of bedrock PGA. Thus, consideration of actual soil behavior in the determination of the free field ground motion is extremely important, especially for higher levels of PGA at the bedrock level. The effect of the nonlinear soil behavior on the free field hazard curve is shown in Figure 8 in which the hazard curves for linear and nonlinear soil behavior are compared. It is seen that the probability of exceedance is more for linear soil behavior and difference between the two increases for higher values of PGA.
PGA at Bedrock level
Sites
Site no. 1
Site No. 3
Durbar Square, Khauma
Salan Ganesh Square
0.03 g
2.40
2.02
0.08 g
1.87
1.89
0.13 g
1.28
1.23
0.18 g
1.03
1.12
0.23 g
1.02
1.11
0.28 g
0.87
0.97
Table 3.
PGA amplification for two typical sites (nonlinear).
Figure 9 presents the free field spectral shapes for the three sites when linear behavior of the soil is considered. It exhibits that even though the input bedrock spectral shape remains the same, the shapes of the risk-consistent response spectra can be significantly different from one site to the other. Comparison of Figures 4 and 9 shows that the peak of the risk-consistent spectrum at the free field may be significantly deviated from that at the bedrock level. This clearly shows that the input excitation to the structures may be significantly influenced by the soil conditions.
Figure 9.
Normalized risk-consistent response spectrum for free field absolute acceleration at three sites of Bhaktapur City (linear site response).
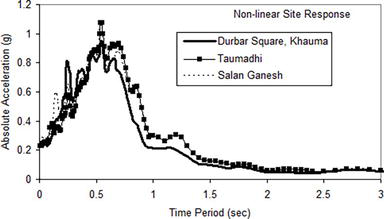
Figure 10 presents the risk-consistent spectral shapes for a PGA level 0.23 g for the same three sites when nonlinear behavior of soil is considered. It is again observed that the spectral shapes may significantly differ from one site to the other. Comparison of Figures 9 and 10 shows that the spectral coordinates are drastically reduced near the peaks when nonlinear soil behavior is taken into consideration.
Figure 10.
Normalized risk-consistent response spectrum for free field absolute acceleration at three sites of Bhaktapur City for PGA at bedrock = 0.23 g (nonlinear site response).
A probabilistic method is presented to generate seismic ground motions specific to sites, which are earthquake prone but do not have enough recorded data. The seismic hazard curves are developed from the probabilistic seismic hazard analysis considering available attenuation laws. The hazard analysis is expanded using empirical relationship for the spectral ordinate with the earthquake magnitude to find the risk-consistent spectral shapes at the bedrock level. Sample ground acceleration time histories are simulated from the risk-consistent power spectral density function at the bedrock using Monte Carlo technique. The seismic risk is incorporated by using conditional probability of occurrence of PGA for a particular magnitude of earthquake, derived from the set of available attenuation laws. Site response analysis is carried out by one-dimensional wave propagation analysis to modify the hazard curves and the risk-consistent ground motion parameters considering the local soil amplification effect. Both linear and nonlinear soil behaviors are considered. The methodology is illustrated by generating the hazard curves and the risk-consistent ground motion parameters for three different sites of Bhaktapur City surrounded by eight earthquake sources. The results of the study lead to the following conclusions:
The annual probabilities of exceedance of a PGA level at the bedrock level and at the free field are different. The degree of difference depends upon the soil condition.
The probability of exceedance of a PGA level denoted by the hazard curve is reduced when the nonlinear behavior of soil is considered; the reduction is prominent for higher levels of PGA.
The PGA amplification is much less for the nonlinear soil condition, and may even become less than one.
The risk-consistent normalized acceleration response spectrum at the bedrock level of the Bhaktapur City is relatively broad-banded.
The spectral shapes at the free field are significantly modified due to the soil effect.
The spectral shapes become broader banded when nonlinear behavior of soil is taken into consideration in comparison to those corresponding to linear soil behavior.
Modification in spectral shapes due to nonlinearity depends upon the PGA level at the bedrock. For higher levels of PGA, the effect of nonlinearity is more, the spectral shape becomes more broad-banded, and more reduction of spectral ordinates takes place near the peak.
References
1.Tan RY. Alternate methods for construction of design response Spectrum. Proceedings of Natural Science Council ROC(A). 1998;22(6):775-782
2.Torregosa RF, Sugito M, Nojima N. Strong motion simulation for the Philippines based on seismic hazard assessment. Journal of Natural Disaster Science. 2001;23(1):35-51
3.Barranco-Cicilia F, Silva-ballesteros J. Seismic ground motion signals from design spectrum for soft soil in Mexico City. In: Proceedings of the Twelfth World Conference on Earthquake Engineering. Auckland, New Zealand; 2000
4.Ishii K, Okumura T, Suzuki M. Earthquake ground motions consistent with probabilistic seismic hazard analysis. In: 5th International Conference on Structural Safety and Reliability. San Fransisco, CA; 1989
5.Cornell CA. Engineering seismic risk analysis. Bulletin of the Seismological Society of America. 1968;58(5):1583-1606
6.Der Kiureghian A, Ang AHS. A fault rupture model for seismic risk analysis. Bulletin of the Seismological Society of America. 1977;67(4):1173-1194
7.Takemura M, Ishida H, Amano A, Mizutani M. A seismic PRA procedure in Japan and its application to a building performance safety estimation part 1. Seismic hazard analysis. In: 5th International Conference on Structural Safety and Reliability. San Fransisco, CA; 1989
8.Shinozuka M, Deodatis G. Simulation of stochastic processes by spectral representation. Applied Mechanics Reviews. 1991;44(4):191-204
9.Kramer SL. Geotechnical Earthquake Engineering. New Jersey: Prentice Hall; 1996. pp. 254-280
10.Douglas J. Engineering seismology and earthquake engineering a comprehensive worldwide summary of strong-motion attenuation relationships for peak ground acceleration and spectral ordinates (1969 to 2000). In: ESEE Report No. 01–1, 2001. London: Imperial College of Science, Technology and Medicine; 2001
Written By
Prem Nath Maskey
Submitted: 18 September 2023Reviewed: 22 September 2023Published: 21 November 2023
 Open access peer-reviewed chapter