Open Access is an initiative that aims to make scientific research freely available to all. To date our community has made over 100 million downloads. It’s based on principles of collaboration, unobstructed discovery, and, most importantly, scientific progression. As PhD students, we found it difficult to access the research we needed, so we decided to create a new Open Access publisher that levels the playing field for scientists across the world. How? By making research easy to access, and puts the academic needs of the researchers before the business interests of publishers.
We are a community of more than 103,000 authors and editors from 3,291 institutions spanning 160 countries, including Nobel Prize winners and some of the world’s most-cited researchers. Publishing on IntechOpen allows authors to earn citations and find new collaborators, meaning more people see your work not only from your own field of study, but from other related fields too.
To purchase hard copies of this book, please contact the representative in India:
CBS Publishers & Distributors Pvt. Ltd.
www.cbspd.com
|
customercare@cbspd.com
The Pantanal is one of the largest wetlands in the world. This natural region has fundamental importance for water supply and biodiversity conservation. In this paper, we apply a methodology to analyze multi-temporal water and vegetation changes in six different zones of land use/land cover and their relationship with humidity in the Brazilian Pantanal subregion of Cáceres, Mato Grosso. Meteorological data from the INMET Station in Cáceres was used. The Normalized Difference Vegetation Index (NDVI) and Normalized Difference Moisture Index (NDMI) were compared year to year (2019, 2020, 2021). The spatial variations revealed water changes according to the occurrence of wet and dry years. In dry years there was a remarkable increase in mean and maximum values linearly related to a decrease in water availability. Analyzing LULC change dynamics in these areas is crucial for developing new proposals for interventions to monitor the area and thus provide subsidies to goal 15 of the 2030 Sustainable Development Agenda, which aims to stop and restore degradation caused in the environment and to promote reforestation.
Department of Geography and Planning, São Paulo State University, Ourinhos, Brazil
Natalia V. Revollo
Institute for Computer Science and Engineering Universidad Nacional del Sur - CONICET, Bahía Blanca, Argentina
Federico Javier Beron de la Puente
Department of Geography and Tourism, Universidad Nacional del Sur - UNS/CONICET, Bahía Blanca, Argentina
Veronica Gil
Department of Geography and Tourism, Universidad Nacional del Sur - UNS/CONICET, Bahía Blanca, Argentina
Sandra Mara Alves da Silva Neves
Faculty of Human Sciences/Geography Course, University of Mato Grosso State, Cáceres, Brazil
Paula Zapperi
Department of Geography and Tourism, Universidad Nacional del Sur - UNS/CONICET, Bahía Blanca, Argentina
*Address all correspondence to: edineia.galvanin@unesp.br
1. Introduction
The Pantanal is an extraordinary and diverse natural region located in South America. It stands as one of the largest continuous wetland areas on the planet, encompassing territories of Brazil, Bolivia, and Paraguay. The hotspot holds significant importance as it has been designated both a World Heritage Site and a Biosphere Reserve by UNESCO (2000).
Renowned for its abundant biodiversity and landscapes, the Pantanal hosts an impressive array of ecosystems, including savannahs, forests, rivers, lagoons, and marshes. This diversity of habitats attracts a wide range of wildlife. In addition to its incredible fauna, the Pantanal holds significant ecological importance [1]. Its floodplains “act as a natural sponge, absorbing large amounts of water during the rainy season and gradually releasing it during the dry season” [2]. The storage capacity of the rivers helps regulate the flow of water across the continent, which is essential for regional hydrological balance.
The Pantanal, however, faces many challenges. There are many threats to the ecosystem of this region including deforestation, fires, agricultural practices, and livestock farming [3].
Preserving the Pantanal and ensuring its sustainability is vital not just for conserving biodiversity but also for safeguarding water resources and the welfare of local communities. This research makes a significant contribution to advancing methods for detecting changes in land use, thereby facilitating studies that are in line with the objectives of the United Nations’ 2030 Agenda for Sustainable Development [4], particularly regarding the indicators of Goal 6, “Clean Water and Sanitation,” and Goal 13, “Action against global climate change.”
Understanding the dynamics of land use and land cover (LULC) changes, as well as their impact on humidity levels, are crucial in the field of environmental research. Remote sensing techniques play a significant role in studying and monitoring these changes over time. The application of advanced remote sensing technologies and methodologies enables us to capture and analyze spatial and temporal patterns of LULC changes [5], providing valuable insights into the processes driving these transformations.
The integration of remote sensing with geographic information systems (GIS) Normalized Difference Vegetation Index (NDVI), and Normalized Difference Moisture Index (NDMI) enhances our ability to accurately identify and classify LULC changes. With this multidisciplinary approach, it is possible to develop robust models and predictive frameworks that can be applied to evaluating the impacts of land use adjustments on humidity patterns across a spectrum of scales, from local to regional. This knowledge is crucial for sustainable land management, water resource planning, and climate change adaptation measures.
This paper presents a methodology for analyzing multi-temporal land use/land cover changes and their relationship with humidity in the Cáceres Pantanal.
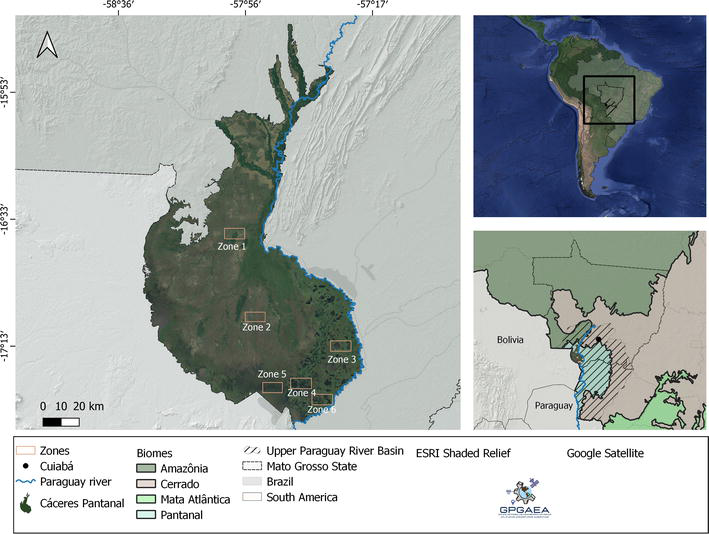
The Cáceres Pantanal occupies a privileged position among the sub-regions of the Pantanal biome’s wetland plain, situated in the Upper Paraguay River Basin [6], in Brazil’s Central-West region (Figure 1). It encompasses a diverse mosaic of savanna vegetation, including wooded Savanna, forested Savanna, woody-grass Savanna, as well as alluvial Forest [7], providing a habitat for a wide array of species uniquely adapted to the dynamic floodplain ecosystem [8]. Its altitude ranges from 90 to 150 meters [9, 10]. The Pantanal is primarily composed of Quaternary sediments that have accumulated over time.
Figure 1.
Study area: Cáceres Pantanal.
The Upper Paraguay River Basin region is characterized by two primary aquifers: the Pantanal Aquifer (Quaternary) and the Guarani Aquifer (Jurassic-Triassic). While the waters from the Pantanal Aquifer drain into the Paraguay River, the deeper waters of the Guarani Aquifer flow towards the Paraná Basin [11].
In the Cáceres Pantanal region, the predominant soils are Plinthosols, Plinthosols, and Quartzarenic Neosols, influenced by hydromorphic processes [12]. The average annual temperature in the Cáceres Pantanal is 26.24°C, with an annual rainfall index of 1335.00 mm [13, 14]. The Pantanal exhibits two distinct ecohydrological cycles: the dry season occurs from May to September and the rainy season spans from October to April, during this time, the region receives a substantial amount of precipitation, typically accounting for 70–80% of the total annual rainfall [13]. During the dry season, surface water becomes scarce and is mostly limited to perennial rivers with well-defined beds and large ponds [15].
2.2 Data pre-processing
Initially, we divided the Pantanal into six regions based on their morphological features (Figure 1). The six zones consist of mosaics, with Zone 1 comprising forested Savanna, woody-grass Savanna, and pioneer Formation. Zone 2 comprises wooded Savanna, woody-grass Savanna, and pioneer Formation. Zones 3, 4, 5, and 6 are characterized by bodies of water, vegetation influenced by rivers and/or lakes, and woody-grass Savanna. Zones 1 and 2 are located within the so-called seasonally inundated areas, while zones 3, 4, 5, and 6 belong to the frequently flooded and permanently flooded-hydromorphic zones [16].
The meteorological data used in this study were collected from the Meteorological Station of the National Institute of Meteorology (INMET) in Cáceres (code 01657000). This station is located at the Federal Institute of Mato Grosso (IFMT) at - 16° 13’ S -57° 69’ W. For analysis, basic descriptive values were obtained for temperature, evapotranspiration, and relative humidity (sum, average) for monthly and seasonal (rainy season) values.
To enhance the knowledge of the Pantanal wetland dynamic, the study incorporated meteorological data and the Standardized Precipitation Evapotranspiration Index (SPEI) to assess the presence of drought periods occurring between 2018 and 2021. The data was obtained at a 12-month scale (SPEI 12) from the global model SPEI Global Drought Monitor and downloaded with a spatial resolution of 1° [17].
To calculate the SPEI, monthly mean temperature data were obtained from the NOAA NCEP CPC GHCN_CAMS gridded dataset [18]. Additionally, cumulative monthly precipitation data were sourced from the Global Precipitation Climatology Centre global model [19]. The SPEI Global Drought Monitor estimates reference evapotranspiration using the Thornthwaite method [20].
The SPEI time series were analyzed in conjunction with data from the weather station. The 12-month scale allows the identification of areas and time intervals with persistent drought conditions [21, 22]. According to the categorization of SPEI values, a dry event occurs when values are less than −0.5, initiating drought. As values decrease, the magnitude of the drought increases. A drought event where the category is moderately dry takes values between −1 and − 1.5, while very dry is values between −1.5 and − 2 and a drought magnitude of extremely dry is when the results are less than −2 [22].
The multispectral images from the Sentinel-2A satellite were acquired through the Earth Engine Catalog. The dataset comprises a total of eighteen images, with six images captured during each rainy season spanning from October 2018 to March 2019, October 2019 to March 2020, and October 2020 to March 2021, respectively. Each image represents the mean image of the rainy period, with a filtering process applied to exclude cloudy pixels, ensuring that they account for less than 10% of the image. Considering the annual weather variability in the Pantanal, we have selected the pre-fire images from 2018, as well as the post-fire images from 2020 and 2021.
In order to evaluate the green vegetation in the Pantanal regions, we employed the normalized difference vegetation index (NDVI). The NDVI is a widely used metric for quantifying the health and density of vegetation using satellite data. It is calculated by taking the normalized difference between the reflectance values in the red and near-infrared bands. The red band measures the amount of light reflected by vegetation in the visible red spectrum, while the near-infrared band captures the sunlight reflected by chlorophyll in plants in the near-infrared spectrum.
NDVI=NIR−RedNIR+RedE1
For detecting moisture levels in the vegetation, we obtain the Normalized Difference Moisture Index (NDMI). This allows the combination of the near-infrared (NIR) and shortwave infrared (SWIR) spectral bands [23]. The SWIR bands depend on the changes in the vegetation water content and the spongy mesophyll structure of plant canopies [24]. Values between −1 to −0.4 indicate absent or very low ground vegetation cover, while values from −0.4 to 0.4 show different ranges of water stress, and values above 0.4 to 1 represent high-density cover with no water stress.
NDMI=NIR−SWIRNIR+SWIRE2
To qualitatively analyze the changes in NDVI, a multi-temporal color composite image was generated. This technique combines the NDVI values from period 1, period 2, and period 3 into the red, green, and blue channels, respectively, based on the temporal order. This approach is commonly used to visualize and analyze temporal dynamics, such as land cover changes, over a specific period.
In the composite image, high values of vegetation in one period are represented by red, green, or blue colors. Gray levels indicate features that remain stable across all periods. The absence of vegetation in all periods is represented by the black color. Regions with high vegetation values in two periods are indicated by a combination of yellow, cyan, or magenta colors. Situations, where the presence or absence of vegetation differs, are represented by the magenta and green colors. This approach enables a visual expert assessment of temporal changes in vegetation density and distribution, facilitating the identification of areas with consistent vegetation patterns, changes, or absence throughout the analyzed periods.
A linear regression trend analysis was conducted to assess NDVI evolution during the years 2018, 2019, 2020, and 2021. The analysis treated NDVI as the dependent variable and time as the independent variable. The regression model estimated the slope coefficients of the regression line, which provide insights into the trend of NDVI over time. By examining the slope of the regression line, it is possible to determine whether NDVI is increasing or decreasing. A positive slope indicates an increasing trend in NDVI, suggesting a rise in vegetation density or health. Conversely, a negative slope indicates a decreasing trend, indicating a decline in vegetation density or health. The input data for the regression model consisted of monthly NDVI images, with cloudy pixels filtered out. These NDVI images were organized as a two-band input image, with the first band representing the NDVI values and the second band representing the corresponding time information.
To apply the workflow, we used the geospatial processing service Google Earth Engine (GEE). The algorithms and the fit model were implemented using the Earth Engine (EE) Code Editor, a web-based IDE for the Earth Engine JavaScript API.
The Pantanal region is of great significance due to its distinctive ecological characteristics and high vulnerability to climate change. Understanding the rainfall variability, temperature fluctuations, and hydrological dynamics, is essential for predicting and managing the impacts of climate change on the Pantanal’s delicate balance.
In terms of precipitation, it is observed that for the period 2018–2021, the peaks of maximum accumulated monthly precipitation are found in the wet season, which is between the months of October to April. It is to be recognized that climatically a variation of rainfall can be found in the wet season although there are certain months where the monthly amounts usually exceed 80 mm, coinciding with the results of the 1971–2009 time series [25]. While the dry season is between the months of June to September, where monthly amounts do not usually exceed 10 mm per month.
On the other hand, if we talk about the average temperatures in the study area, they do not fall below 20°C and the maximum temperature peaks are found precisely at the beginning of the wet season, reaching 30°C. In contrast, the average monthly humidity percentage shows that the minimum peaks are distributed just before the beginning of the rainy season. Finally, evapotranspiration peaks coincidentally at the beginning of the rainy season (September–October) and its lowest values in the dry season months.
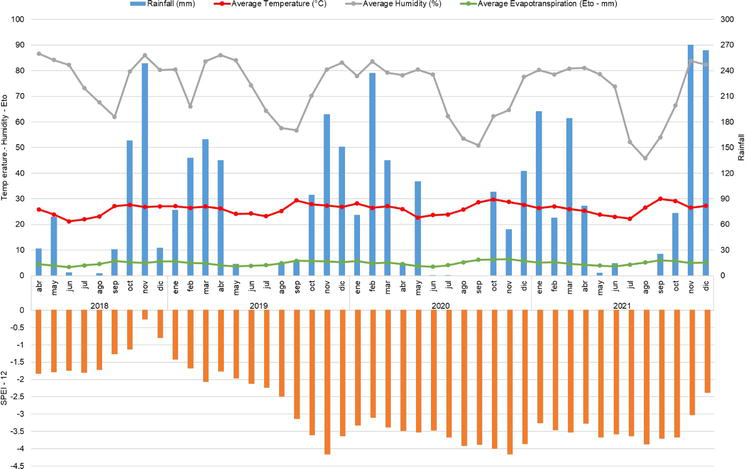
In Figure 2, it is evident that most of the studied period, which spans from 2018 to 2021, was characterized by an extremely dry drought regime (SPEI value less than −2). This prolonged drought event persisted from June 2019 until the end of the climate data in December 2021, encompassing approximately 71% of the time series. Specifically, 18% of the months were classified as experiencing a very dry drought, 7% as moderately dry, and 2% as an incipient drought or a normal event.
Figure 2.
Annual distribution of the climatic variables (top). SPEI -12 values for the period (bottom).
By the other hand, the variations observed in precipitation may indicate the influence of climatic anomalies like El Niño-Southern Oscillation (ENSO), which can impact indirectly in the superficial hydrological regime of the Pantanal. The Oceanic Niño Index (ONI) is a primary indicator for monitoring the sea surface temperature (SST) of the equatorial Pacific Ocean part of the seasonal climate pattern. The NOAA’s Climate Prediction Center monitoring system calculates them historically [26]. The ONI anomaly values for the period show that the SST anomaly was negative at the beginning of 2018 and during the period from 2021 to the end of 2022. From the end of 2018 to mid-2019 the SST anomaly was positive. This could be indicative of the fluctuations in precipitation shown in Figure 2.
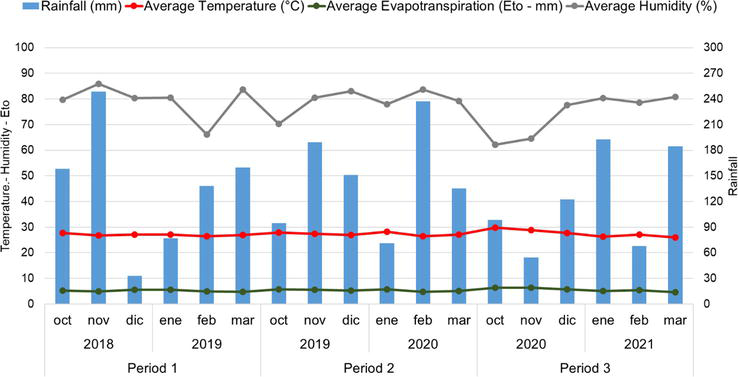
Figure 3 focuses on the monthly values of rainy seasons between 2018 and 2021. Their values remain relatively stable without significant variation. However, precipitation exhibits the most significant fluctuations, with relative humidity values following these changes.
Figure 3.
Time slices detailing the rainy season.
Table 1 presents the average values (Temperature, Evapotranspiration, and Humidity) and the accumulated Rainfall for each rainy season, confirming the findings mentioned in the previous paragraph. Additionally, an interesting observation can be made for the three periods: as the accumulated precipitation decreases, the mean values and standard deviations of the other variables tend to increase.
Period
Rainfall (mm)
Average Temperature (°C)
Average Humidity (%)
Average Evapotranspiration (Eto - mm)
1) 10/2018 to 3/2019
814.6
27.0 +/− 1.27
79.6 +/− 8.21
5.2 +/− 0.81
2) 10/2019 to 3/2020
878.4
27.3 +/− 1.56
79.1 +/− 7.11
5.4 +/− 0.86
3) 10/2020 to 3/2021
720.4
27.6 +/− 2.03
90.9 +/− 11.22
5.6 +/−1.12
Table 1.
Variability of meteorological data in the Pantanal of Cáceres: October 2018 to march 2019.
During the final period, a noteworthy decline in rainfall occurred. It is worth noting that this reduction can be attributed to the decreased transport of warm and humid air from Amazonia into the Pantanal. Notably, a substantial atmospheric shift took place during this period, characterized by the prevailing influence of warmer and drier air masses originating from subtropical latitudes. According to [27] this shift resulted in a considerable decrease in summer rainfall, particularly during the peak of the monsoon season. These changes in atmospheric conditions hold implications for the Pantanal’s hydrological dynamics and overall climate patterns.
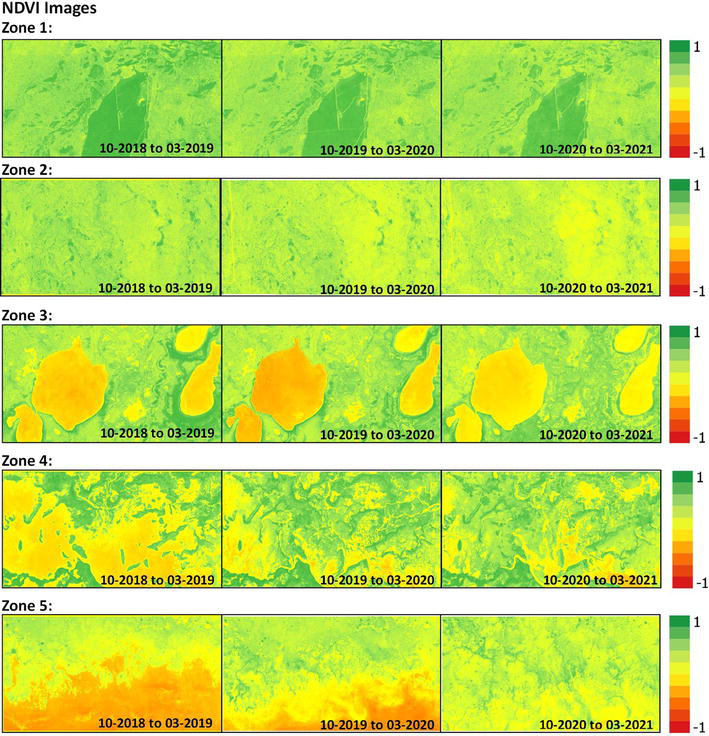
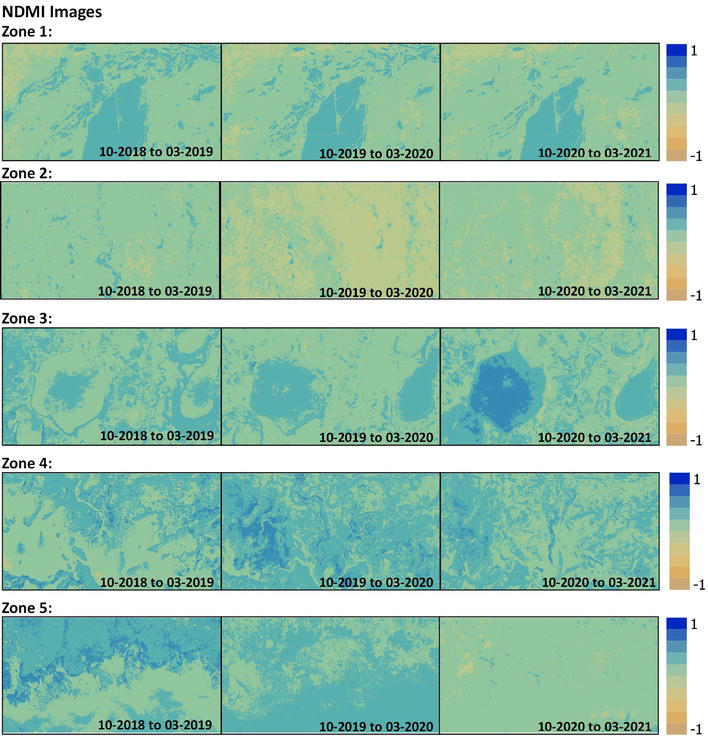
To analyze the vegetation and humidity in the Pantanal region, we computed and gathered NDVI and NDMI images during the rainy periods for selected zones. These images were compiled into a multi-temporal map, covering the period from 2018 to 2021, for each specific region (Figures 4 and 5).
Figure 4.
NDVI multi-temporal map covering the period from 2018 to 2021, for each zone.
Figure 5.
NDMI multi-temporal map covering the period from 2018 to 2021, for each region.
The multi-temporal map visually represents the changes in NDVI and NDMI values across various regions of the Pantanal throughout the specified period. The NDVI map indicates a stable vegetation density and health in the seasonally inundated areas, specifically in Zone 1 and Zone 2. The lowest NDVI values are observed in the flooded zones during period 1 and 2. However, period 3 exhibits the highest NDVI values, coinciding with the peak humidity level of 90.9%.
It is notable that the seasonally inundated areas (zones 1 and zone 2) have shown a decrease in the NDMI index over the last two years. The lowest values were observed in period 2 for zone 2, which coincided with the lowest average humidity of 79.1% recorded by the in-situ station. Zone 4 exhibited the highest NDMI values during period 2, which can be attributed to the hydromorphic features of the area. This coincides with the fact that period 2 also had the highest recorded precipitation values. In the frequently flooded and permanently flooded-hydromorphic zones, the maximum NDMI values are observed in zone 3 and zone 6 during period 3. This coincides with the highest recorded humidity values at the in-situ station location.
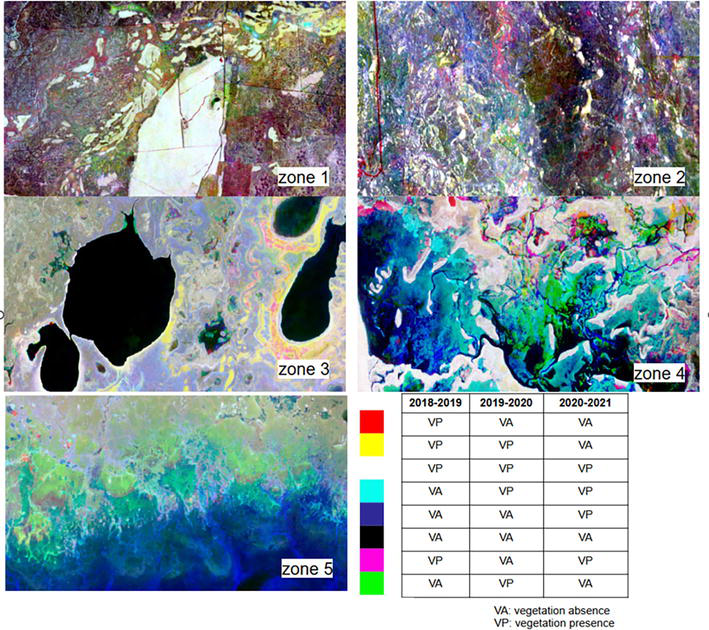
The multi-temporal images, generated by combining the NDVI index from the three different periods, are shown in Figure 6. The color scale on the images indicates the presence of vegetation in one, both, none, or all of the periods. By examining the images and referring to the color table, it is possible to quantitatively assess the fluctuations of vegetation across the six zones.
Figure 6.
Multi-temporal image created by combining the NDVI index from three different periods: Period 1, period 2, and period 3. The color scale used in the image indicates the presence or absence of vegetation.
Zones 1 and 2 are represented by a significant portion of magenta-colored pixels in the image, indicating the presence of vegetation during periods 1 and 3, but the absence of vegetation in period 2. Zone 3 exhibits a lack of vegetation, which corresponds with the presence of prominent lakes in the area. Along the edges of these lakes, yellow-colored pixels appear, suggesting the absence of vegetation in recent periods. However, some areas along the lake edges show signs of vegetation presence.
Zones 4 and 5 display pixels in blue and cyan, indicating an increase in vegetation. These zones demonstrate a variety of color combinations, which signifies their dynamic nature, particularly in relation to the permanently flooded areas. Zone 5, located near the lake, exhibits a distinct pattern of vegetation along the perimeter of the lake. This pattern may indicate sediment deposition from the adjacent plateau areas, which contributes to the presence of vegetation in that specific zone.
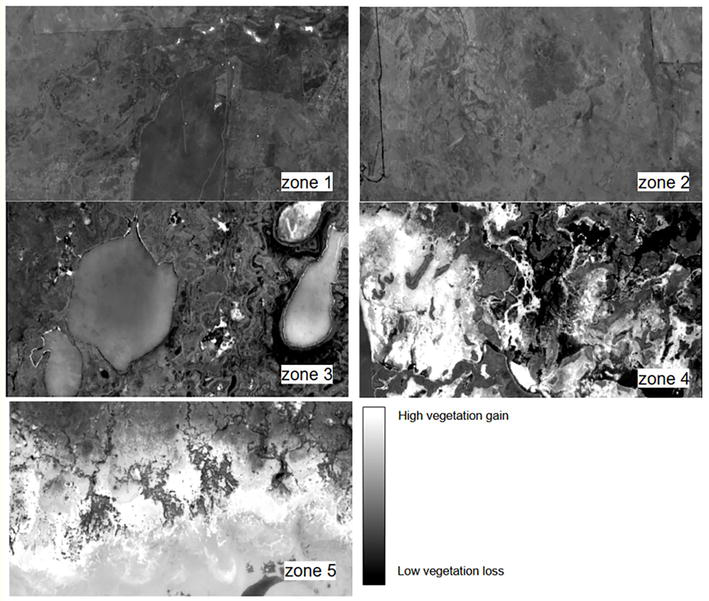
In Figure 7, Zones 4 and 5 exhibited substantial growth in vegetation, which can be attributed to the enhanced sediment transport by the tributaries from the plateau region in these areas [28]. This sediment deposition has played a vital role in expanding vegetation cover and reducing water volume, considering that these zones experience frequent or permanent flooding. Conversely, zones 1, 2, and 3 visually showed minimal vegetation loss. Zones 1 and 2 are seasonally flooded areas.
Figure 7.
NDVI slope image provides insights into the trend of vegetation density or health (represented by a trend towards white). On the other hand, a negative slope indicates a decreasing trend in NDVI (represented by a trend towards black).
Understanding the impact of flooded areas is crucial as any decrease in the Pantanal’s flooded areas can have significant consequences for the region’s unique ecosystem and biodiversity. It can result in the loss of crucial habitats for aquatic species such as fish, amphibians, and water-dependent plants, disrupting their survival and overall ecological balance. Preserving the flooded areas is essential for maintaining the delicate equilibrium of the Pantanal [27, 28].
Furthermore, the decline in flooded areas can disrupt the natural water cycle and hydrological processes in the Pantanal. It may result in decreased water availability for wildlife, impacting their feeding and breeding patterns.
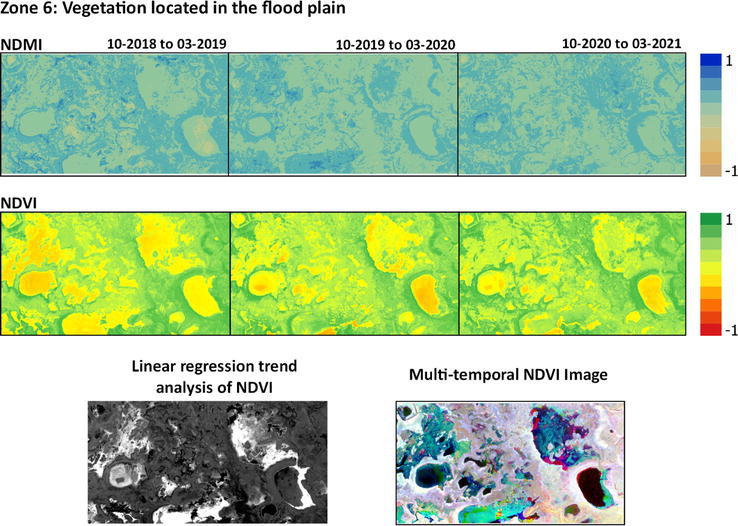
Figure 8 summarizes the results of the methodology applied in zone 6, which is characterized by frequently flooded and permanently flooded-hydromorphic zones. The multi-temporal map of NDMI and NDVI, along with the multi-temporal and NDVI slope images, provided valuable information for analyzing the dynamics of vegetation and water in the area.
Figure 8.
Vegetation and humidity patterns using NDMI, and NDVI.
The NDVI values for the last period indicated an increase in vegetation cover, suggesting a potential improvement in plant growth and density. Conversely, the NDMI values demonstrated a decrease in water presence, indicating a reduction in moisture levels within the studied regions, particularly during the peak of the monsoon season (Figure 8). A study conducted by [28] used the NDVI to compare monthly precipitation and water table depth. The study demonstrated a correlation between higher absolute NDVI values with wet years, during which a greater extent of woody vegetation covered the area [29]. While the study focused on a different environment from the Pantanal, the prevalence of vegetation remains consistent, allowing NDVI values to serve as an indicator of water in the soil.
In the second period (2019–2020) most of the NDMI values indicate water stress. However, this is not reflected in the NDVI, where vegetation coverage/density increases (showing more positive values) from the first period (2020–2021) to the second period. In the third period, the water stress measured by NDMI decreases, and there is an increase in vegetation gain according to the NDVI. In this particular zone, the vegetation is influenced by rivers and/or lakes and belongs to the frequently flooded and permanently flooded-hydromorphic zones. The findings appear to have been an imbalance in the water balance during the first period due to the prevailing conditions of rainfall, temperature, humidity, and evapotranspiration. This led to water stress in the second period, with a subsequent “recovery” observed in the third period.
This paper presents a methodology for analyzing multi-temporal land use/land cover changes and their relationship with humidity in the Caceres Pantanal. The analysis reveals that the studied period in the Caceres Pantanal was predominantly characterized by an extremely dry drought regime. As the accumulated precipitation decreases for each period, both the mean and standard deviation exhibit an increasing trend. This indicates a noticeable impact on the overall variability and average values of rainfall during these specific periods. These results emphasize the importance of considering the variability and potential consequences of reduced rainfall seasons when studying the climate dynamics in the analyzed area.
The multi-temporal maps of NDMI and NDVI, along with the multi-temporal and slope images, demonstrate the importance of satellite data processing methodologies for analyzing the dynamics of land use/land cover (LULC) changes and their impact on humidity in the Brazilian Pantanal. This region remains largely pristine, and its ecological integrity is intricately linked to its hydrology. The methodology provides information to qualitatively analyze the dynamics of an interested region. All of this is achieved through the availability of data and processing tools offered by the GEE platform.
Analyzing land use change dynamics in these areas is crucial for developing new proposals for interventions to monitor the area and thus provide subsidies to goal 15 of the 2030 Sustainable Development Agenda, which aims to stop and restore degradation caused in the environment and to promote reforestation.
The alteration in flooded areas can influence the overall climate of the Pantanal. Wetlands play a crucial role in regulating temperature, humidity, and precipitation patterns. A decrease in flooded areas may disrupt these natural climate regulation mechanisms, leading to changes in local weather patterns and potentially affecting neighboring regions.
The findings of this study contribute to a better understanding of the Pantanal’s hydrological dynamics and provide information for sustainable land management and conservation efforts in the region. Further research and monitoring are necessary to assess the long-term implications of LULC changes and develop effective strategies for preserving the ecological integrity of the Pantanal.
1.Brasil. Ministério do Meio Ambiente. Convenção de Ramsar. 2008. Available from: http://www.mma.gov.br/biodiversidade/biodiversidade-aquatica/zonas-umidasconvencao-de-ramsar
2.Wantzen KM et al. Towards a sustainable management concept for ecosystem services of the Pantanal wetland. Ecohydrology & Hydrobiology. 2008;8:115-138
3.Berlinck LCN et al. The Pantanal is on fire and only a sustainable agenda can save the largest wetland in the world. Brazilian Journal of Biology. 2022;82. DOI: 10.1590/1519-6984.244200
4.Nações Unidas no Brasil ONU BR: The Agenda 2030. Available from: https://nacoesunidas.org/pos2015/agenda2030/ [Accessed: June 20, 2023]
5.Lu D, Li G, Moran E, Hetrick S. Spatiotemporal analysis of land use and land cover change in the Brazilian Amazon. International Journal of Remote Sensing. 2013;34:5953-5978
6.Silva JSV, Abdon MM. Delimitação do Pantanal brasileiro e suas sub-regiões. Pesquisa Agropecuária Brasileira. 1998, Brasília;33(Número Especial):1703-1711
7.IBGE Instituto Brasileiro de Geografia e Estatística. Manual Técnico de Uso da Terra. 3nd ed. Rio de Janeiro: IBGE; 2013
8.Tomas WM, Oliveira RF, Morato RG, Medici PE, Chiaravalloti R, Tortato F, et al. Sustainability agenda for the Pantanal wetland: Perspectives on a collaborative interface for science, policy, and decision-making. Tropical Conservation Science. 2019;12:1940082919872634
9.Girard P, da Silva CJ, Abdon M. River–groundwater interactions in the Brazilian Pantanal. The case of the Cuiabá River. Journal of Hydrology. 2003;283(1–4):57-66
10.Alho CJR, Silva JSV. Effects of severe floods and droughts on wildlife of the Pantanal wetland (Brazil) - A review. Animals. 2012;2(4):591-610
11.ANA - Agência Nacional de Águas. Strategic Action Program for the Integrated Management of the Pantanal and the Upper Paraguay River Basin. Brasilia, DF: ANA/GEF/PNUMA/OEA; 2005. p. 315
12.Embrapa. Centro Nacional de Pesquisa de Solos (Rio de Janeiro, RJ). Sistema Brasileiro de Classificação de solos. 2nd ed. Rio de Janeiro: EMBRAPA-SPI; 2006
13.Brasil Ministério do Meio Ambiente. Biomas. Pantanal: Fauna e Flora; 2007
14.Dallacort R, Neves SMAS, Nunes MCMN. Variabilidade da temperatura e das chuvas de Cáceres/Pantanal Mato-Grossense - Brasil. Geografia. 2014;23(1):21-33
15.Alho CJR, Sabino J. A conservation agenda for the Pantanal’s biodiversity. Brazilian Journal of Biology. 2011;71:327-335
16.EAS G, CBM C, Vicens RS, MHX P, SMAS N. Study of the floodflow dynamics in the Pantanal of cáceres/MT. In: Proceedings of the 3rd International Conference on Geographical Information Systems Theory, Applications and Management (GISTAM 2017). Porto: SCITEPRESS – Science and Technology Publications; 2017. pp. 195-200. ISBN: 978-989-758-252-3
17.Standardised Precipitation-Evapotranspiration Index. Available from: https://spei.csic.es/index.html. [Accessed: July 07, 2023]
18.National Oceanic and Atmospheric Administration (NOAA). Available from: https://www.noaa.gov/. [Accessed: July 03, 2023]
19.Global Precipitation Climatology Centre (GPCC). Available from: https://psl.noaa.gov/data/gridded/data.gpcc.html. [Accessed: July 02, 2023]
20.Thorntwaite CW. An approach toward a rational classification of climate. Geographical Review. 1948;38:55-94
21.McKee TB, Doesken NJ, Kleist J. The relationship of drought frequency and duration to time scales. In: 8th Conference on Applied Climatology. Boston: Am. Meteorol. Soc; 1993. pp. 179-184
22.Vicente-Serrano SM, Beguería S, López-Moreno JI. A multiscalar drought index sensitive to global warming: The standardized precipitation evapotranspiration index. Journal of Climate. 2010;23(7):1696-1718. DOI: 10.1175/2009JCLI2909.1
23.Gao B. NDWI—A normalized difference water index for remote sensing of vegetation liquid water from space. Remote Sensing of Environment. 1996;58(3):257-266. DOI: 10.1016/s0034-4257(96)00067-3
24.European Drought Observatory. Available from: https://edo.jrc.ec.europa.eu/. [Accessed: July 12, 2023]
25.Neves SMAS, Nunes MCM, Neves RJ. Caracterização das Condições Climáticas de Cáceres/Mt-Brasil, No Período de 1971 a 2009: Subsídio às Atividades Agropecuárias e Turísticas Municipais. Boletim Goiano de Geografia, Goiânia. 2011;31(2):55-68. DOI: 10.5216/bgg.V31i2.16845
26.Climate Prediction Center. Available from: https://origin.cpc.ncep.noaa.gov/products/analysis_monitoring/ensostuff/ONI_v5.php. [Accessed: July 01, 2023]
27.Marengo JA et al. Extreme drought in the Brazilian Pantanal in 2019–2020: Characterization, causes, and impacts. Frontiers in Water. 2021;3:639204. DOI: 10.3389/frwa.2021.639204
28.Alho CJR. Biodiversidade do Pantanal: Resposta ao regime sazonal de enchente e à degradação ambiental. Brazilian Journal of Biology. 2008;68(4 suppl):957-966. DOI: 10.1590/S1519-69842008000500005
29.Aguilar C, Zinnert JC, Polo MJ, Young DR. NDVI as an indicator for changes in water availability to woody vegetation. Ecological Indicators. 2012;23:290-300
Written By
Edinéia A.S. Galvanin, Natalia V. Revollo, Federico Javier Beron de la Puente, Veronica Gil, Sandra Mara Alves da Silva Neves and Paula Zapperi
Submitted: 17 July 2023Reviewed: 22 July 2023Published: 28 August 2023
 Open access peer-reviewed chapter