Open Access is an initiative that aims to make scientific research freely available to all. To date our community has made over 100 million downloads. It’s based on principles of collaboration, unobstructed discovery, and, most importantly, scientific progression. As PhD students, we found it difficult to access the research we needed, so we decided to create a new Open Access publisher that levels the playing field for scientists across the world. How? By making research easy to access, and puts the academic needs of the researchers before the business interests of publishers.
We are a community of more than 103,000 authors and editors from 3,291 institutions spanning 160 countries, including Nobel Prize winners and some of the world’s most-cited researchers. Publishing on IntechOpen allows authors to earn citations and find new collaborators, meaning more people see your work not only from your own field of study, but from other related fields too.
To purchase hard copies of this book, please contact the representative in India:
CBS Publishers & Distributors Pvt. Ltd.
www.cbspd.com
|
customercare@cbspd.com
In the field of plant conservation, it has become increasingly important to incorporate advancements to make informed decisions and effectively monitor the situation. This chapter focuses on the use of the Normalized Difference Vegetation Index (NDVI), a tool derived from satellite observations like Landsat 8/9 and the Moderate Resolution Imaging Spectroradiometer (MODIS) to estimate the Leaf Area Index (LAI) of rice, a staple crop. The LAI, which indicates the amount of leaf surface area for photosynthesis, plays a role in determining crop yield and overall health. By utilizing NDVI for LAI estimation we can monitor rice crops on a scale without methods enabling early detection of potential threats or deficiencies. Moreover, this chapter highlights how integrating satellite-based sensing into plant conservation education holds potential for advancing our understanding and practices in this field. While the focus remains on rice, the principles and techniques elucidated have broader implications, making them adaptable to diverse crops and vegetation types. As plant diversity continues to face challenges from various anthropogenic factors, leveraging technological tools like NDVI becomes indispensable. This chapter emphasizes the intersection of technology and conservation, offering insights into novel methodologies that hold promise for the future of plant diversity and conservation education.
Symbiosis International (Deemed University), Pune, India
Kiyoshi Honda
Chubu University, Aichi, Japan
*Address all correspondence to: rushikeshk@sitpune.edu.in
1. Introduction
Plant conservation is a critical global issue that has been garnering significant attention in recent years [1]. The world’s ecosystems, whether terrestrial, aquatic, or marine, hinge on the variety and vitality of plant species [2]. As primary producers, plants form the base of food chains, driving ecosystem functions and providing services that are indispensable for human survival. Hence, it is imperative to have a comprehensive understanding of plant diversity and its conservation status.
Tragically, the planet has been witnessing an alarming loss of plant diversity [3]. A myriad of factors, including habitat destruction, overexploitation, pollution, and climate change, have led to the extinction of numerous plant species, with many more teetering on the brink [4]. This is a loss especially when we consider the roles that plants play in capturing carbon, producing oxygen, stabilizing soil, and purifying water.
Considering the importance of preserving plants, observing and monitoring crops becomes extremely important. This helps in identifying any signs of stress caused by diseases, pests, or environmental factors allowing for intervention to minimize harm. In addition, crop monitoring plays a role, in maximizing resource utilization, improving crop yields, and ultimately ensuring food security.
The progress in technology has accelerated the progress of crop monitoring based on sensing [5]. This includes using satellite and aerial images to keep an eye on the growth well-being and productivity of crops. Remote sensing offers an invasive way to collect up-to-date information across vast areas making it an extremely valuable tool for monitoring crops.
Vegetation indices play a role in monitoring crops using remote sensing. Two important indices are the Normalized Difference Vegetation Index (NDVI) and the Leaf Area Index (LAI). These indices utilize the reflectance values of types of radiation to gain insights into the health and vitality of crops. NDVI for example measures the greenness of vegetation. It is commonly used to evaluate plant health, growth stage, and biomass. On the other hand, LAI quantifies the amount of leaf material in crops, giving an indication of photosynthesis and overall yield.
When we consider the context of ‘Methodologies, for Teaching Plant Diversity and Conservation Status’ we can see that it’s crucial to include techniques such as remote sensing and the utilization of vegetation indices in comprehensive plant conservation education. It’s not only about grasping the aspects of plant diversity and conservation but also about applying contemporary technologies and methodologies for practical real-world purposes.
By incorporating these techniques into the curriculum we can provide the upcoming generation of conservationists, farmers, and environmentalists with the necessary skills and knowledge to effectively monitor, safeguard, and preserve the diverse range of plant species, in our world [6]. Moreover, comprehending and utilizing these approaches will empower them to maximize resource utilization, improve productivity, and make significant contributions towards global food security. Ultimately teaching these methodologies is a part of an education on plant diversity and its conservation status.
In the field of plant conservation, it has become clear that relying on methods is not enough to fully grasp the complex relationships found in diverse ecosystems [7]. The introduction of Remote Sensing technologies has brought about a change in our approach allowing us to have a ranging perspective of vast landscapes and the intricate interactions between different plants. Specifically Vegetation Indices like NDVI serve as indicators by translating data from satellites into metrics that reflect the health and vitality of vegetation [8]. This fusion of technology with knowledge not only benefits conservationists but also forms the foundation for modern plant conservation education. By introducing ecologists and conservationists to these tools we ensure a comprehensive, knowledgeable, and adaptable approach, to safeguarding our planet’s rich tapestry of plant life.
In this chapter, we explore the process of estimating LAI using NDVI. We specifically highlight its significance in educating about plant conservation. It is crucial to comprehend the relationship between these vegetation indices and plant growth to ensure the preservation of plant diversity and the overall health of our planet’s ecosystems.
2. The role of crop monitoring in plant conservation
2.1 Importance of regular crop monitoring
Regularly monitoring crops is a task in agriculture that also contributes to plant conservation [9]. It involves assessing the condition of crops, their growth stages, and potential risks to ensure they grow healthily and produce yields. This does not guarantee food security. It also plays a significant role in preserving the diversity of plants. By conducting crop monitoring, farmers can identify signs of diseases, pest infestations, or environmental stressors [10]. Taking action can minimize the impact of these factors, promote healthy crop growth, and reduce the risk of losing plant species.
Frequent crop monitoring is also important for optimizing resource utilization. Agriculture requires amounts of water, nutrients, and other resources. By monitoring crop conditions and requirements, farmers can optimize the use of these resources effectively while minimizing waste and environmental harm [9]. For example, employing precision irrigation systems based on data collected through crop monitoring can significantly reduce water consumption while ensuring that plants receive moisture.
Furthermore, regular crop monitoring enables data collection on crop growth and development. These data are invaluable for researchers and policymakers involved in efforts to conserve plants. It helps them understand the needs and challenges faced by crop species facilitating the development of more efficient conservation strategies.
2.2 Implications of crop monitoring on plant conservation
Crop monitoring plays a crucial role in plant conservation for several reasons. Firstly it aids in detecting and managing diseases, pests, and environmental stressors at a stage. By acting, we can minimize the impact of these factors on crop growth and reduce the risk of losing important species. This is especially important for crops that are vital for food security and have limited diversity.
Secondly, crop monitoring allows us to optimize resource utilization effectively. By monitoring the conditions and requirements of crops, agriculturists can make use of water, nutrients, and other resources while minimizing waste and environmental harm. This approach is essential for agriculture practices that aim to conserve resources.
Thirdly, comprehensive data collected through crop monitoring provide insights for developing conservation strategies. Understanding the needs and challenges faced by crop species enables us to create more effective conservation plans. Preserving the diversity of crop species is crucial not only for ensuring food security but also for adapting to changing environmental conditions.
Regular crop monitoring is indispensable in preserving plant diversity. It enables the detection and management of threats while optimizing resource utilization and informing conservation strategies. Incorporating technologies such as remote sensing and vegetation indices can further enhance the effectiveness of crop monitoring efforts worldwide in plant conservation [5, 11].
The field of sensing has experienced advancements in the last few decades. Initially, remote sensing relied on photographs taken from aircraft, which provided a down view of the land surface and were primarily used for mapping and land use planning. However, these methods had limitations in agriculture due to their level of detail and inability to capture data across spectral bands.
The introduction of satellite technology brought about a breakthrough in sensing. Satellites equipped with sensors of capture data across spectral bands at varying spatial and temporal resolutions opened up new opportunities for agricultural applications. The development of hyperspectral sensors further enhanced this capability by providing information about vegetation and soil properties through data collection in specific narrow spectral bands.
In recent times, unmanned aerial vehicles (UAVs) have emerged as tools for agricultural remote sensing. Equipped with sensors such as hyperspectral and thermal sensors, UAVs can capture high-resolution data at a relatively lower cost [12]. This accessibility has made remote sensing more feasible for medium farms while also facilitating the growth of precision agriculture [13].
Crop monitoring heavily relies on continuous monitoring. It involves the use of various important measurements to assess plant health, vitality, and response to stress. One of the indicators is the LAI, which measures the amount of green leaf area in relation to the ground area. LAI’s utility is manifold: it not only delineates canopy structure but also serves as a proxy for plant photosynthetic capacity. Its significance is further magnified when compared with other indicators like evapotranspiration (ET). ET, which encompasses the combined processes of water evaporation from the soil and transpiration from plants, is another salient crop growth indicator. However, monitoring ET presents inherent challenges, particularly in accurately discerning the proportional contributions of evaporation and plant transpiration [14]. Additionally, ET’s dependency on various meteorological parameters complicates its direct estimation from remote sensing data [15]. In contrast, LAI provides a more straightforward, albeit equally profound, insight into crop status [16]. While other indicators, such as soil moisture and chlorophyll content, complement the understanding of crop health, LAI holds a comparative advantage due to its direct correlation with plant physiological activities and its lesser susceptibility to external variabilities, unlike ET. Thus, within the intricate tapestry of remote sensing indicators, the prominence and utility of LAI are undeniably paramount.
Vegetation remote sensing primarily involves capturing the reflectance of electromagnetic waves from plant canopies using passive sensors. It’s widely recognized that this reflectance varies based on the type of plant, the moisture content in its tissues, and other inherent characteristics [17]. Vegetation indices in remote sensing provide essential quantitative measures of vegetation properties, revealing critical insights about land surface characteristics. These signatures provide details regarding the condition, biochemical composition [18], and configuration of a leaf area or canopy. These mathematical combinations of different bands of the electromagnetic spectrum are designed to enhance the contribution of vegetation properties while minimizing the influence of soil and atmospheric conditions. By exploiting the spectral characteristics of vegetation, indices such as the NDVI and LAI have become invaluable tools in monitoring vegetation growth, assessing plant health, and estimating crop yield.
The information regarding the biochemical characteristics of vegetation and the soil beneath it is carried by the radiation that is either reflected or emitted by the Earth’s surface. Vegetation has a tendency to absorb light in the red parts of the spectrum while reflecting light in the near-infrared parts. The absorption of light in the portion can be attributed to chlorophyll whereas other pigments and water contribute to the absorption in the portion. The reflection occurring in the infrared area is a result of how light scatters off leaf cell structures.
Vegetation indices take advantage of these characteristics to measure vegetation properties that are not significantly affected by changes in soil and atmospheric conditions. For instance, the NDVI is calculated by comparing the reflectances of red light and then normalizing the difference by their sum. This index offers a way to determine how green the vegetation is and is widely used to evaluate plant health, growth stage, and biomass.
NDVI is commonly used as an indicator of growth or strength. Because of this, many studies have compared it with the LAI [19], which quantifies the LAI in relation to the surrounding soil area [20].
4.1 Normalized difference vegetation index (NDVI)
NDVI is a used measure for assessing vegetation. It is calculated using the following formula:
NDVI=NIR−REDNIR+REDE1
In the infrared region, NIR represents the reflectance while RED represents the reflectance, in the region. The NDVI values range from −1 to +1, where negative values indicate areas without vegetation, values close to zero indicate bare soil or sparse vegetation, and positive values indicate vegetation coverage.
NDVI is a measurement for assessing the greenness of vegetation. It is closely linked to factors such as chlorophyll content, LAI, and biomass. It is commonly utilized to monitor plant growth, evaluate plant health, and estimate crop yield [21].
4.2 Leaf area index (LAI)
LAI is a metric in the field of vegetation. It quantifies the coverage of leaves on the ground per unit area. Assessing LAI is crucial for understanding photosynthesis potential and crop yield. Researchers can determine LAI by establishing connections between sensing data, band reflectance, and leaf area index using either relationships or physical models.
In agriculture, accurately estimating LAI plays a role in evaluating crop growth and predicting yield [22]. It is a parameter in models used for forecasting crop yield, scheduling irrigation, and applying fertilizers [13]. Additionally, it aids in the detection of plant stress and diseases, enabling farmers to take actions to minimize losses.
LAI serves as an indicator of crop growth offering insights that can optimize agricultural practices for higher yields and more sustainable farming. Measuring LAI (Leaf Area Index) can be achieved through various methods, such as destructive methods, indirect methods, and remote sensing techniques.
4.2.1 Destructive methods
This method is considered the precise way to measure LAI. It entails plucking the leaves from the plant and gauging their size [22]. A typical practice involves harvesting leaves from a group of plants within a ground area. Once harvested, the leaves are scanned for area measurement. Although this approach yields results, it requires labor and, as implied by its name, causes harm to the plants.
4.2.2 Indirect methods
These techniques involve calculating the LAI without the need to physically remove and measure the leaves [21].
4.2.2.1 Optical instruments
Indirect LAI measurements are often conducted using instruments such as the LAI 2000, LAI 2200, or digital hemispherical photography. These instruments gauge the amount of light that passes through the canopy at heights allowing for an estimation of the LAI [22].
4.2.2.2 Remote sensing
This approach involves utilizing satellites or high-altitude aircraft to gather reflectance data from the vegetation surface. Empirical relationships or physical models are then utilized to establish a connection between these reflectance data and the LAI.
Each of these approaches has its strengths and limitations. Destructive methods offer the measurements but require significant manual effort and may not be suitable for monitoring large areas or when continuous observation is needed. Optical instruments are less labor-intensive and enable monitoring, although they may have slightly lower accuracy compared to destructive methods. Remote sensing allows for monitoring. It might be slightly less accurate than ground-based methods due to factors such as cloud cover or soil background influence.
NDVI and LAI are valuable tools for crop monitoring and provide valuable information about plant health, growth stage, and yield potential [23]. Despite some limitations, they provide real-time data over large spatial scales, facilitating the timely detection of stress factors and optimizing resource use. Incorporating NDVI and LAI into crop monitoring practices can contribute to sustainable agriculture and plant conservation efforts.
Case studies serve as an indispensable pedagogical tool, providing students with a unique platform to bridge theory and real-world applications, thereby fostering the development of their analytical and problem-solving acumen. The immersive and interactive nature of case studies positions them as a cornerstone in effective teaching and learning, equipping students with the skills necessary for their future professional endeavors.
Within the context of this chapter, we narrow our focus to a case study centered on the utilization of the NDVI, derived from MODIS Surface Reflectance data. Our primary objective is to estimate the LAI of rice, shedding light on the intricate methodologies that underpin our understanding and pedagogical approach to plant diversity and conservation status. This exploration at the intersection of remote sensing technology, agronomy, and conservation education highlights the strides made in the realm of plant growth, health, and diversity estimation. LAI, a pivotal indicator of crop growth, emerges as a multifaceted tool with applications not only in agriculture but also as a pedagogical catalyst in the realm of plant conservation education.
In this chapter, we venture into the profound implications of retrieving LAI from NDVI, offering an in-depth and original perspective tailored for advanced readers with extensive prior knowledge. By meticulously dissecting the intricate relationship between LAI and NDVI, we pave the way for a deeper comprehension of plant diversity and the delicate equilibrium of conservation within our ecosystem. Our exploration of modern methodologies, notably NDVI-based LAI estimation, illuminates the transformative potential of technical knowledge in cultivating a heightened appreciation for plant life and its preservation.
5.1 Materials and methods
5.1.1 Description of study area
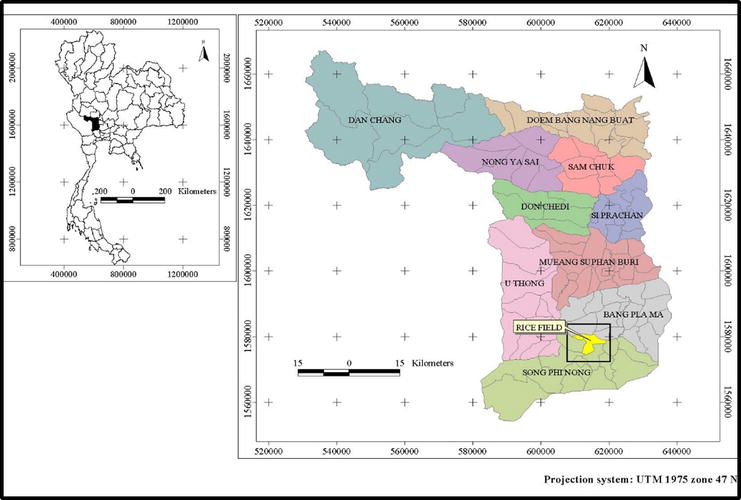
The research focal point for this case study resides within the expansive rice fields of the Song Phi Nong District, located in the heart of the Suphan Buri Province, Thailand. This geographic context, illustrated in Figure 1, presents a uniformly characterized terrain, meticulously analyzed utilizing advanced Landsat 7 ETM+, complemented by comprehensive land use maps and aerial imagery. The study period spans from January to April 2006, a critical growth phase for the initial crop cycle in this province.
Figure 1.
Location of the Study area in the Suphan Buri Province, Central Thailand.
The topographical essence of the study area reveals a predominantly flat low-land terrain, contributing to the perennial inundation of the rice fields throughout the monsoon season. This region’s climatic conditions manifest three distinct seasons: a rainy period from May to October, followed by a cool, dry interlude extending through November to February, and culminating in a hot, dry season from March to May. These cycles influence the annual rainfall, averaging between 900 to 1300 mm, and solar radiation approximating 17MJm2d−1 with temperature fluctuations ranging from a peak of 33−34°C to a low of 23−24°C. This climatic backdrop, interspersed with technological interventions, lays the foundation for the in-depth examination and estimation of Rice LAI employing NDVI within this intricate agricultural landscape.
5.1.2 Fild data collection
The acquisition of precise spectral reflectance and Leaf Area Index (LAI) data during the course of this study was a critical component of our research methodology. To ensure the accuracy and reliability of our findings, a meticulous field data collection process was undertaken. This section provides an exhaustive account of the instruments, techniques, and procedures employed for this purpose.
Spectral reflectance, a pivotal parameter for our study, was measured using a state-of-the-art spectroradiometer. The data acquisition process commenced during the initial stages of rice growth and extended through to the harvesting period. Notably, spectral reflectance readings were recorded at specific times between 9:00a.m. and 11:00a.m. This timing was selected deliberately, as the employed LAI-2000 Plant Canopy Analyzer (PCA) does not rely on direct solar radiation for LAI measurements. Furthermore, it is imperative to capture LAI with a low sun elevation angle, which is typically achievable during morning or evening hours.
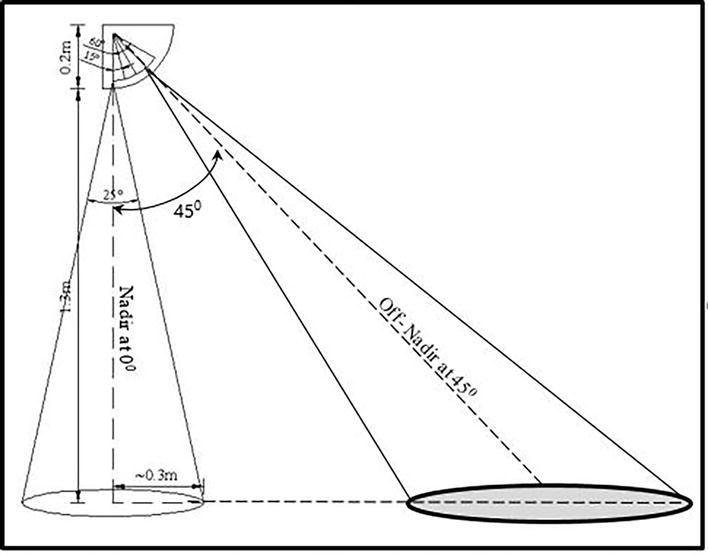
In order to mimic satellite data acquisition conditions, spectral reflectance readings were captured at five different angles, separately in the East and West directions. This strategic approach aligns with satellite data acquisition patterns, which predominantly move in the North-South direction while capturing reflectance in the East-West direction. Each spectral reflectance measurement involved 150 intervals, ranging from 0° to 60°, as precisely marked on a custom-made clinometer; refer to Figure 2. This level of granularity enabled us to examine the Bidirectional Reflectance Distribution Function (BRDF) effect in the field, as illustrated in Figure 2. For each day of ground truthing, five readings of spectral reflectance were recorded at each of the five different angles in both the East and West directions. These readings, along with the corresponding five LAI measurements from five sampled locations, were meticulously averaged.
Figure 2.
Schematic diagram of clinometer setup used to measure surface reflectance in the field with various angles.
Over the data collection period spanning from 12th February to 2nd April, a total of eight readings of spectral reflectance at each of the five different angles and eight readings of LAI were obtained in the field. The setup involved clamping the fiber optic wire of the spectrometer at each angle, where spectral reflectance readings were recorded in both directions. Consequently, a total of ten readings of spectral reflectance were measured each day during ground truthing activities. The spectrometer utilized in this process covered the spectral range from 304 nm to 1135 nm, with a precision increment of 1 nm.
To facilitate the comparison between in situ NDVI and MODIS data, the average reflectance for the red band was computed within the wavelength range of 620 nm to 670 nm, while for the near-infrared band, calculations were performed within the wavelength range of 841 nm to 876 nm.
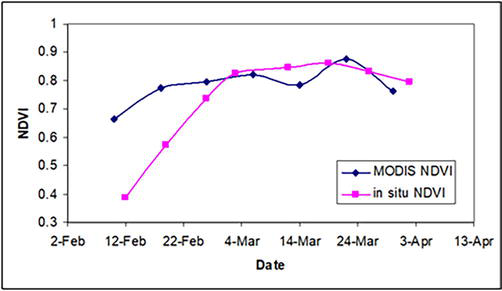
The estimation of the NDVI from in situ spectral reflectance readings was conducted on a weekly basis throughout the data collection phase. These in situ NDVI values were subsequently juxtaposed with NDVI estimations derived from 8-day composite MODIS surface reflectance data acquired during corresponding weeks of ground truthing, as depicted in Figure 3. Notably, two of the field data collection dates, namely 26th February and 3rd March, corresponding to the 8-day composite period from 26th February to 5th March (refer to Table 1 for details).
Figure 3.
Comparison of Field-Estimated NDVI at 0° Viewing Angle with MODIS Surface Reflectance-derived NDVI.
Field data collection dates
MODIS 8-day composite dates
12th Feb
10th Feb–17th Feb
19th Feb
18th Feb–25th Feb
26th Feb
26th Feb–5th March
3rd March
26th Feb–5th March
12th March
6th March–13th March
19th March
14th March–21th March
26th March
22th March–29th March
2nd April
30th March–6th April
Table 1.
Comparison of field data collection dates and MODIS 8-day composite reflectance data capture dates.
5.1.3 Methodology
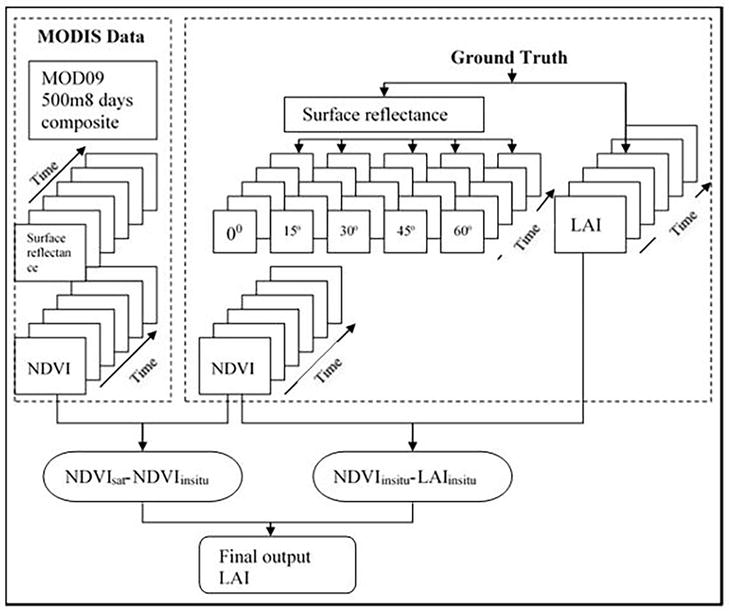
The workflow of the methodology used in this study is presented in Figure 3. It entails the acquisition of atmospheric-corrected MODIS surface reflectance data, which are then compared to the concurrently gathered field-derived NDVI using a precise fiber optic spectroradiometer. This comparative analysis serves as the cornerstone for establishing the intricate relationship between MODIS-derived NDVI and LAI, as thoughtfully delineated within the methodology’s flowchart in Figure 4.
Figure 4.
Workflow of the methodology.
5.2 Results and discussion
5.2.1 Correlation analysis of in situ NDVI and NDVI derived from MODIS
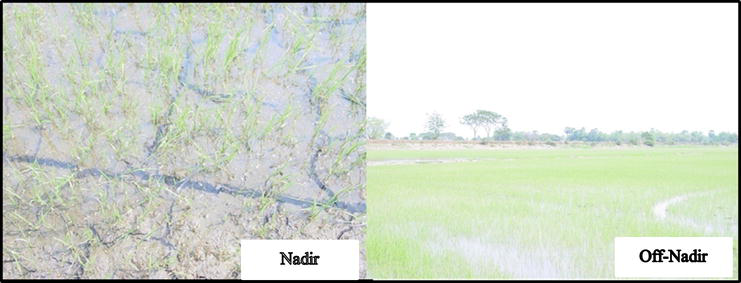
The study focused on contrasting in situ NDVI measurements against those derived from MODIS. Upon comparison of eight in situ NDVI values against seven MODIS-derived NDVI values, distinctions were evident, particularly in early crop development stages. During this phase, the paddy displays a dispersed growth pattern with visible muddy soil amidst the newly germinated rice plants. As evident in Figure 5, this exposes the canopy to background contamination errors.
Figure 5.
Comparing Nadir and Off-Nadir Perspectives: The Interplay of Soil and Paddy Leaf Reflectance.
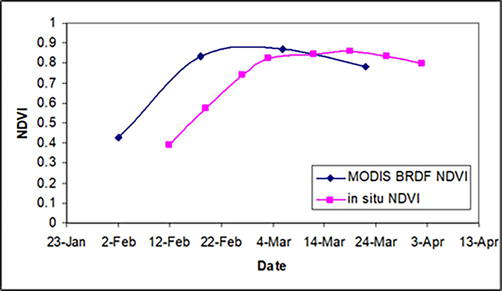
From a satellite observational perspective, the inherent angular effect of the MODIS observation platform can cause the field to appear differently than ground-based observations, as seen by the naked eye. This phenomenon is attributed to the angular effect, which, in this scenario, led to an elevation in MODIS-derived NDVI values. The atmospheric attenuation and the presence of aerosols introduce notable discrepancies between the surface-measured “true” NDVI and space-determined NDVI [24]. The comparison of MODIS BRDF nadir-adjusted 16-day composite data with in situ NDVI, as displayed in Figure 6, revealed analogous growth patterns to in situ measurements taken at nadir. However, the integration of 16 days of composite data with data garnered in a single day presents inherent challenges.
Figure 6.
Comparison of NDVI from MODIS (BRDF) Nadir-Adjusted Data and Field-Estimated NDVI.
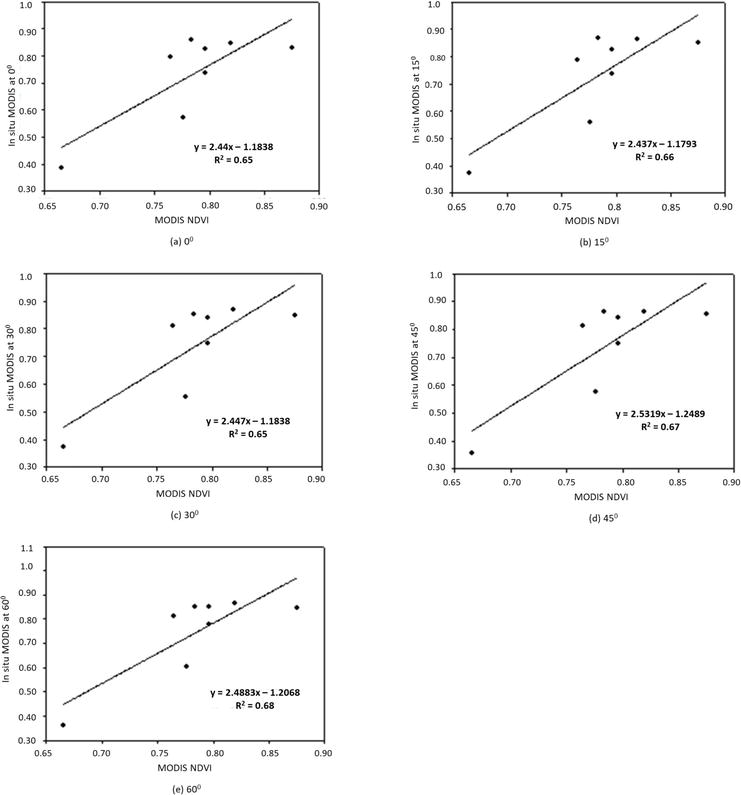
A comprehensive assessment was conducted by comparing the MODIS NDVI with the average in situ NDVI, aggregated from measurements taken at five field locations, both in the East and West directions and across five observation angles. It’s important to note that the ground truth surface reflectance data were consistently collected during the morning hours, between 9:00 a.m. and 11:00 a.m. To quantify the association, a linear correlation coefficient R2 was computed between in situ NDVI from five angles and the NDVI derived from MODIS surface reflectance as presented in Table 2. The outcome of this exercise is delineated in Figure 7, illustrating comparable results across all observations. For preciseness, the in situ NDVI was linearly interpolated to match the view zenith angle of MODIS.
Observation angle
Relationship
R2
0°
y=2.447x−1.1838
0.65
15°
y=2.437x−1.1793
0.66
30°
y=2.447x−1.1838
0.65
45°
y=2.532x−1.2469
0.67
60°
y=2.488x−1.2068
0.68
Table 2.
Linear correlations between in situ NDVI acquired from spectrophotometer and clinometer at different angles and the corresponding MODIS NDVI values.
Figure 7.
Correlation of in situ NDVI measurements at varying angles (0°, 15°, 30°, 45°and 60°) with MODIS-derived NDVI values.
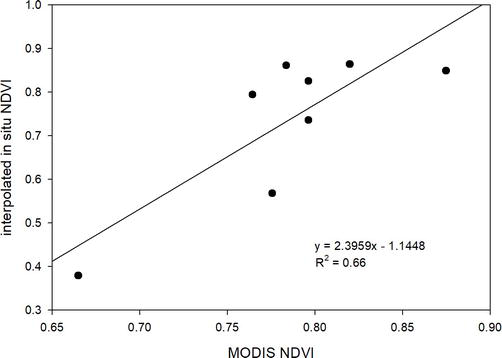
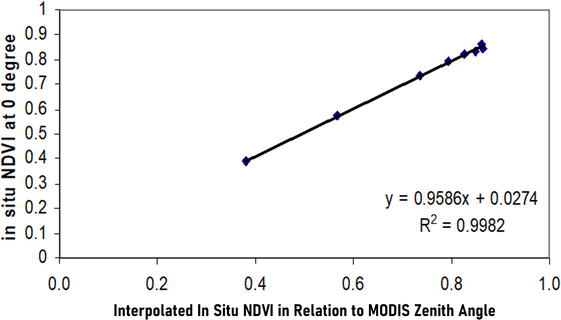
Diving into the technicalities, the MODIS metadata file underscores the specifications intrinsic to the MODIS surface reflectance product, as documented in Table 3. The in situ NDVI measurements taken at various angles underwent interpolation to align with the zenith angle of MODIS, and the subsequent results are tabulated in Table 4 and presented in Figure 8.
MODIS data available day
DOY
View zenith angle
Solar zenith angle
NDVI
02 Feb
33
6.77
39.20
0.5987
10 Feb
41
7.93
36.59
0.6649
18 Feb
49
6.43
30.69
0.7757
26 Feb
57
8.39
32.14
0.7962
06 Mar
65
22.26
28.93
0.8199
14 Mar
73
20.07
29.22
0.7835
22 Mar
81
22.45
24.01
0.8748
30 Mar
89
19.39
25.14
0.7643
Table 3.
Characteristics of MODIS on respective dates.
Field data collection day
Interpolated in situ NDVI
12 Feb
0.3794
19 Feb
0.5675
26 Feb
0.7362
03 Mar
0.8252
12 Mar
0.8642
19 Mar
0.8616
26 Mar
0.8492
02 Apr
0.7941
Table 4.
Interpolated in situ NDVI corresponding to view zenith of MODIS.
Figure 8.
Relationship between MODIS NDVI and interpolated in situ NDVI.
For standardization, the interpolated in situ NDVI was adjusted to a nadir observation. This elaborate process established a multistage methodology to extract in situ NDVI from MODIS-derived NDVI. Refer Figure 9.
Figure 9.
Comparison of in situ NDVI estimated at 0° in field and in situ NDVI obtained by derived model.
A noteworthy challenge encountered during this study was the presence of clouds, which substantially influenced the dataset. Specifically, the remote sensing data accrued on the 19th and 22nd of March displayed significant inaccuracies, impacting the NDVI and LAI calculations. Moreover, while the initial plan encompassed data collection from seven distinct locations, challenges in rice maintenance at two sites narrowed the scope to five sites by the end of this research.
In summation, while the inherent differences between in situ NDVI and MODIS-derived NDVI exist, particularly during the early growth stages, the methodologies developed and adopted in this study demonstrate the potential to harmonize these measurements, ensuring more accurate representations for educational and research endeavors.
5.2.2 Validation of model
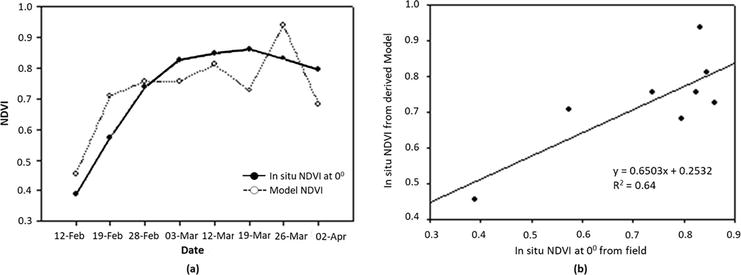
From Figure 10, it becomes evident that the model-derived NDVI closely mirrors the in situ NDVI recorded at a 0° observation angle during the initial stages of rice growth. This alignment signifies the model’s accuracy and relevance, especially in its early phases. However, as the rice matures, discrepancies emerge, likely due to contaminants in the remote sensing data. These irregularities cause the modeled in situ NDVI to deviate from the expected outcomes, highlighting areas for further refinement to ensure the model’s robustness and precision in all growth stages.
Figure 10.
(a) Comparison of In situ NDVI Measurements at 0° and Model-derived NDVI Over Time and (b) Linear Regression Analysis between In situ NDVI Measured at 0° Sensing Position and Model-derived In situ NDVI.
5.2.3 Correlation analysis of in situ NDVI and in situ LAI
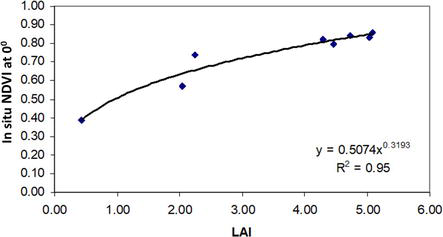
The relationship between in situ NDVI and in situ LAI proves intricate and multifaceted (Figure 11). While initial observations might suggest a linear association, deeper analysis reveals otherwise. As elucidated in prior studies, the NDVI’s sensitivity to LAI diminishes as the LAI value escalates, typically reaching a threshold between 2 and 3 [21, 24]. Beyond this threshold, NDVI displays an almost linear increase in tandem with LAI until reaching an asymptotic region. Here, the NDVI’s increase becomes markedly lethargic despite further LAI enhancement. This asymptotic phase notably coincides with the scenario where the ground surface is predominantly veiled by foliage. A linear correlation coefficient R2 was derived by juxtaposing in situ NDVI at 0° and in situ LAI. Notwithstanding, it’s salient to note that a considerable portion of LAI measurements resided within the 4–5 range, rendering a nonlinear correlation analysis between the two in situ parameters more appropriate for this study.
Figure 11.
Regression analysis of In situ NDVI at Nadir against LAI measurements from a rice field using an LAI Canopy analyzer.
The outcome from the nonlinear correlation analysis between in situ NDVI estimated at 00 and in situ LAI is as in Eq. (2).
In situ NDVIat0°=0.5074×LAI0.3193E2
5.2.4 Final model development
The devised model delineates a two-part progression: firstly, the NDVI transformation from satellite data to in situ measurements and subsequently, a translation from in situ NDVI to Leaf Area Index (LAI). In the former segment, analogous variables, predominantly NDVI, are juxtaposed, ensuring a congruent foundation for subsequent analysis. Concurrent measurements of spectral reflectance and in situ, LAI, taken identically in terms of both location and timing within the rice field, comprise the latter part. This methodological bifurcation, characterized by its multistage modeling, offers a nuanced perspective, arguably surpassing the realism afforded by single-stage counterparts. Notably, the direct association between MODIS NDVI and in situ LAI remains unexplored in this research. The in situ NDVI yielded an RMSE of 0.603, while the LAI’s estimation stood at 2.120. Such heightened RMSE values potentially originate from contamination errors inherent in the remote sensing data. A specific instance on the 22nd of March revealed an overestimated NDVI value, which consequentially skewed the LAI computations.
In situNDVIMODIS=2.2967×NDVIMODIS−1.0727E3
LAI=NDVIin situ0.50743.1318E4
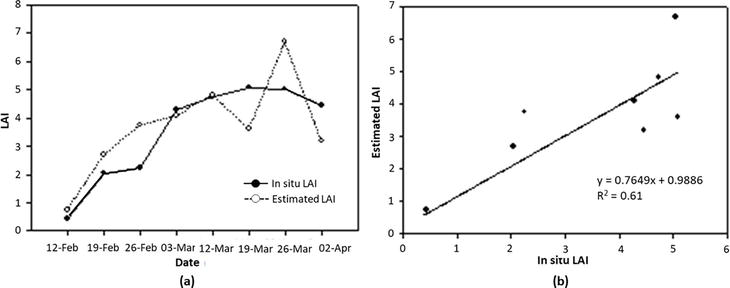
Refer to Figure 12 for the model LAI validation against in situ LAI. The discernable trend showcases the LAI derived from our proposed model aligning closely with the empirically measured in situ LAI. The observed coefficient of correlation R2 registered a value of 0.61, suggesting potential enhancement opportunities through refining the precision of remote sensing datasets.
Figure 12.
(a) Comparison of In situ LAI measured by LAI canopy analyzer and Estimated LAI by model. (b) Regression Analysis of In situ LAI Against LAI estimated developing relationship with NDVI.
The incorporation of NDVI methodologies into plant conservation education offers a promising avenue for enhancing both the depth and breadth of students’ understanding of plant diversity and conservation. The process of estimating Rice LAI using NDVI serves as a case study that illuminates broader implications for plant conservation education.
6.1 Bridging the gap between theory and practice
Bridging the gap between theory and practice by integrating NDVI-derived methodologies into the curriculum, educators can provide students with hands-on experiences that bridge the gap between theoretical knowledge and practical applications. Such methodologies not only furnish students with a clear understanding of how remote sensing technologies can be employed in monitoring plant health and growth but also demonstrate the transformative potential of these technologies in conservation efforts.
6.2 Fostering critical thinking and analytical skills
The process of analyzing NDVI data, interpreting results, and drawing informed conclusions encourages students to develop robust analytical skills. By navigating the complexities associated with remote sensing data, students cultivate a critical mindset, essential for addressing contemporary challenges in plant conservation.
6.3 Enhancing interdisciplinary learning
NDVI methodologies sit at the nexus of various disciplines including botany, environmental science, remote sensing, and data analytics. Incorporating this interdisciplinary approach into plant conservation education equips students with a holistic understanding, fostering collaboration across diverse fields and promoting innovative solutions.
6.4 Addressing real-world conservation challenges
By focusing on real-world applications, such as the estimation of Rice LAI, NDVI-based education underscores the pressing issues of biodiversity loss and environmental degradation. It compels students to grapple with real-world scenarios, pushing them to devise actionable strategies for conservation.
6.5 Preparing for the future of plant conservation
As technology continues to evolve and play an increasingly significant role in conservation efforts, it’s imperative for the next generation of conservationists to be well-versed in cutting-edge methodologies like NDVI. Integrating such tools into educational curricula ensures that students are adequately prepared to leverage technology in future conservation endeavors.
6.6 Challenges and considerations
While NDVI methodologies offer numerous educational benefits, it’s vital for educators to be cognizant of potential challenges. These might include the steep learning curve associated with remote sensing technologies, ensuring data accuracy, and addressing the nuances of interpreting NDVI data in varied environmental contexts. An in-depth curriculum, supplemented with hands-on training sessions, can mitigate these challenges.
Eventually, the integration of NDVI methodologies into plant conservation education holds immense potential for shaping the future of the field. By imparting both theoretical knowledge and practical skills, educators can foster a new generation of conservationists, adept at harnessing technology to safeguard our planet’s biodiversity.
6.7 Future directions for plant conservation education
The rapidly evolving landscape of plant conservation education, underpinned by technological and ecological advancements, calls for a forward-looking vision. Notably, the integration of vegetation indices, such as NDVI and LAI, into educational frameworks has showcased the transformative potential of these metrics in conservation endeavors. Here, we extrapolate the future trajectories of plant conservation education, with a spotlight on various vegetation indices.
Comprehensive integration of vegetation indices: The pronounced impact of vegetation indices like NDVI in determining plant health and ecosystem dynamics mandates their comprehensive integration into curricula. Beyond NDVI, there’s a need to incorporate a spectrum of indices like the Enhanced Vegetation Index (EVI), Soil-Adjusted Vegetation Index (SAVI), and others, ensuring students gain a holistic understanding of their varied applications.
Delving deeper into the ecological significance of LAI: LAI is not merely a metric but an ecological barometer reflecting plant health, productivity, and broader ecosystem interactions. Future courses should intensify their focus on LAI, exploring its role in water balance, nutrient cycling, and interspecies interactions within ecosystems.
Embracing advanced technologies for index estimation: As remote sensing technologies advance, it’s essential for conservation education to stay abreast. The advent of high-resolution satellite imagery, drone-based observations, and advanced data analytics platforms promise enhanced accuracy in vegetation index estimation, warranting their inclusion in advanced courses.
Interdisciplinary approaches anchored in vegetation indices: The multifaceted nature of vegetation indices, spanning botany, geospatial sciences, and data analytics, advocates for interdisciplinary synergies. Future curricula should inspire students to perceive these indices through diverse lenses, fostering comprehensive conservation solutions.
Real-world applications and field studies: Theoretical knowledge, while foundational, is enriched by practical applications. Emphasizing field studies that allow students to measure and interpret vegetation indices across different ecosystems can foster a profound understanding of their real-world implications.
Policy advocacy with emphasis on vegetation indices: The centrality of vegetation indices in gauging ecosystem health positions them as pivotal metrics in environmental policymaking. Aspiring conservationists should be equipped to champion policies that prioritize these indices, ensuring their prominence in environmental evaluations and conservation strategies.
Lifelong learning and continuous updates on vegetation indices: The dynamic nature of the field necessitates an ethos of lifelong learning. As newer vegetation indices are developed and existing ones refined, continuous education opportunities can ensure conservationists remain attuned to cutting-edge methodologies.
As we craft the future of plant conservation education, a harmonious blend of traditional wisdom and avant-garde methodologies, centered around these indices, will be instrumental in nurturing conservationists capable of addressing the multifarious challenges of the modern world.
In the contemporary landscape of environmental science and conservation, technological advancements have ushered in novel methods to study and preserve the planet’s rich biodiversity. One of the pivotal advancements has been the application of the NDVI derived from satellite observations, such as Landsat 8/9 and the MODIS surface reflectance. This chapter has elucidated the utility of NDVI in estimating the LAI of rice, a staple food crop that plays a significant role in global food security.
The estimation of LAI using NDVI offers multiple advantages. Firstly, it provides an efficient and nondestructive method to gauge the growth and health status of rice crops. The LAI serves as an indicator of the amount of leaf surface area available for photosynthesis, a parameter intrinsically linked to crop yield and health. The ability to remotely assess this metric on a large scale can substantially enhance monitoring capabilities, making it feasible to detect potential threats or deficiencies early on.
Moreover, the use of NDVI-based methodologies exemplifies the integration of modern technology into the realm of plant conservation and education. By leveraging satellite-based remote sensing, educators and conservationists can obtain real-time data, allowing for more dynamic and responsive conservation strategies. This data-driven approach not only enhances the accuracy of monitoring but also offers an opportunity to engage with the broader community, fostering a deeper understanding and appreciation of the intricate dynamics of plant ecosystems.
It is also worth noting that while this chapter has focused on rice LAI estimation, the principles and methodologies discussed are adaptable to other crops and vegetation types. This versatility underscores the potential of NDVI as a tool not just for rice conservation but for broader applications in plant diversity and conservation education.
In the grand narrative of plant conservation, the significance of understanding and preserving biodiversity cannot be understated. As primary producers, plants form the foundation of most terrestrial ecosystems, influencing everything from atmospheric composition to soil health. The loss of plant diversity, as the chapter highlighted, has far-reaching consequences, affecting not only the health of ecosystems but also the human societies that depend on them.
Eventually, the use of NDVI in estimating rice LAI presents a confluence of technology and conservation, paving the way for more informed and effective strategies to safeguard our planet’s biodiversity. As the challenges of environmental degradation and biodiversity loss intensify, it is imperative that educators, researchers, and conservationists harness the power of such innovative methodologies. This chapter serves as a testament to the potential of integrating technology with conservation education, underscoring the need for continuous innovation and collaboration in the quest to preserve the planet’s rich tapestry of life.
1.Maunder M. Plant conservation. In: Levin SA, editor. Encyclopedia of Biodiversity. Second ed. Waltham: Academic Press; 2013. pp. 76-89. DOI: 10.1016/B978-0-12-384719-5.00280-X
2.Sandifer PA, Sutton-Grier AE, Ward BP. Exploring connections among nature, biodiversity, ecosystem services, and human health and well-being: Opportunities to enhance health and biodiversity conservation. Ecosystem Services. 2015;12:1-15
3.Adebayo O. Loss of biodiversity: The burgeoning threat to human health. Annals of Ibadan Postgraduate Medicine. 2019;17(1):1-3
4.Five drivers of the nature crisis. Available at: https://www.unep.org/news-and-stories/story/five-drivers-nature-crisis
5.Omia E, Bae H, Park E, Kim MS, Baek I, Kabenge I, et al. Remote sensing in field crop monitoring: A comprehensive review of sensor systems, data analyses and recent advances. Remote Sensing. 2023;15(2):354. DOI: 10.3390/rs15020354
6.Ardoin NM, Bowers AW, Gaillard E. Environmental education outcomes for conservation: A systematic review. Biological Conservation. 2020;241:108224
7.Corlett RT. Plant diversity in a changing world: Status, trends, and conservation needs. Plant Diversity. 2016;38(1):10-16
8.de la Iglesia A, Martinez SML. Demystifying normalized difference vegetation index (NDVI) for greenness exposure assessments and policy interventions in urban greening. Environmental Research. 2023;220:115155
9.Dhanaraju M, Chenniappan P, Ramalingam K, Pazhanivelan S, Kaliaperumal R. Smart farming: Internet of things (IoT)-based sustainable agriculture. Agriculture. 2022;12:1745. DOI: 10.3390/agriculture12101745
10.Zhang J, Huang Y, Ruiliang P, Gonzalez-Moreno P, Yuan L, Kaihua W, et al. Monitoring plant diseases and pests through remote sensing technology: A review. Computers and Electronics in Agriculture. 2019;165:104943
11.Bégué A, Arvor D, Bellon B, Betbeder J, de Abelleyra D, Ferraz R, et al. Remote sensing and cropping practices: A review. Remote Sensing. 2018;10:99. DOI: 10.3390/rs10010099
12.Zhang Z, Zhu L. A review on unmanned aerial vehicle remote sensing: Platforms, sensors, data processing methods, and applications. Drones. 2023;7:398. DOI: 10.3390/drones7060398
13.Sishodia RP, Ray RL, Singh SK. Applications of remote sensing in precision agriculture: A review. Remote Sensing. 2020;12:3136. DOI: 10.3390/rs12193136
14.Wanniarachchi S, Sarukkalige R. A review on evapotranspiration estimation in agricultural water management: Past, present, and future. Hydrology. 2022;9:123. DOI: 10.3390/hydrology9070123
15.Wu B, Zhu W, Yan N, Xing Q, Xu J, Ma Z, et al. Regional actual evapotranspiration estimation with land and meteorological variables derived from multi-source satellite data. Remote Sensing. 2020;12:332. DOI: 10.3390/rs12020332
16.Pasqualotto N, Delegido J, Van Wittenberghe S, Rinaldi M, Moreno J. Multi-crop green LAI estimation with a new simple Sentinel-2 LAI index (SeLI). Sensors. 2019;19:904. DOI: 10.3390/s19040904
17.Liu C, Sun PS, Liu SR. A review of plant spectral reflectance response to water physiological changes. Chinese Journal of Plant Ecology. 2016;40(1):80
19.Sripada RP, Heiniger RW, White JG, Meijer AD. Aerial color infrared photography for determining early in-season nitrogen requirements in corn. Agronomy Journal. 2006;98(4):968-977
20.Zhang B, Wu D, Zhang L, Jiao Q, Li Q. Application of hyperspectral remote sensing for environment monitoring in mining areas. Environmental Earth Sciences. 2012;65:649-658
21.Kulkarni R, Honda K. Estimating LAI of Rice using NDVI derived from MODIS surface reflectance. Advances in Science, Technology and Engineering Systems Journal. 2020;5(6):1047-1053
22.The Importance of Leaf Area Index (LAI) in Environmental and Crop Research. Available from: https://cid-inc.com/blog/the-importance-of-leaf-area-index-in-\environmental-and-crop-research/#:∼:text=Since%20leaves%20are%20essential%20for,of%20environmental%20factors%20on%20plants
23.Vélez S, Martínez-Peña R, Castrillo D. Beyond vegetation: A review unveiling additional insights into agriculture and forestry through the application of vegetation indices. J (Multidisciplinary Scientific Journal). 2023;6:421-436. DOI: 10.3390/j6030028
24.Carlson T, Ripley D. On the relation between NDVI, fractional vegetation cover, and leaf area index. Remote Sensing of Environment. 1997;62:241-252. DOI: 10.1016/S0034-4257(97)00104-1
Written By
Rushikesh Kulkarni and Kiyoshi Honda
Submitted: 09 October 2023Reviewed: 10 October 2023Published: 16 December 2023
 Open access peer-reviewed chapter