Open Access is an initiative that aims to make scientific research freely available to all. To date our community has made over 100 million downloads. It’s based on principles of collaboration, unobstructed discovery, and, most importantly, scientific progression. As PhD students, we found it difficult to access the research we needed, so we decided to create a new Open Access publisher that levels the playing field for scientists across the world. How? By making research easy to access, and puts the academic needs of the researchers before the business interests of publishers.
We are a community of more than 103,000 authors and editors from 3,291 institutions spanning 160 countries, including Nobel Prize winners and some of the world’s most-cited researchers. Publishing on IntechOpen allows authors to earn citations and find new collaborators, meaning more people see your work not only from your own field of study, but from other related fields too.
To purchase hard copies of this book, please contact the representative in India:
CBS Publishers & Distributors Pvt. Ltd.
www.cbspd.com
|
customercare@cbspd.com
Many disease-causing microorganisms may have been introduced into the hospital’s interior air by clients, staff, students, visitors, inadequate ventilation, or the outside environment. Hospitalized patients are at a greater risk of nosocomial infection as a result of enclosed/restricted space, overcrowding, and inadequate infection prevention and control (IPC) practices, which create a favorable environment for microorganism growth. Therefore, an institutional-based cross-sectional study was conducted to determine the indoor air bacterial load in different wards of the Hospital using passive air sampling techniques, and IPC compliance was evaluated using the World Health Organization IPC Assessment Framework (IPCAF) tool. In this study, the mean bacterial load ranged from 450±54.0 CFU/m3 to 1585.83±155.64 CFU/m3 after 60 minutes of culture media exposure. Gram-positive bacteria were the most commonly detected bacteria in hospital indoor environments, accounting for 51 (71%) of all detected bacteria. Fungi were found in 65 (90.3%) of the samples. The overall IPC compliance score in this study was 178/800 (22.25%), which was considered inadequate. The highest IPC compliance score in this study was 48%. Therefore, implementing IPC standards and regularly monitoring the bacterial load in the indoor air are essential for preventing the spread of microorganisms to visitors, patients, students, and healthcare workers.
Department of Environmental Health, College of Medicine and Health Science, Dilla University, Ethiopia
Gose Husen Washo
School of Medicine, College of Health Science and Medicine, Dilla University, Ethiopia
Kuma Diriba
Department of Medical Laboratory Sciences, College of Health Science and Medicine, Dilla University, Ethiopia
*Address all correspondence to: zemash65@gmail.com
1. Introduction
Air pollution is referred to as a physical, biological, or chemical agent that pollutes the indoor or ambient (outdoor) environment and alters the inherent properties of the atmosphere [1]. The term “indoor air quality” (IAQ) means the air quality inside and surrounding buildings and structures, particularly in relation to the comfort and health of building occupants [2]. IAQ in healthcare settings is critical for patient safety and occupational health because healthcare professionals, employees, and clients spend extended periods of time in facilities [3, 4].
Hospital-acquired infections (HAIs) can be caused by pathogenic bacteria that can be found in healthcare facilities [5]. The Centers for Disease Control and Prevention (CDC) estimate that each year, nearly 1.7 million hospitalized patients acquire hospital-acquired infections (HAIs) while receiving treatment for other medical conditions and that more than 98,000 patients (1 in 17) die as a result of these infections [6].
Bacteria were found to be responsible for 90% of all HAIs. Bacterial indoor air quality reflects the sanitary conditions of the health facility. Bacteria, mold, and viruses can grow on ventilation system pans as well as the moist ceiling and floor [7]. Most bacteria may exist on dry surfaces for months and are resistant to disinfectants, which has an effect on patient health [8, 9, 10].
A lack of fresh air caused by increased building insulation, poorly maintained or operated ventilation systems, and poorly regulated temperature and relative humidity levels supports bio-aerosol presence and multiplication. Poor indoor air quality in developing countries may be caused by problems with design and inadequate ventilation [11, 12]. The presence of dirty attached toilets, insufficient waste disposal techniques, and an insufficient ventilation system all have an impact on the IAQ in healthcare facilities [13].
The majority of hospitals in developing nations lack an efficient IPC program as a result of a lack of knowledge, staff, water, laboratory backup, and safe practices among medical personnel [14]. The most prevalent disease-causing bacterial agents have been linked to poor indoor air quality and a variety of airborne infections [13, 15, 16]. The number of occupants, their activity, and the ventilation all influence the microbial load in hospital indoor air. Residents could be a source of microorganisms because bacteria are shed from the skin and respiratory tract. Gram-negative bacilli are found in sinks, washbasins, drains, nebulizers, humidifiers, and cooling towers [17, 18, 19].
The airborne colony count and IAQ parameters have significant associations; however, the association is not conclusive. Microorganisms can be affected by IAQ parameters [20]. Several studies in Ethiopia found a high risk of infection in hospital wards due to high bacterial loads in the air. Bacterial air quality was found to be above acceptable levels [21] in almost all of the hospital wards studied in Hawassa, Gonder, Jimma, and Adama [13, 22, 23, 24]. According to different research conducted in Ethiopian hospitals, the majority of hospital wards have a high bacterial concentration. However, none of them provide sufficient information on the various environmental conditions that contribute to high bacteria concentrations in indoor air. In addition, the WHO IPC Assessment Framework (IPCAF) and Hand Hygiene Self-Assessment Framework (HHSAF) are facility-level tools that each facility is expected to complete. Furthermore, the WHO IPC Assessment Framework (IPCAF) and Hand Hygiene Self-Assessment Framework (HHSAF) are facility-level tools that each facility is expected to complete. WHO encourages Ministries of Health to take the lead in promoting and coordinating the survey process and data collection among health facilities in their country (ideally through their national IPC focal point/team) [25]. However, no published data on the level of IPC compliance using WHO IPCAF tools were available in Ethiopia. Therefore, the main objective of this study was to assess IPC compliance at Dilla University Hospital using the WHO IPCAF tool, as well as determine bacterial concentrations in different hospital sites.
An institutional-based cross-sectional study was conducted at Dilla University Hospital in Dilla town, Gedeo zone, Southern Ethiopia, from June to August 2022, to determine indoor air bacterial load. A laboratory technician prepared blood agar according to standard operating procedure (SOP) one day before the data collection day, dispensed it into Petri dishes, and stored it in the refrigerator at 2-8°C after labeling it with the name of the media, preparation date, and expire date. We cleaned the sample collection area to avoid contamination during sample collection, and we decontaminated the cold box and transported it carefully to avoid contamination during transportation. To prevent contamination during incubation, we cleaned and decontaminated the incubator. The media for culture was prepared in accordance with the manufacturer’s instructions or procedures, and sterility was verified by incubating a sample of the batch for 48–72 hours at a temperature of 35–37°C to observe for growth. Any media batches that showed signs of growth within 72 hours were discarded.
2.1 Methods of laboratory diagnosis
2.1.1 Gram stain
Gram staining was used to distinguish between gram-positive and gram-negative bacteria by taking a sample from culture after overnight incubation and staining it with Crystal violet, Gram’s iodine, acetone alcohol (20 volumes of acetone to 19 volumes of methanol to 1 volume of water), and Safranin as a counterstain.
2.1.2 Microbiological analysis method
Air samples were collected two times a day, at 9:00 a.m. and 2:30 p.m. from different hospital rooms using a passive air method using 9 cm diameter Petri dishes filled with blood agar enriched with 5% sheep blood (Becton, Dickinson and Company) and dishes were left open using the 1/1/1 technique (1 meter from the walls, 1 meter from the floor, and for 1 hour), then covered with their lids and transported to the microbiology laboratory using a cold box for analysis. Colony-forming units (CFUs) were counted using a bacteria colony counter after each plate was incubated for 24 to 48 hours at 37°C under aerobic conditions. The CFU/m3 was calculated using Omeliansky’s equation after CFU [26, 27].
N = 5ax104 (bt)−1, Where N = microbial CFU/m2 of indoor air; a = number of colonies per petri dish; b = dish surface (cm2); t = exposure time (min) [28, 29]. We incubated the fungal culture on Sabouroad dextrose agar medium for three days at 25°C. Gentamicin, chloramphenicol, and cycloheximide were added to Sabouraud dextrose agar to inhibit both gram-positive and gram-negative bacteria overgrowth, and cycloheximide was added to inhibit saprophytic fungi growth. After autoclaving and cooling the media to 45 to 50°C, all antibiotics were added.
2.2 Data collecting procedures for IPC compliance
The IPC compliance assessment data was collected by IPC-trained health professionals and the IPC coordinator at Dilla University Hospital using the WHO IPCAF tool [30, 31]. The following are the main components of the tool:
Core component 1: Infection Prevention and Control (IPC) program.
Core component 2: Infection Prevention and Control (IPC) guidelines.
Core component 3: Infection Prevention and Control (IPC) education and training.
Core component 5: Multimodal strategies for implementation of infection prevention and control (IPC) interventions.
Core component 6: Monitoring/audit of IPC practices and feedback.
Core component 7: Workload, staffing and bed occupancy.
Core component 8: Built environment, materials and equipment for IPC at the facility level.
2.3 Standard definition
According to the WHO expert group, bacterial concentrations in indoor air must be less than 1000 CFU/m3 is acceptable [32].
2.3.1 European Commission for nonindustrial premises sanitary standard for bacterial load
According to the European Commission, the sanitary standard of bacterial load for nonindustrial premises is classified as follows:
Very low (<50 CFU/m3), Low (50–100 CFU/m3), Intermediate (100–500 CFU/m3), High (500–2000 CFU/m3), and Very high (more than 2000 CFU/m3) [33].
2.4 Data analysis
The data collection process was supervised by the principal investigator and co-authors, who also double-checked the collected data. The data were analyzed according to WHO guidelines. The maximum possible score was 800 because each core component of the IPCAF tool had a score of 100. IPC compliance was divided into four categories: inadequate (0–25%), basic (25.1–50%), intermediate (50.1–75%), and advanced (75.1–100%).
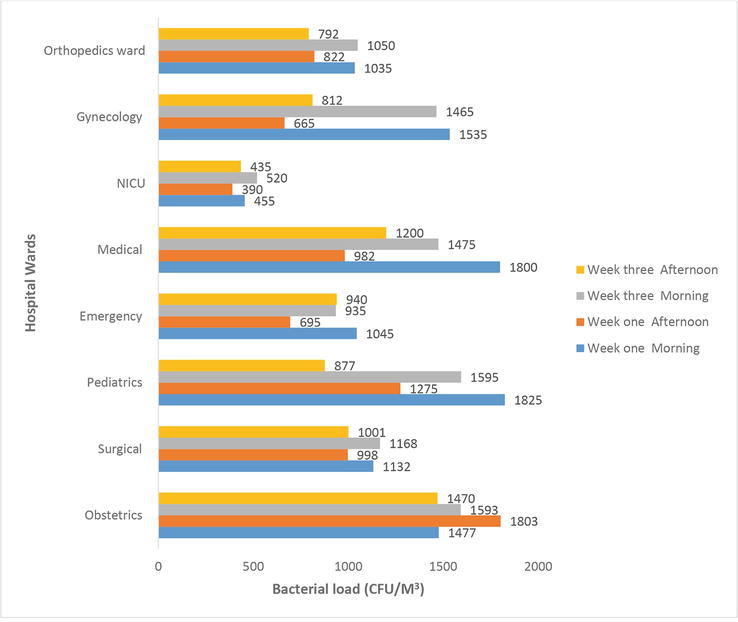
In this study, we collected 72 indoor air samples from different hospital sites, and the pediatric ward had the highest indoor air bacterial count (1825 CFU/m3), while the Neonatal Intensive Care Unit (NICU) had the lowest (390 CFU/m3) after 60 minutes of culture media exposure time (Figure 1).
Figure 1.
Bacterial counts in air samples from different wards.
The mean bacterial load in the Neonatal Intensive Care Unit (450 ± 54.0 CFU/m3), Orthopedics Ward (925 ± 136.37 CFU/m3), and Emergency (903.75 ± 148.12 CFU/m3) wards was within the WHO guidelines. However, the temperatures and relative humidity in all wards exceeded WHO guidelines (Table 1).
Wards/units
Bacteria (Mean CFU/m3 ± SD)
Temperature (°C)
RH (%)
WHO guidelines
Obstetrics
1585.83 ± 155.64
27
61.1
Bacteria (<1000 CFU/m3) Temperature (22–26.1°C) RH (30–60%)
Surgical
1075 ± 87.89
27.3
62.3
Pediatrics
1393.12 ± 411.13
27.2
66.5
Emergency
903.75 ± 148.12
26.5
61.2
Medical
1364.37 ± 353.48
27.9
67.8
NICU
450 ± 54.0
26.6
64.2
Gynecology
1119.37 ± 444.53
28.2
62.9
Orthopedics ward
925 ± 136.37
28.3
67
Table 1.
The mean bacterial concentrations, temperature, and humidity of different wards.
Abbreviations: NICU: Neonatal intensive care unit; CFU/M3: colony-forming units per cubic meter; RH: Relative Humidity; WHO: World Health Organization; SD: standard deviation.
3.1 Indoor air bacterial load of hospital wards
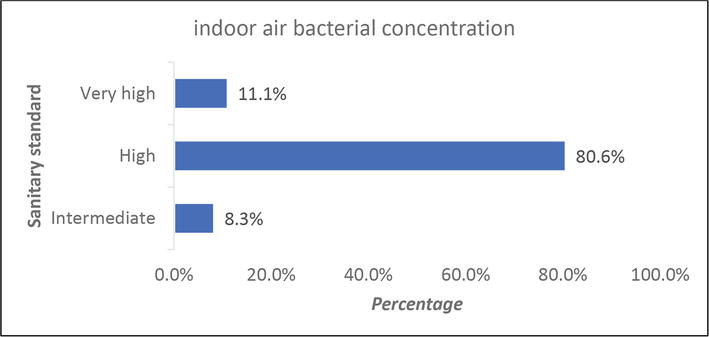
According to the European Commission’s nonindustrial premises sanitary standard, 58 (80.6%) of the samples in this study had high indoor air bacterial loads, and 8 (11.1%) had very high indoor air bacterial loads (Figure 2).
Figure 2.
Bacterial loads of indoor air.
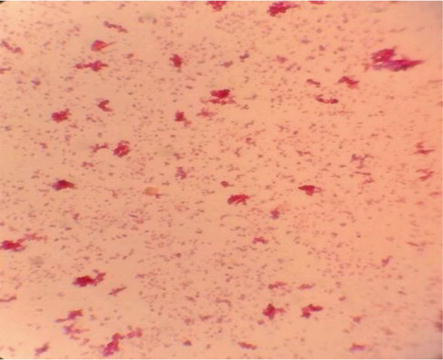
Gram-positive and gram-negative bacteria were found in this study, with gram-positive bacteria stained blue to purple (Figure 3) and gram-negative bacteria stained pink to red (Figure 4). According to the gram reaction, 71% was gram-positive and 29% was gram-negative. In 65 (90.3%) of the samples, fungal growth was observed.
Figure 3.
Gram-positive cocci bacteria.
Figure 4.
Gram-negative rod bacteria.
3.2 Infection prevention and control compliance
In this study, the overall IPC compliance score for six Dilla University Hospital wards was 178/800 (22.25%), which was considered inadequate. According to the study’s findings, the highest IPC compliance score was 48%, and the lowest compliance score was 0%. The majority of IPCAF tool scores ranged from 0 to 25%, indicating inadequate compliance. The core component “Built Environment, Materials, and Equipment” has the highest level of compliance, while healthcare-associated infection surveillance and multimodal strategies for IPC intervention have the lowest (Table 2).
IPCAF Core Components
Score
Percentage
Level of compliance
IPC program
35.0
35.0
Basic
IPC guidelines
25.0
25.0
Inadequate
IPC education and training
20.0
20.0
Inadequate
Healthcare-associated infection surveillance
0.0
0.0
Inadequate
Multimodal strategies for implementation of IPC interventions
0.0
0.0
Inadequate
Monitoring/audit of IPC practices and feedback and control activities
20.0
20.0
Inadequate
Workload, staffing and bed occupancy at the facility level
30.0
30.0
Basic
Built environment, materials and equipment for IPC at the facility level
48.0
48.0
Basic
Total score (Maximum 800)
178
22.25
Inadequate
Table 2.
IPC compliance level of Dilla University hospital, southern Ethiopia, 2022.
Abbreviations: IPC: Infection Prevention and Control; IPCAF: Infection Prevention and Control Assessment Framework.
3.3 Identified gaps in IPC activity implementation
The IPC compliance assessment result in Table 3 revealed that there were gaps in implementing the IPC program and guidelines. There was no IPC team, the hospital’s IPC program was not routinely supported by the microbiological laboratory, there were no guidelines for outbreak management and preparedness, and frontline healthcare workers were not involved in planning and execution of IPC guidelines. The strengths and identify gaps in education, training, and surveillance. IPC training was not frequently provided to healthcare workers, cleaners, patients, family members, and personnel directly involved in patient care. No surveillance was conducted for HAIs.
IPCAF Core Components
Strength
Identified gaps
IPC program
The IPC focal person has dedicated time to IPC activities.
There was no IPC team
The hospital’s senior management does not show a strong commitment to supporting the IPC program.
The hospital’s IPC program is not routinely supported by the microbiological laboratory.
A facility management professional was not assigned.
IPC guidelines
The hospital has the expertise (in IPC and/or infectious diseases) to adapt guidelines.
Available hospital guidelines that are consistent with national/international guidelines.
There are no guidelines for outbreak management and preparedness, prevention of surgical site infection, prevention of vascular catheter-associated bloodstream infections, hospital-acquired pneumonia, multidrug-resistant pathogens, and antibiotic stewardship.
Frontline healthcare workers were not involved in the planning and execution of IPC guidelines.
Healthcare workers did not receive specific training on IPC guidelines.
The hospital’s implementation of the IPC guidelines was not regularly monitored.
IPC education and training
IPC staff receive ongoing development/education (for example, by attending courses on a regular basis).
The hospital lacked additional non-IPC personnel with the necessary skills to serve as trainers and mentors.
IPC training was not frequently provided to healthcare workers, cleaners, and personnel directly involved in patient care.
The administrative and managerial staff at the hospital did not receive general IPC training.
Periodic evaluations of the effectiveness of training programs were not performed.
There is no specific IPC training for patients or family members to reduce the risk of healthcare-associated infections.
HAIs surveillance
None
No surveillance for HAIs
Multimodal strategies for implementing IPC interventions
None
Multimodal strategies were not used to implement IPC interventions at Dilla University Hospital.
Monitoring/audit of IPC practices and feedback and control activities
The hospital has trained personnel in charge of monitoring/auditing IPC practices and providing feedback.
There was no clearly defined IPC monitoring plan in the hospital with specific goals, targets, and activities.
In the hospital, IPC processes and indicators were not monitored.
The WHO Hand Hygiene Self-Assessment Framework Survey was not conducted on a regular basis in the hospital.
There was no evaluation of cultural factors affecting hospital safety.
The reporting of monitoring data was not done on a regular basis.
Workload, staffing, and bed occupancy at the facility level
Bed occupancy at Dilla University Hospital was restricted to one patient per bed.
In the hospital, the WHO healthcare worker-to-patient ratio was not maintained.
Wards in hospitals were not designed in compliance with international standards for bed capacity.
There is no adequate space of more than 1 m between patient beds in the facility.
No system in place in the hospital to assess bed capacity adequacy.
Built environment, materials, and equipment for IPC at the facility level
PPE was available in the hospital, in sufficient quantity, and for all uses for all healthcare employees
There is no safe drinking water station for employees, patients, or families in any of the wards.
The majority of wards lack working hand hygiene stations.
No functional and adequate toilet facilities in the hospital.
There is inadequate artificial and natural functional ventilation in patient care areas.
No protected waste disposal pit and functional incinerator.
Table 3.
Gaps identified in implementing the IPC program, guidelines, teaching, and training at Dilla University hospital in southern Ethiopia in 2021.
Abbreviations: HAIs: Healthcare-Associated Infections; IPC: Infection Prevention and Control; IPCAF: Infection Prevention and Control Assessment Framework.
Multimodal strategies were not used to implement IPC interventions at Dilla University Hospital. There was no clearly defined IPC monitoring plan in place at the hospital. The WHO Hand Hygiene Self-Assessment Framework Survey was not conducted on a regular basis. The WHO healthcare worker-to-patient ratio was not maintained in the hospital; there was insufficient space between patient beds, the majority of wards lacked working hand hygiene stations, there were no functional and adequate toilet facilities, no protected waste disposal pit, and no functional incinerator.
The bacterial indoor air quality reflects the sanitary conditions of the healthcare facility. In this study, the indoor air bacterial concentration of Dilla University Hospital wards was found to be in the range of 390 CFU/m3 and 1825 CFU/m3. The findings of this study were higher than those of studies conducted at the University of Gondar Teaching Hospital in Northwest Ethiopia (480 to 1468 CFU/m3) [13] and in Portuguese Hospital (240 to 736 CFU/m3) [34] but lower than those of studies conducted at Jimma University Specialized Hospital (2123 to 9733 CFU/m3) [22] and in hospitals in Dutse, Jigawa State (2770 CFU/m3) [35]. This disparity could be attributed to differences in infection prevention and control (IPC) practices, temperature and humidity variations, traffic flow control mechanisms, and hospital settings. According to various literature, the main contributing factors for a high microbial load in the indoor environments of healthcare settings were temperature, relative humidity, and the number of patients and visitors [36, 37].
The highest mean indoor air bacterial concentration was found in the obstetrics ward, while the lowest was found in the Neonatal Intensive Care Unit (NICU) ward. This study’s findings were supported by a case study at Jimma University Specialized Hospital [22]. The high bacterial concentration in the obstetrics ward could be attributed to poor room cleanliness, overcrowding, and insufficient ventilation, the attachment of unsanitary latrines and shower facilities, and ineffective healthcare waste management.
The average indoor air bacterial load ranged from 450 ± 54.0 CFU/m3 to 1585.83 ± 155.64 CFU/m3. This study’s findings were lower than the results of Jimma University Specialized Hospital, which ranged from 2123 CFU/m3 to 9733 CFU/m3 [22], but higher than those of a tertiary care hospital in India, which ranged from 65.52 CFU/m3 to 1179 CFU/m3 [11] and the University of Gondar Teaching Hospital in Northwest Ethiopia, which ranged from 480 CFU/m3 to 1468 CFU/m3 [13]. The high concentration of bacteria in the indoor air in this study could be attributed to poor healthcare waste management practices, overcrowding of wards, a lack of adequate artificial and natural ventilation, and poor sanitation of attached latrine facilities. According to the findings of various studies, poor ventilation systems can be a source of infections and can lead to the spread of various disease-causative agents or infectious pathogens [38].
In this study, a high percentage of the indoor air samples, 51.4%, exceeded the WHO expert group’s standards. The findings of this study agree with those of the University of Gondar Teaching Hospital in Northwest Ethiopia [13] and the Hawassa University Comprehensive Specialized Hospital [24].
In this study, the majority of 58 (80.6%) of collected indoor air samples had bacterial concentrations higher than the European Commission’s nonindustrial premises standard. Overcrowding, poor ventilation, unclean latrines, and splashes of blood or bodily fluids could all contribute to a high bacterial concentration. This study finding is supported by research from Nigeria [39], the University of Gondar Teaching Hospital in Northwest Ethiopia [13], and the Hawassa University Comprehensive Specialized Hospital Wards [24].
We detected both gram-positive and gram-negative bacteria after gram staining, but gram-positive bacteria were the most common, accounting for 51 (71%) of all bacteria detected. Similarly, studies conducted in hospital wards in Iran [40] and teaching hospitals in Nigeria [41] found that the majority of bacteria detected were gram-positive. This study’s finding is higher than that of a study conducted in Hawassa, Ethiopia (43.1%) [42], but lower than that of studies done at Ayder Referral Hospital in Northern Ethiopia (87.3%) [43] and Felege Hiwot Referral Hospital in Northwest Ethiopia (81.6%) [16]. Possible causes for the high concentration of gram-positive bacteria in hospitals include dry conditions, spread through the nasal cavity and skin of healthcare providers, clients, and students at clinical attachments.
In this study, gram-negative cocci and gram-positive rods were the most commonly detected bacteria species. Similarly, studies in Dutse, Jigawa State [35] in Islamabad, Pakistan [44], and Portuguese Hospital found that both gram-negative cocci and gram-positive rod bacteria were commonly detected bacteria species in the hospitals’ indoor environments [34].
Fungal growth was found in 65 (90.3%) of the samples in this study. This finding is supported by studies conducted in Nigeria [39], Northwest Ethiopia at the University of Gondar Teaching Hospital [13], and Hawassa University Comprehensive Specialized Hospital Wards [24]. The possible cause of high fungal loads in indoor air is insufficient artificial and natural ventilation, humidity, and temperature. Researchers demonstrated that effective hospital ventilation or filtration systems reduce indoor air fungal loads [38, 40]. Furthermore, the literature indicates that environmental factors such as humidity and air temperature contribute to a high fungi load in the hospital’s indoor environment [40, 45, 46].
Proper practices of IPC measures can play an essential role in reducing hospital-acquired (nosocomial) infections. The findings revealed that the majority of core components of IPC were not practiced, and materials, guidelines, and equipment for IPC were not available at Dilla University Hospital. Six of the eight core components of IPC compliance had inadequate compliance, while the other two had basic compliance. The overall IPC compliance score for Dilla University Hospital in this study was 178/800 (22.25%), which was considered inadequate. This study’s findings were lower than those of a study conducted at Lira University Hospital in Uganda, which found 28.5% [47].
PPE, detergents, and safe drinking water were among the IPC supplies that were limited in this study. The findings of this study are consistent with those of a study conducted in Ghana [48], a study conducted in the Arua district of Uganda [49], and the study conducted at Lira University Hospital, Uganda [47]. There is no IPC team at Dilla University Hospital, no budget has been allocated for the IPC program, the IPC program is not routinely supported by the microbiological laboratory, and no facility management specialist has been assigned. The findings of this study were supported by a study conducted at Lira University Hospital in Uganda [47].
Indoor air bacterial concentrations in the majority of Dilla University Hospital wards exceeded WHO guidelines and European Commission nonindustrial premises sanitary standards. Gram-positive rod bacteria and gram-negative cocci were found in this study, as well as fungal growth in 90.3% of the samples. Therefore, regular monitoring and evaluation of indoor air bacterial concentrations, as well as infection prevention and control measures, are necessary to control the introduction of microorganisms into the hospital. The overall compliance to IPC in Dilla University Hospital was 22.25% which was inadequate. The core component “Built Environment, Materials, and Equipment” and monitoring/surveillance have the highest level of compliance, while healthcare-associated infection surveillance and multimodal strategies for IPC intervention have the lowest. Therefore, the identified gaps in IPC implementation should be addressed in order to provide high-quality healthcare and reduce HCAIs. Furthermore, each room should be inspected on a regular basis to determine if there is any condition or situation that may enable microbial growth.
The study was conceptualized and designed by ZA. The data was collected, analyzed, and interpreted by ZA, KD, and GHW, and the book chapter was written by them. All authors reviewed and approved the final book chapter.
Before beginning the research, both verbal and written consent were taken into account. Letters of support from Dilla University and various stakeholders were also obtained.
1.Artiola JF, Reynolds KA, Brusseau ML. Chapter 18 - urban and household pollution. In: Brusseau ML, Pepper IL, Gerba CP, editors. Environmental and Pollution Science. Third ed. London, United Kingdom: Academic Press; 2019. pp. 311-326
2.Kubba S. Chapter seven - indoor environmental quality. In: Kubba S, editor. Handbook of Green Building Design and Construction. Second ed. Boston: Butterworth-Heinemann; 2017. pp. 353-412
3.World Health Organization. Regional Office for E. WHO guidelines for indoor air quality: selected pollutants. Copenhagen: World Health Organization. Regional Office for Europe; 2010
4.Weikl F, Tischer C, Probst AJ, et al. Fungal and bacterial communities in indoor dust follow different environmental determinants. PLoS One. 2016;11(4):e0154131-e0154131
5.Alemayehu T, Tadesse E, Ayalew S, et al. High burden of nosocomial infections caused by multi-drug resistant pathogens in pediatric patients at Hawassa university comprehensive specialized hospital. Ethiopian Medical Journal. 2019;58:45-55
6.Klevens MR, Edwards JR, Richards CL, et al. Estimating health care-associated infections and deaths in U.S. hospitals. Public Health Reports. 2002;122:160-166
7.Stockwell E, Ballard E, O’Rourke P, Knibbs L, Morawska L, Bell S. Indoor hospital air and the impact of ventilation on bioaerosols: A systematic review. Journal of Hospital Infection. 2019;103:175-184
8.Jain A, Singh K. Recent advances in the management of nosocomial infections. JK Science. 2007;9:3-8
9.Kramer A, Schwebke I, Kampf G. How long do nosocomial pathogens persist on inanimate surfaces? A Systematic Review. BMC infectious diseases. 2006;6:130
10.Russell AD. Bacterial resistance to disinfectants: Present knowledge and future problems. Journal of Hospital Infection. 1999;43:S57-S68
11.Srikanth P, Sudharsanam S, Steinberg R. Bio-aerosols in indoor environment: Composition, health effects and analysis. Indian journal of medical microbiology. 2008;26(4):302
12.Onmek N, Kongcharoen J, Singtong A, Penjumrus A, Junnoo S. Environmental factors and ventilation affect concentrations of microorganisms in hospital wards of southern Thailand. Journal of Environmental and Public Health. 2020;2020:7292198
13.Gizaw Z, Gebrehiwot M, Yenew C. High bacterial load of indoor air in hospital wards: The case of University of Gondar teaching hospital, Northwest Ethiopia. Multidisciplinary respiratory medicine. 2016;11:24
14.Samuel SO, Kayode OO, Musa OI, et al. Nosocomial infections and the challenges of control in developing countries. African Journal of Clinical and Experimental Microbiology. 2010;11(2):102-110
15.Ekhaise FO, Isitor EE, Idehen O, Emoghene AO. Airborne microflora in the atmosphere of an hospital environment of University of Benin Teaching Hospital (UBTH), Benin City, Nigeria. World Journal of Agricultural Sciences. 2010;6(2):166-170
16.Getachew H, Derbie A, Mekonnen D. Surfaces and air bacteriology of selected wards at a referral hospital, Northwest Ethiopia: A cross-sectional study. International journal of microbiology. 2018;2018:6413179
17.Ayliffe GAJ. Control of Hospital Infection : A Practical Handbook. London: Arnold; 2000
18.Gola M, Settimo G, Capolongo S. Indoor air quality in inpatient environments: A systematic review on factors that influence chemical pollution in inpatient wards. Journal of Healthcare Engineering. 2019;2019:1-20
19.Weber DJ, Anderson D, Rutala WA. The role of the surface environment in healthcare-associated infections. Current Opinion in Infectious Diseases. 2013;26(4):338-344
20.Hiwar W, King M-F, Shuweihdi F, Fletcher LA, Dancer SJ, Noakes CJ. What is the relationship between indoor air quality parameters and airborne microorganisms in hospital environments? A systematic review and meta-analysis. Indoor Air. 2021;31(5):1308-1322
21.Pasquarella C, Pitzurra O, Savino A. The index of microbial air contamination. The Journal of Hospital Infection. 2000;46(4):241-256
22.Fekadu S, Getachewu B. Microbiological assessment of indoor air of teaching hospital wards: A case of Jimma University specialized hospital. Ethiopian Journal of Health Sciences. 2015;25(2):117-122
23.Shiferaw T, Gebre-silasse L, Mulisa G, et al. Bacterial indoor-air load and its implications for healthcare-acquired infections in a teaching hospital in Ethiopia. International Journal of Infection Control. 2016;1996:1-9
24.Hailemariam M, Worku M, Azerefegne E. Intensive care units and operating rooms bacterial load and antibiotic susceptibility pattern. Journal of Surgery. 2016;4:60-64
25.World Health O. Infection Prevention and Control Assessment Framework at the Facility Level. Geneva: World Health Organization; 2018. p. 2018
26.Patricia G, Saravia S, Batistini P, Garcia Miniet M, Lavin P, Perdomo I. The quality of air at archives and the biodeterioration of photographs. International Biodeterioration & Biodegradation - Int Biodeterior Biodegrad. 2010;64:139-145
27.Gutarowska B. Metabolic activity of moulds as a factor of building materials biodegradation. Polish Journal of Microbiology. 2010;59(2):119-124
28.Fleischer M, Bober-Gheek B, Bortkiewicz O, Rusiecka-Ziólkowskaa J. Microbiological control of airborne contamination in hospitals. Indoor Build Environment. 2006;15(1):53-56
29.Awad AH, Mawla HA. Sedimentation with the Omeliansky formula as an accepted technique for quantifying air borne fungi. Polish Journal of Environmental Studies. 2012;21(6):1539-1541
30.World Health O. Guidelines on Core Components of Infection Prevention and Control Programmes at the National and Acute Health Care Facility Level. Geneva, Switzerland: World Health Organization; 2016
31.Storr J, Twyman A, Zingg W, et al. Core components for effective infection prevention and control programmes: New WHO evidence-based recommendations. Antimicrobial Resistance & Infection Control. 2017;6(1):6
32.Nevalainen A, Morawaska L. Biological Agents in Indoor Environments. Assessment of Health Risks. Work Conducted by a WHO Expert Group between 2000-2003. Copenhagen, Denmark: World Health Organization; 2009
33.Wanner H-U, Gravesen S. Biological particles in indoor environments: European Collaborative Action. Indoor Air Quality & Its Impact on Man. Report No. 12. Luxembourg: Commission of the European Communities, Directorate General for Science, Research and Development. Joint Research Institute - Environment Institute. 1993
34.Cabo Verde S, Almeida SM, Matos J, et al. Microbiological assessment of indoor air quality at different hospital sites. Research in microbiology. 2015;166(7):557-563
35.Mohammed B, Haruna I. Assessment of indoor air bacterial load and antibiotic susceptibility profile of bacteria from some hospitals in Dutse, Jigawa state. Bayero Journal of Pure and Applied Sciences. 2021;12:57-66
36.Bhatia L, Vishwakarma R. Hospital indoor airborne microflora in private and government-owned hospitals in Sagar City, India. World Journal of Medical Sciences. 2010;5(3):65-70
37.Qudiesat K, Abu-Elteen K, Elkarmi A, Hamad M, Abussaud M. Assessment of airborne pathogens in healthcare settings. African Journal of Microbiology Research. 2009;3(2):066-076
38.Kumari DN, Haji TC, Keer V, Hawkey PM, Duncanson V, Flower E. Ventilation grilles as a potential source of methicillin-resistant Staphylococcus aureus causing an outbreak in an orthopaedic ward at a district general hospital. The Journal of Hospital Infection. 1998;39(2):127-133
39.Wemedo S, Ede P, Chuku A. Interaction between building design and indoor airborne microbial load in Nigeria. Asian Journal of Biological Sciences. 2012;5:183-191
40.Nasiri N, Gholipour S, Akbari H, et al. Contamination of obsterics and gynecology hospital air by bacterial and fungal aerosols associated with nosocomial infections. Journal of environmental health science & engineering. 2021;19(1):663-670
41.Awosika SA, Olajubu FA, Amusa NA. Microbiological assessment of indoor air of a teaching hospital in Nigeria. Asian Pacific journal of tropical biomedicine. 2012;2(6):465-468
42.Diriba L, Kassaye A, Yared M. Antibiotics susceptibility pattern of hospital indoor airborne bacteria in Hawassa university teaching and referral hospital, South Ethiopia. International Journal of Modern Chemistry and Applied Science. 2016;3(1):287-292
43.Tesfaye T, Berhe Y, Gebreselassie K. Microbial Contamination of Operating Theatre at Ayder Referral Hospital. Northern Ethiopia; 2015
44.Asif A, Zeeshan M, Hashmi I, Zahid U, Bhatti MF. Microbial quality assessment of indoor air in a large hospital building during winter and spring seasons. Building and Environment. Elsevier BV; 2018;135:68-73
45.Park DU, Yeom JK, Lee WJ, Lee KM. Assessment of the levels of airborne bacteria, gram-negative bacteria, and fungi in hospital lobbies. International Journal of Environmental Research and Public Health. 2013;10(2):541-555
46.Chaivisit P, Fontana A, Galindo S, et al. Airborne bacteria and fungi distribution characteristics in natural ventilation system of a University Hospital in Thailand. Environment Asia. 2018;11(2)
47.Opollo MS, Otim TC, Kizito W, et al. Infection prevention and control at lira university hospital, Uganda: More needs to Be done. Tropical Medicine and Infectious Disease. 2021;6(2):1-11
48.Oppong TB, Amponsem-Boateng C, Kyere EKD, et al. Infection prevention and control preparedness level and associated determinants in 56 acute healthcare facilities in Ghana. Infection and Drug Resistance. 2020;13:4263-4271
49.Wasswa P, Nalwadda CK, Buregyeya E, Gitta SN, Anguzu P, Nuwaha F. Implementation of infection control in health facilities in Arua district, Uganda: A cross-sectional study. BMC Infectious Diseases. 2015;15:268
Written By
Zemachu Ashuro, Gose Husen Washo and Kuma Diriba
Submitted: 08 April 2023Reviewed: 22 April 2023Published: 11 July 2023
 Open access peer-reviewed chapter