Open Access is an initiative that aims to make scientific research freely available to all. To date our community has made over 100 million downloads. It’s based on principles of collaboration, unobstructed discovery, and, most importantly, scientific progression. As PhD students, we found it difficult to access the research we needed, so we decided to create a new Open Access publisher that levels the playing field for scientists across the world. How? By making research easy to access, and puts the academic needs of the researchers before the business interests of publishers.
We are a community of more than 103,000 authors and editors from 3,291 institutions spanning 160 countries, including Nobel Prize winners and some of the world’s most-cited researchers. Publishing on IntechOpen allows authors to earn citations and find new collaborators, meaning more people see your work not only from your own field of study, but from other related fields too.
To purchase hard copies of this book, please contact the representative in India:
CBS Publishers & Distributors Pvt. Ltd.
www.cbspd.com
|
customercare@cbspd.com
Healthcare in Colombia is financed by the government through insurers (“EPSs” or Entidades Promotoras de Salud). Under the current system funds are distributed to EPSs through a risk-adjustment system using age/sex and geographic location. The current system has many short-comings that have required the development of work-arounds to ensure that EPSs are adequately compensated for high-risk members. Many countries use a condition-based risk adjustment system. We develop and test the accuracy of a total of seven different models (including two models that proxy the current Colombian system for comparative purposes). By including high-risk conditions in the risk-adjustment model the proposed system would treat all insurers and members equally and remove the need for special payments. In this chapter we explore the development of such a condition-based risk-adjustment system, discuss some of the issues that it raises and suggest ways that they may be addressed.
Department of Statistics and Applied Probability, University of California Santa Barbara, CA, USA
Santa Barbara Actuaries Inc, Santa Barbara, CA, USA
Tamim Ahmed
Santa Barbara Actuaries Inc, Santa Barbara, CA, USA
*Address all correspondence to: duncan@pstat.ucsb.edu
1. Introduction
Colombian Law 100 of 1993 created the current healthcare system, known as Sistema General de Seguridad Social en Salud (SGSSS) [1]. The current Colombian Risk-adjustment methodology is summarized in [1, 2]. A more detailed treatment (in Spanish) can be found in [3]. Colombian workers pay a healthcare tax to the central authority (12.5% of a quantity called IBC (Ingreso Base de Cotización), determined by salary and contract modality). The SGSSS is financed via a central authority that distributes tax revenue in the form of risk-adjusted payments to insurers [4]. Benefits, known as Plan de Beneficios en Salud (PBS) were defined in Statutory law 1751 of 2015 [5]. EPSs are compensated based on the age, sex and territory distribution of their members (“affiliates”). In addition to age/sex/territory adjusted payments EPSs also benefit from payments for non-PBS services (presupuestos máximos and recobros) or payments that recognize disproportional incidence of certain high-cost conditions (including but not limited to cancer, human immunodeficiency virus (HIV) and stage 5 chronic kidney disease (CKD)). Two major payment systems coexist within the SGSSS: contributory and subsidized regimes. Unemployed affiliates and those in informal employment are covered by the subsidized regime directly from tax revenue and do not pay contributions into the system. Most Colombian citizens that are formally employed are covered by the contributory regime and pay a healthcare tax to the central authority. According to the Ministry, the subsidized and contributory regimes cover approximately 24.0 and 24.6 million people respectively [6]. In this chapter we focus on the Contributory Regime.
Allocation of the healthcare budget in the Colombian system is made through capitation payments (Unidad de Pago por Capitación) or UPC. The UPC is a fixed amount of money per year paid prospectively to the EPSs for the reimbursement of healthcare services. The basis of the current risk adjustment system is a benchmark enrollee whose “cost structure” (estructura de costo) is equal to 1.0. The UPC differs by regime and is updated annually. For 2021, the UPC for the contributory regime (UPC-C) was set at $989,712COP/year [2].1
The indicated increase in the UPC is calculated yearly by the health ministry using the Loss-Ratio method as follows:
Where the PermissibleLossRatio is set by the Colombian government for each regime (90% (Contributory) and 92% (Subsidized)). The Projected (or Expected) Claims cost in the projection period is defined as: Loss0×1+IBNR×1+τ×1+f,
Where:
IBNR is a factor used to account for incurred but not reported claims.
τ is a cost inflation factor constructed with information from the Colombian Statistics Department (DANE).
f is a trending factor to capture the increase in utilization frequency of healthcare services, estimated using a time series methodology.
The quantity Inclusions is used to account for the introduction of new technologies and therapies. Finally, the quantity Lossobs is the paid total claims cost (without IBNR). The IndicatedUPCChange is compared to the Government’s available budget and the resulting basic UPC for the applicable period, for each regime is then announced annually in a resolution issued by MinSalud.
To compensate the EPSs for the financial risk of their affiliates, MinSalud applies a prospective risk-adjustment system. The system is “prospective,” meaning that a member’s risk is calculated based on his prior period disease burden and is not affected by newly-emerging conditions. Age, sex and territory type classifications are found in Appendix A.1.2 In addition to the basic risk-adjustment reimbursement the Ministry has developed an increasing number of extra-system payments for expenses not addressed by the risk adjustment system. This accretion of special ex-post reimbursements dilutes the incentives of a prospective risk-adjustment system leading to development of a new system. Additional payments are made for:
Contributory EPSs that have a disproportionate prevalence of affiliates 50 and older.
Restrospective High-Cost fund adjustments for affiliates that suffer from CKD, HIV, 11 different types of cancer and severe Hemophilia.3
Recoveries (recobros) and maximum budgets (presupuestos máximos) are used to make payments for services not included in the PBS.
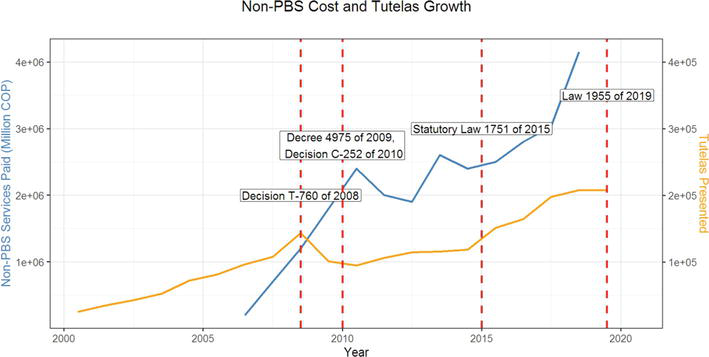
The exclusion of certain health services, prescriptions and technology from the PBS has given rise to appeals for payments for services not included in the PBS (tutelas). A steep increase in the number of tutelas (yellow line and right-hand scale in Figure 1) has led to cost of services increasing from 200 billion COP in 2006 to 1800 billion COP in 2009 (blue line and left-hand scale in Figure 1).4
Figure 1.
Evolution of Tutelas and non-PBS costs [8, 9, 10].
A condition-based risk-adjustment system is a valuable tool to enhance the accuracy of EPS reimbursement by making reimbursement more specific to individual burden of disease, aligning incentives, reducing some of the bureaucratic burden present in the SGSSS and improving the reporting of diagnoses.
The current age/sex/territory risk adjustment system imposes the national distribution of conditions within each cell on each EPS. An EPS is reimbursed the cost of an average member of an age/sex/territory cell, irrespective of the EPS’s distribution of conditions within its own population. An EPS with a prevalence of more or higher-severity conditions than the national average for a particular cell will be under-compensated (unless additional payments are received). This problem can be addressed by embedding a condition-based model into the risk-adjustment system. The current age/sex/territory risk adjustment system also creates an incentive for insurers to enroll healthier individuals [11, 12, 13].
4. Developing the condition-based risk adjustment model
4.1 Data
We merged four anonymized datasets provided by MinSalud and ADRES:
Enrollment data were extracted from a database known as Base de Datos Única de Afiliados (BDUA).5 PBS Claims were obtained from Base de Datos del Estudio de Suficiencia (BDES) and non-PBS claims were provided by ADRES. Data were merged as shown in Table 1.
Dataset
Years
Variables used
Enrollment
2017–2019
Affiliate’s Anonymized Identifier, Sex, Date of Birth, Status, Territory of Residence, Date of Entry
PBS Claims
2017–2019
Anonymized Identifier, Primary Diagnosis Code, Secondary Diagnosis Code, Procedure Code, Claim Cost, Date of Entry
Non-PBS Claims (Prescriptions)
2017–2019
Affiliate’s Anonymized Identifier, Claim Cost, Date of Entry
Non-PBS Claims (Other Services)
2017–2019
Affiliate’s Anonymized Identifier, Claim Cost, Date of Entry
One of the most important components of a risk-adjustment model is a diagnosis mapping (in the United States and some other countries referred to as a “Grouper Model” as it groups detailed diagnosis codes into diagnostic categories). A diagnosis mapping is a many-to-one function that takes a given set of diagnostic codes and groups them into diagnosis categories or groups. For this project we developed diagnosis categories adapted to Colombian diagnostic coding practices.
The organizations within the Colombian Health Care System follow a modified version of the 10th revision of the WHO’s International Classification of Diseases (ICD-10).6,7 The US Centers for Medicare and Medicaid Services (CMS) provide a comprehensive set of algorithms called the Chronic Condition Warehouse (CCW).8 We used the CMS clinical definitions as the basis for the Colombian diagnosis mapping using the 255 diagnosis groups in the CCW. Diagnostic codes collected by MinSalud comprise 4 characters (compared to 7 in the WHO and US systems). We mapped the 4-digit diagnosis codes into CCS categories and compared with a mapping of 7-digit codes to determine all possible 4-digit code mappings. By evaluating the frequency of all possible mappings, we manually determined the CCS for each 4-digit code. Finally, Colombian ICD-10 codes that do not correspond to US ICD-10 codes were assigned manually based on clinical criteria.
A risk-adjustment model can be classified as a supervised learning model: we use a dataset of the form, where xi=xi1xi2…xipT refers to the explanatory input variables of the i-th individual and yi to its respective response variable.9 The objective is to approximate a functional dependence between y and x. That is
Ĉi=fxiθ̂.E2
In the previous equation, Ci is the average cost per month incurred by the i−th individual (summing PBS and non-PBS claims). Note that we may write Ci=minCic+max0Ci−c,where c is a hyperparameter. We used a linear model for minCic and spread the costs above c uniformly across the population. In consequence, f takes the following functional form
fxiθ̂=min̂Cic+max̂0Ci−c=xiTβ̂+γ̂cE3
where β̂=argminβ∑imiminCic−xiTβ2 and γ̂c=1MM∑imimax0,Ci−c. Here, xi corresponds to the attributes of the i−th individual (age sex and territory in the experience period (2019) and condition groups in the baseline period (2017)). mi is the number of months active in the experience period of the i-th individual and MM=∑imi.
To obtain the risk weights, which enable the user to compute the risk scores, associated to each of the features in x, the quantities β̂ and γ̂c are normalized by the weighted mean of individual average claim costs in the experience year C¯=1MM∑imiCi, (obtaining)
w=β̂C¯,E4
(and)
wc=γ̂cC¯.E5
To develop a condition-mapping system we took into account the 10 principles of risk-adjustment systems [13]. Principle 9 was not followed absolutely but a coverage of 99.8% of the diagnoses in the claims dataset was achieved. We applied judgment to balance the tradeoffs among other principles.
Diagnostic categories should be clinically meaningful.
Diagnostic categories should predict medical expenditures.
Diagnostic categories should have adequate sample sizes to permit stable estimates.
Hierarchies should be used to characterize the illness level within each disease process.
Diagnostic classification should encourage specific coding.
Diagnostic classification should not reward coding proliferation.
Providers should not be penalized for recording additional diagnoses.
Classification system should be internally consistent.
Discretionary diagnostic codes should be excluded.
For estimation we applied a cap c at the 0.999 percentile (c=6,612,859COP/month) obtaining:
C¯=$88,338COP/month
γ̂c=$7,035COP/month,(wc=0.079).
For presentation purposes the quantity wc was added to the age/sex risk weights to obtain the table in Appendix B.1.11 The territory risk weights of the model are presented in Appendix B.212 and the selected condition variables are presented in Appendix B.313 with their respective risk weights.
7. Accuracy assessment of the proposed condition-based risk-adjustment model
To assess the accuracy of the risk-scoring model developed in the previous section, we contrasted the model with other models including two implementations of the current Colombian risk-adjustment system using the procedures described in a Society of Actuaries publication [14]. Accuracy of the models is compared in terms of the coefficient of determination metric (R2), mean average error (MAE), predictive ratios, tolerance curves, and the area under the curve. In this section, the implemented models and testing procedure are explained in detail.
Seven models (M1–M7) were implemented for comparison purposes. The following table summarizes the seven models implemented together with notes on the implementation of each model and its rationale.
Parameters and predictive accuracy values for Models 4–7 are found in Appendices B–F (Table 2).14
Model
Description
M1
Assigns a risk score of 1.0 to all individuals.
M2
Current Colombian risk-adjustment system, adding recobros (recoveries) (non-PBS) costs in an individual fashion.
M3
Current Colombian risk-adjustment system, adding the mean of the recoveries.
M4
Age, sex, territory model recalibrated on a 75% training sample of the full experience year dataset.
M5
Age, sex, territory, and the following conditions: Diabetes, hypertension, CKD, HIV, cancers, and coagulation and hemorrhagic disorders.
M6
Condition-based risk-adjustment model calibrated setting c at the 0.975 percentile.
M7
Condition-based risk-adjustment model described in the previous subsections.
Table 2.
Models included in the comparison procedure.
8.1 Model M1
This model is equivalent to assigning a regime-wide average cost per member per month for each affiliate. This model provides a baseline for comparison with other models.
8.2 Model M2
Model M2 mimics the Colombian risk-adjustment system that was in force before the introduction of the maximum budget law in 2020. The compensation amount (normalizing by C¯) for the i-th individual is given by:
r̂i=1C¯differentiali×UPCt−2+C¯i,t−2non−PBS,E6
where differentiali corresponds to the age/sex/territory-differential of the i-th individual and C¯i,t−2non−PBS corresponds to the monthly average cost of recoveries (recobros) of the i-th individual and the subscript t−2 corresponds to the experience period (2019).
8.3 Model M3
Because the prospective compensation known as maximum budgets (presupuestos máximos) is applied at the EPS level, it is hard to implement the maximum budgets compensation at an individual level. Instead we compute the contributory regime-level recoveries cost (C¯t−2non−PBS, note the absence of i in the subscript)15 and replace the individual-level recoveries cost C¯i,t−2non−PBS in the previous formula with the mean cost C¯t−2non−PBS. The compensation amount (normalizing by C¯) is given by:
r̂i=1C¯differentiali×UPCt−2+C¯t−2non−PBS.E7
8.4 Model M4
Model M4 is an age/sex/territory model calibrated on a sample of the full experience dataset. As the number of variables involved in an age, sex and territory model is considerably smaller compared the number of variables present in a condition-based risk-adjustment model, the computational resources required to develop an age/sex/territory-based risk-adjustment model is significantly lower. Also, a model of this type is less subject to manipulation (upcoding) by the insurers and providers of a system which is the reason that this risk-scoring model is indicated to conduct budget projections. An important use of model M4 is its application to new entrants and enrollees whose baseline period condition data is not available.
8.5 Model M5
Models M5, M6 and M7 are condition-based risk-scoring models, built in the same manner with the exception that model M5 includes fewer condition categories and the censoring threshold c was lower for model M6. A model with considerably fewer conditions was fitted to provide an alternative to the developed model and to quantify the precision cost of including fewer conditions.16 The chosen condition categories are available in the Table 3.
The cap chosen for model M5 was the same as the model M7 (c=$6,612,859COP/month).
8.6 Model M6
Model M6 applies a method similar to a stop-loss process. Because the individual average monthly claim costs variable is skewed and possesses a heavy tail, the hyperparameter c plays a role in the calibration process: Imposing a more restrictive cap on the independent variable (individual average monthly claim cost) increases the stability of the estimated risk scores by eliminating more outliers but might decrease the precision of the risk-adjustment model by allocating a higher portion of the claims evenly among all the individuals. Model M6 was calibrated using a lower cap c=$554,690COP/month (0.975 percentile) to illustrate this trade-off.
8.7 Model M7
As explained in Table 2 model M7 is the condition-based risk adjustment model presented in the preceding subsection which was built using a cap c=$6,612,859COP/month corresponding to the 0.999 percentile.
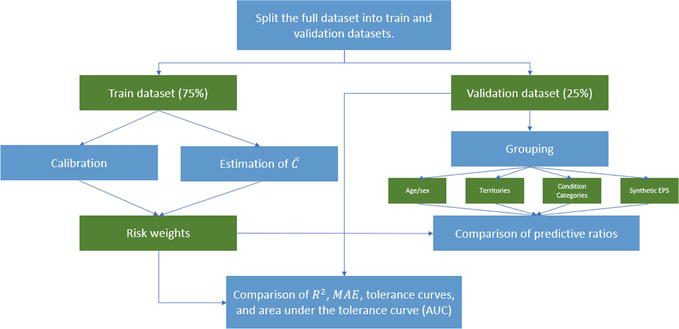
We compared the accuracy of the developed model (M7) against the models M1–M6. All the models M5, M6 and M7 were calibrated on the same 75% calibration sample, leaving the remaining 25% of the data for validation purposes. Even though the models M1, M2 and M3 did not undergo the same calibration procedure and model M4 was calibrated on a different dataset, all models will be tested on the same 25% validation dataset.
After calibrating (or implementing) models M1–M7, the predicted risk scores r̂i of the individuals in the validation dataset were obtained and compared in terms of the R2, MAE, tolerance curve and AUC metrics. Comparison of risk-scoring models is in terms of the predictive ratios of different sub-groups according to different characteristics. Appendix C17 provides a comprehensive list of the groups created for comparison purposes; groups were constructed based on age/sex, territory, selected conditions and synthetic EPSs. Synthetic EPSs were created because identification of actual EPSs was not possible. Synthetic EPSs consist of 300,000, 500,000, 1 million randomly sampled individuals from the validation dataset, as well as the full dataset itself (Figure 2).
Table 4 shows the results of the R2, MAE and AUC metrics with 1.0 and 3.0 cutoffs; Figure 3 shows the results of the tolerance curves and the predictive ratios are available in Appendix C.
Model
R2 (%)
MAE
AUC (1.0 Cutoff) (%)
AUC (3.0 Cutoff) (%)
M1
0.00
1.38
19.51
69.24
M2
71.22
1.01
45.93
74.83
M3
0.82
1.38
32.06
68.50
M4
0.91
1.22
44.19
74.27
M5
4.35
1.19
45.34
75.17
M6
4.92
1.09
43.28
76.73
M7
8.62
1.02
60.03
79.99
Table 4.
Model comparisons.
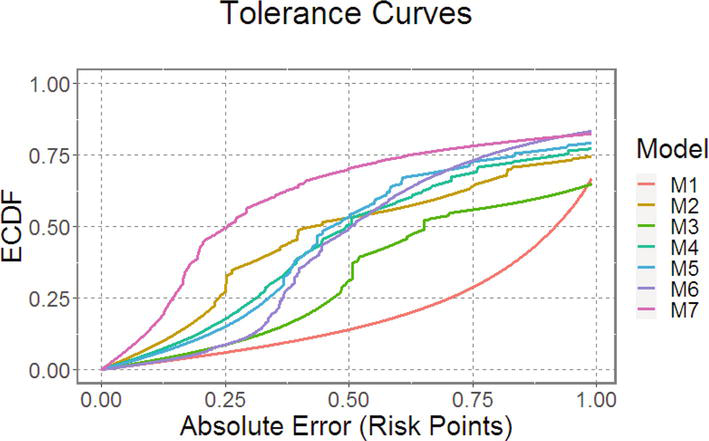
Figure 3.
Tolerance curves of the models.
In terms of the coefficient of determination metric R2, the model that performs best is M2. However, this result must be interpreted with care:
Model M2 mimics the retrospective compensation that was made for non-PBS services before the maximum budgets law. As discussed above, the cost of non-PBS services was growing in an uncontrolled manner, in part because of tutelas.
Section 5.3 of the Society of Actuaries study [14] illustrates how the R2 measure can be heavily influenced by only one extreme data point. Since it is the case that some non-PBS services have very high costs the high R2 score for model M2 is a consequence of a very specific compensation for recoveries and not from the model’s predictive power. When the individual compensation for recoveries is eliminated by implementing an average compensation for recoveries (model M3) the R2 metric drops from 71.22% to 0.82%.
With respect to the MAE metric, the models M2 and M7 perform equally well. The averages of the absolute differences between the predicted risk scores r̂i and the observed risk scores ri are the same.
So far, the R2 and MAE metrics seem to be favoring the model M2 over the model M7. However, the tolerance curves and the predictive ratios tell a very different story: The tolerance curve (see Figure 3) for the model M7 shows that around 50% of the individuals are predicted accurately within a range of 0.25 risk points, while for the model M2 around 32.5% of the individuals are predicted accurately within the same range. In fact, it is clear from the Figure 2 that the tolerance curve of the model M7 dominates that of the model M2 on a range of one risk point. This implies that model M7 predicts more individuals accurately on a narrow range than model M2. Also, model M7 presents a higher AUC score for both cut-offs (1.0 and 3.0).
M7 performs even better on predictive ratios than on the tolerance curves (see Appendix C). Based on the ±10% rule of thumb, the model M7 compensates reasonably well for all age/sex groups, while M2 only compensates well for 2 of 36 age/sex groups (males and females less than 5 years). Considering the territories partition, model M7 compensates reasonably well for all geographical zones, while model M2 compensates well for 1 out of 4 territories. For the selected conditions (diabetes, cancer, cardiac condition, HIV and hemophilia) model M7 compensates reasonably well 3 out of 5 conditions (diabetes, cardiac condition and HIV). The remaining 2 conditions (cancer and hemophilia) are within the 20% range. Model M2 undercompensates all of these conditions by more than 20% and by more than 40% for 4 of 5 conditions. Model M7 compensates all EPSs within a 1% range, while model M2 tends to over-compensate all the synthetic EPSs around 12%. The latter result is due to a difference in the age/sex/territory distribution of the enrollees in the validation dataset compared to that of the dataset used to compute the Colombian model’s differentials.
Hence, in terms of the precision of the reimbursement, we conclude that model M7 is more accurate than model M2. Model 7 has additional benefits when compared with existing models because it eliminates the need for the ex-post adjustments of the current system:
A risk-adjustment system based on this model (which is prospective and condition based) could eliminate the need for retrospective compensation for non-PBS services, which has created pressure in the Colombian healthcare system. Reducing the need of retrospective compensations would generate a positive externality as tutelas create a degree of burden in Colombian courts.18
Model 7 also eliminates the need for the adjustments for homologous services because the system reimburses prospectively for all non-PBS services.
Model 7 addresses the need for a high-cost account adjustment which corrects the imbalance in the distribution of high conditions among EPSs.
We draw other significant conclusions from the testing procedure:
Model M7 not only outperforms in terms of accuracy model M2 but also all the other implemented models (namely M1, and M3–M6).
Models M4 and M5 outperform (in terms of accuracy) model M3, which mimics the current compensation procedure in force at the time of writing. This result is important because model M5 offers an easier-to-operate condition-based risk adjustment system, less precise than M7 however, maintaining the prospective compensation for non-PBS services and reducing the need for the ex-post adjustments.
Model M4, which is an age/sex/territory-based risk-adjustment model, is indicated to perform budget projections and is proposed as a temporary model for the subsidized regime because of the absence of subsidized regime claims.
Model M7 outperforms model M6 in terms of accuracy. This shows that the selected cap parameter c, set at the 0.999 percentile is better than a cap parameter set at the 0.975 level.
Model M5 tends to undercompensate individuals in the validation dataset. This might be due to differences between the claim costs for the individuals for which there exist data in the baseline period and those for which that data is not available.
11. Discussion
We developed a condition-based risk adjustment system for Colombia that unifies the multiple different funding streams currently in place in Colombia. The model performs well and out-performs in accuracy other alternative models.
The Ministry expressed concerns about three operational aspects of the model: maintaining Quality, avoiding fraud and abuse and ensuring EPS stability.
Quality: a condition-based risk adjustment system is designed to avoid selection by insurers against severely ill members. However, there is some evidence in other countries that profit-maximizing insurers select healthier members and reduce services to sicker patients that need them most. To address this concern we propose a quality reporting system (in addition to the proposed risk adjustment system) for patients with certain conditions, based on treatment guidelines of relevant professional societies.
The issue of fraud and abuse is more difficult to solve. There has been a robust discussion recently in the United States on the topic of how risk adjustment in the Medicare Advantage program encourages over-coding of conditions [15, 16, 17, 18, 19, 20]. Avoiding over-coding requires a robust audit and benchmarking function.
While we do not anticipate that transition to a full condition-based adjustment system will result in instability in the market we proposed (as an option) an internal reinsurance arrangement where insurers that experience gains relative to their UPCs contribute to a pool to reimburse insurers that experience losses relative to their UPCs. However, the reinsurance market in Colombia is well-developed and insurers may purchase reinsurance as a hedge against adverse results.
The accuracy of the model is affected by provider claims coding accuracy, as well as the truncated (4-digit) nature of Colombian coding. Coding is not under the control of MinSalud; however, EPSs could provide incentives for more complete and accurate coding, given its importance to the EPS’s revenue. Such incentives would have to be carefully monitored, given the possibility that they would drive over-coding.
12. Conclusion
We have demonstrated the construction of a condition-based risk adjustment system for the Contributory sector of Colombia’s health insurance system using data and resources readily available to MinSalud. We were unable to construct a condition-based system for the Subsidized sector due to lack of credible claims data for this sector. The proposed condition-based system outperforms the current and alternative models in terms of accuracy while also addressing the numerous ex-post adjustments currently paid.
Acknowledgments
The work that formed the basis for this chapter was supported by ANIF (Asociación Nacional de Instituciones Financieras), Bogota Colombia D.C.
References
1.Maria MSS et al. El Sector Salud En Colombia: Riesgo Moral Y Selección Adversa En El Sistema General De Seguridad Social En Salud (Sgsss). 2009
2.Duncan I. Healthcare Risk Adjustment and Predictive Modeling. 2nd ed. New Hartford CT: Actex Publications; 2018
3.Ministerio de Salud. Aplicación de la Metodología para la Definición del Presupuesto Máximo a Transferir a las Entidades Promotoras de Salud de los Regímenes Contributivo y Subsidiado y a las Entidades Obligadas a Compensar – EOC, en la vigencia, Dirección de Beneficios Costos y Tarifas de Aseguramiento en Salud, Editor. Ministerio de Salud: Bogotá D.C. 2020
4.Nuñez J, Zapata J, Castañeda C, Fonseca SM, Ramírez J. La Sostenibilidad Financiera Del Sistema De Salud Colombiano -Dinámica Del Gasto Y Principales Retos De Cara Al Futuro. Bogota DC: Fedesarollo Centro de Investigacion Economica y Social; 2012
5.Colombian Health Ministry (Minsalud). Statutory Law 1751: Por Medio De La Cual Se Regula El Derecho Fundamental A La Salud Y Se Dictan Otras Disposiciones. Bogota DC; 2015
6.National Administrative Department of Statistics of the Republic of Colombia. Cifras de Aseguramiento en Salud, Ministry of Health and Social Protection of the Republic of Colombia, Editor. Ministry of Health of Colombia: Bogota D.C. Colombia. 2021
7.Colombian Health Ministry (Minsalud). Resolución 1479. Bogota DC. 2015
8.Government of Colombia. Informe Anual Acciones de Tutela en Salud Vigencia 2020, Orden 30 de la Sentencia T-760 de 2008, Ministry of Health and Social Protection of the Republic of Colombia, Editor. Ministry of Health and Social Protection of the Republic of Colombia, Bogota D.C. 2021
9.Government of Colombia. Informe de Rendición de Cuentas 2019–2020, Administradora de los Recursos del Sistema General de Seguridad Social en Salud, Editor. Administradora de los Recursos del Sistema General de Seguridad Social en Salud: Bogota D.C. 2020
10.Administradora de los Recursos del Sistema General de Seguridad Social en Salud. 04 de February de 2019. Available from: https://servicios.adres.gov.co/Inicio/Post/6150/ADRES-pag%C3%B3-3-13-billones-por-servicios-no-incluidos-en-el-plan-de-beneficios-en-salud-en-2018
11.Kronick R, Welch WP. Measuring coding intensity in the medicare advantage program. Medicare and Medicaid Research Review. 2014;4(2):E1-E19
12.Pope GC, Kautter J, Ingber MJ, Freeman S, Sekar R, Newhart C. Evaluation of the CMS-HCC Risk Adjustment Model. Research Triangle Park North Carolina: RTI International for CMS; 2011
13.Pope GC, Kautter J, Ellis RP, Ash AS, Ayanian JZ, Iezzoni LI, et al. Risk adjustment of Medicare capitation payments using the CMS-HCC model. Health Care Financing Review. 2004;25(4):119-141
14.Hileman G, Steele S. Accuracy of Claims Based Risk Scoring Models. Schaumburg, IL: Society of Actuaries; 2016. p. 90
15.Berwick D, Gilfillan R. The emperor still has No clothes: A response to Halvorson and Crane, in Health Affairs Forefront. Health Affairs. 2022
16.Halvorson G, Medicare advantage delivers better care and saves money: A response to Gilfillan and Berwick, in Health Affairs Forefront. Health Affairs. 2022
17.Crane D, The important roles of Medicare advantage and direct contracting: A response to Gilfillan and Berwick, in Health Affairs Forefront. Health Affairs. 2022
18.Kang J Duncan I, Huynh N. Making the right diagnosis: A response to Berwick and Gilfillan, in Health Affairs Forefront. Health Affairs. 2022
19.Gilfillan R, Berwick D., Medicare Advantage, Direct Contracting, And The Medicare ‘Money Machine,’ Part 1: The Risk-Score Game, in Health Affairs Considering Health Spending. People to People: Baltimore MD. 2021
20.Gilfillan R, Berwick D. Medicare Advantage, Direct Contracting, And The Medicare ‘Money Machine,’ Part 2: Building On The ACO Model, in Health Aff (Millwood). People to people: Baltimore MD. 2021
Notes
The transfers are made weekly within the contributory regime and monthly within the subsidized regime.
Homologous is a fraction of the premium allocated to the PBS but used to pay for services not included in the plan as required by the resolution 1479 of 2015.
Detailed files may be found at the following: https://github.com/judmejiabe/supplementary-material-col-ch.
The redistribution mechanism for severe hemophilia A is carried out by ADRES.
https://servicios.adres.gov.co/Inicio/Post/6150/ADRES-pag%C3%B3-3-13-billones-por-servicios-no-incluidos-en-el-plan-de-beneficios-en-salud-en-2018 (Accessed: August 26, 2021).
See https://www.adres.gov.co/eps/procesos/bdua.
The Colombian Government’s diagnosis codes are accessible through https://www.minsalud.gov.co/sites/rid/Lists/BibliotecaDigital/Forms/DispForm.aspx?ID=6998 (Accessed: August 26, 2021).
The WHO provides a searchable database for ICD-10 codes (https://icd.who.int/browse10/2019/en). In the U.S. codebooks are provided by organizations such as the American Association of Professional Coders (www.aapc.com).
https://www2.ccwdata.org/ web/guest/condition-categories (Accessed: August 26, 2021).
In this case the explanatory variables are categorical while the response variables are continuous.
We were not able to follow principle 9 absolutely but achieved a coverage of about 99.8% of the diagnoses in the claims dataset (a higher percentage than is observed in a typical US risk adjustment application).
See https://github.com/judmejiabe/supplementary-material-col-ch.
See https://github.com/judmejiabe/supplementary-material-col-ch.
See https://github.com/judmejiabe/supplementary-material-col-ch.
See https://github.com/judmejiabe/supplementary-material-col-ch.
C¯i,t−2non−PBS was estimated to be $22,594.32COP/month.
See Appendix A2. for interpretation of these CCS Condition Categories.
See https://github.com/judmejiabe/supplementary-material-col-ch.
Written By
Ian Duncan and Tamim Ahmed
Submitted: 21 July 2023Reviewed: 23 July 2023Published: 07 September 2023
 Open access peer-reviewed chapter