Open Access is an initiative that aims to make scientific research freely available to all. To date our community has made over 100 million downloads. It’s based on principles of collaboration, unobstructed discovery, and, most importantly, scientific progression. As PhD students, we found it difficult to access the research we needed, so we decided to create a new Open Access publisher that levels the playing field for scientists across the world. How? By making research easy to access, and puts the academic needs of the researchers before the business interests of publishers.
We are a community of more than 103,000 authors and editors from 3,291 institutions spanning 160 countries, including Nobel Prize winners and some of the world’s most-cited researchers. Publishing on IntechOpen allows authors to earn citations and find new collaborators, meaning more people see your work not only from your own field of study, but from other related fields too.
To purchase hard copies of this book, please contact the representative in India:
CBS Publishers & Distributors Pvt. Ltd.
www.cbspd.com
|
customercare@cbspd.com
The cell serves as the fundamental building block of life, yet it operates as an extremely sophisticated chemical system. Single-cell analysis holds the potential to provide novel insights into cellular heterogeneity and their corresponding subpopulations at the genomic, transcriptomic, proteomic, and metabolomic levels. Mass spectrometry (MS) is a label-free technique that enables the multiplexed analysis of proteins, peptides, lipids, and metabolites in individual cells. By now, the application of electrophoresis in single-cell analysis by MS has become widespread. In this chapter, we will summarize the recent application advancements of electrophoresis in single-cell analysis by MS, with a particular focus on sampling, separation, and ionization. Additionally, we will discuss potential future research directions for utilizing electrophoresis in single-cell analysis by MS.
Jiangxi Key Laboratory for Mass Spectrometry and Instrumentation, East China University of Technology, Nanchang, P.R. China
Jiaquan Xu*
Jiangxi Key Laboratory for Mass Spectrometry and Instrumentation, East China University of Technology, Nanchang, P.R. China
*Address all correspondence to: jiaquan_xu@foxmail.com
1. Introduction
Cell is the basic unit of the organism’s structure and function [1], which has a close relationship with the occurrence, development, and treatment of diseases. Individual cells exhibit significant diversity due to a variety of factors, including genetic variations, fluctuations in biochemical processes, and differences in their microenvironment. Despite the homology between two cells, there can be significant variations in their intracellular material composition and content [2]. The conventional assessment of cell population can solely provide an average outcome regarding homeostasis and fails to depict the variances among individual cells. Consequently, single-cell investigation not only enhances our comprehension of cellular nature and life but also furnishes a more potent mechanism for disease diagnosis, categorization, therapy, and prognosis. However, the minute dimensions of the cells pose a challenge in terms of isolating individual cells and preparing samples for analysis. Due to the minuscule size, substances present within single cells are extremely scarce and exhibit significant concentration disparities spanning nine orders of magnitude [3], thereby exacerbating detection difficulties.
Among the single-cell analysis methods, fluorescence detection methods are highly sensitive and can detect single molecules with dynamic tracking ability [4, 5, 6, 7], but their detection flux is limited. Electrochemical detection has high temporal-spatial resolution [8, 9, 10, 11], but it cannot detect multiple molecules simultaneously due to the limitations imposed by the electrochemical window and the requirement for electrochemically active molecules. Mass spectrometry (MS) is a conventional method for molecule analysis with the advantages of high sensitivity, high throughput, and the ability to identify molecular structures [12, 13]. By leveraging an existing database, this method can qualitatively and quantitatively analyze tens of thousands of molecules at the same time while providing abundant information on their structure characters. However, the application of direct MS in single-cell detection faces challenges in terms of sample complexity and single-cell sensitivity due to the diverse range and limited content of chemical components within cells. Therefore, it is imperative to employ appropriate separation technology to improve the method's detection sensitivity and qualitative/quantitative accuracy.
Typically, in various omic studies, liquid chromatography (LC) and its derivatives, such as high performance liquid chromatography (HPLC), ultra performance liquid chromatography (UPLC) and nano liquid chromatography (nanoLC), are common separation techniques [14, 15]. However, LC may not be suitable for samples with limited volume due to the requirement of a larger injection volume (typically several microliters) [16]. On the contrary, electrophoretic separations like capillary electrophoresis (CE) possess distinct advantages compared to chromatographic methods. Since the late 1980s, CE has emerged as an exciting and promising microelectric separation technique due to its benefits such as minimal sample consumption, high resolution, rapid separation time, and cost-effectiveness. Various modes of CE including capillary zone electrophoresis (CZE), capillary isotachophoresis (CITP), capillary isoelectric focusing (CIEF), micellar electrokinetic capillary chromatography (MEKC), and capillary electrochromatography (CEC) have proven beneficial in pharmacology, food analysis, biomarker research, and biomolecular analysis [17, 18].
In this chapter, we will provide a comprehensive overview of the application of electrophoresis in single-cell MS, encompassing three main aspects. The first part starts with an introduction to the application of electrophoresis technology in single-cell sampling for MS analysis. The second part further describes how to utilize electrophoresis technology to separate the components within single cells, which are subsequently analyzed using MS. The final part provides a detailed explanation of the application of electrophoresis in the ionization source, enabling simultaneous separation and ionization of components within single cells.
2. Application of electrophoresis in sampling single cells for MS analysis
Sampling analytes from a single cell in MS analysis is a highly challenging task due to the small sizes of cells (usually several tens of micrometers in diameter for mammalian cells), limited cellular content volume, complex intracellular matrix, and rapid turnover. As a result, there have been numerous advancements aimed at enhancing sampling and extraction efficiency before conducting MS analysis.
2.1 Sucking contents from single cells for MS analysis
Sucking contents from individual cells for MS analysis is a commonly employed technique, typically involving the use of a nanospray/capillary tip to extract cell contents through either negative pressure or cellular pressure. For instance, Mizuno et al. devised a video-MS method for real-time single-cell analysis. In their investigation, they utilized a micromanipulator-mounted nanospray tip (with a diameter of 1–2 μm and coated with gold) to access the cytoplasm or organelles of live mammalian cells under microscopic observation. By connecting a tube-connected piston syringe, several hundreds of femtoliters of cellular contents were aspirated into the nanospray tip during sampling procedures [19]. To achieve direct analysis of target organelles in single cells, a method by combination of fluorescence imaging and live single-cell MS was developed Esaki et al. [20]. Initially, a mitochondria-specific fluorescent marker was utilized to visualize the location and condition of mitochondria within living cells. Subsequently, the stained mitochondria were selectively captured with a nanospray tip under fluorescence microscopy, enabling predominantly metabolite detection by live single-cell MS. Zhang et al. [21] utilized capillary microsampling in combination with electrospray ionization (ESI) MS and ion mobility separation to conduct metabolic analysis of various types of epidermal cells in Arabidopsis thaliana. Their research involved the use of a nanospray tip (with a diameter of 1 μm, uncoated with metal) to extract cytoplasm from individual plant cells through capillary action and turgor pressure.
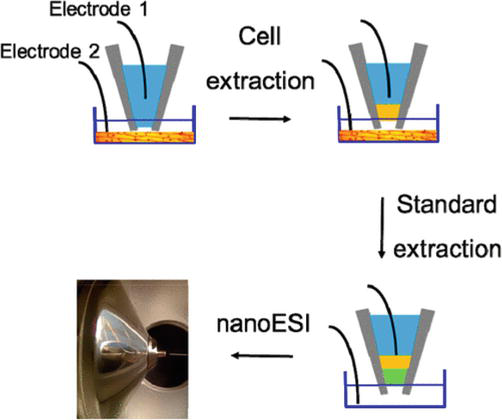
The precise control and measurement of the volume sampled from single cells is essential for accurate quantitation of the analytes at the single-cell level. Thus, Yin et al. developed a technique for sampling single cells using electroosmotic extraction with meticulous control [22]. The extraction nanopipette, with a tip diameter of less than 1 μm, was prepared by using a capillary puller, followed by the insertion of a Pt electrode. A counter electrode Pt was connected to the sample. In a typical sampling process (Figure 1), the nanopipette was filled with 5 μl of hydrophobic electrolyte solution, and during the piercing procedure, a voltage of +2 V (with electrode 1 as the positive pole) was applied between the two electrodes to effectively prevent solution aspiration into the tip. The nanopipette was then guided toward the cell at a speed of 400 nm/s using micromanipulation and microscopy while monitoring ion current between the electrodes. The moment the cell membrane was approached, a discernible modification in ion current became evident. After inserting the nanopipette into the cell, a voltage of −2 V (with electrode 1 as the negative pole) was applied between the two electrodes. This allowed for precise control over the suction volume of cytoplasm, facilitating subsequent analysis through nanoelectrospray ionization (nESI) MS. By incorporating an isotope internal standard, this technique facilitated quantitative analysis of metabolites from individual cells.
Figure 1.
Schematic diagram of electroosmotic suction of single cells for MS analysis. Electrode 1 was inserted into the nanopipette, while Electrode 2 was connected to the sample. The initiation of sucking contents from a single cell (yellow) involved applying a negative voltage between Electrode 1 and Electrode 2. Subsequently, a solution containing an internal standard (green) with a known volume was introduced into the nanopipette using electroosmotic extraction. Finally, the extracted analytes were analyzed by nESI-MS [22].
2.2 Extraction of analytes from single cells for MS analysis
The extraction strategy of analytes from single cells for MS analysis can be categorized into two methods. One method utilizes the solid-liquid microextraction (SLME) technique, while the other relies on liquid-liquid microextraction (LLME). The single-cell MS analysis techniques based on SLME involve probe electrospray ionization (PESI)-MS [23], direct sampling probe (DSP)-MS [24], and surface coated probe (SCP)-nESI-MS [25], and all of these procedures involve the utilization of a metal needle that has undergone surface treatment/modification/coating, which is then employed for the purpose of extracting and enriching analytes from an individual cell. The advantages of SLME are high spatial resolution and selectivity, while the disadvantage of SLME is low throughput. Nanomanipulation-coulped nanospray MS [26] and single-probe MS [27] are typical LLME-based single-cell MS techniques, which involve the utilization of solvent to extract and isolate analytes from individual cells. The strength of SLME lies in its high-throughput capability, while its limitation lies in the relatively lower level of selectivity.
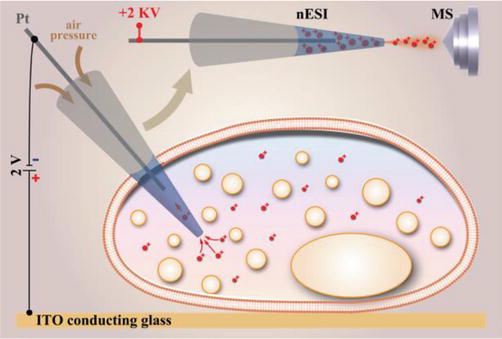
In cellular environments, the majority of biomolecules possess either positive or negative charges, which are determined by their biophysical characteristics and surrounding conditions. Consequently, when exposed to an external electric field, these charged biomolecules have the ability to migrate. Positively charged biomolecules tend to move toward the cathode, while negatively charged metabolites tend to move toward the anode, resulting in a polarity-specific separation process. As a result of this phenomenon, Song et al. [28] introduced probe electrophoresis as a sampling technique for single cells (Figure 2). To prepare the probe, a stainless steel needle coated with gold and featuring a 100 nm tip was inserted into a capillary with a 2 μm tip that had been pulled by laser. The distance between the tip of the needle and capillary was approximately 5 μm. Before the sampling procedure, the single cells were already deposited onto an indium-tin oxide (ITO) substrate that had been positioned correctly under the microscope. The probe containing 9 pl of water was then carefully inserted into a single cell using micromanipulation techniques under the microscope. After remaining in a state of quiescence for several seconds, during which any potential perturbations were eliminated, low DC voltage (±2 V) between the probe and conductive substrate was applied to generate strong electric fields (around 106 V/m) inside the cell due to their close proximity (about 5 μm).
Figure 2.
The schematic diagram of single-cell analysis by probe electrophoresis MS. The charged metabolites in a single cell were first extracted via electrophoresis by applying a voltage between Pt electrode and ITO conduction glass, followed by nESI-MS analysis. [28]
An electric field gradient with a magnitude of 1019 V2m−3 was created near the tip of the probe. This resulted in the movement of biomolecules with opposite charges in different directions: either upward toward the probe or downward toward the conductive substrate. To prevent electroosmotic flow, the back end of the probe was subjected to air pressure generated by a microinjector during electrophoretic sampling. Following extraction, the probe was taken out from the cell and directly utilized as a nESI emitter. The application of a high voltage (±2 kV) to the probe facilitated the generation of analyte ions for MS analysis. The findings indicated that the extraction efficiency was influenced by factors such as the magnitude and duration of extraction voltage, concentration of analytes, and dielectric constant of the electrolyte. Under optimal conditions, the method can achieve high throughput (≥200 peaks) and enhanced sensitivity (≥10-times signal enhancement for [Choline+H]+, [Glutamine+H]+, [Arginine+H]+, etc.) compared to direct nESI-MS.
3. Application of electrophoresis in separation of the analytes from single cells for MS analysis
The enhanced resolving abilities of CE have been effectively employed in intriguing biological studies conducted at the individual cellular level. These advancements in CE have significantly broadened our understanding of metabolites, proteins, and other relevant components. Currently, numerous literature reviews have comprehensively documented the utilization of CE-MS for analyzing single cells [29, 30].
3.1 Metabolites
Cellular metabolic analysis plays a crucial role in the examination of cells, offering insights into the physiological state of organisms and providing a fundamental understanding of their overall health. By utilizing the CE-MS technique, researchers have successfully established cell metabolism analysis as an effective tool for addressing various biomedical and clinical challenges. These include unraveling underlying physiological mechanisms, identifying pathogenic factors contributing to disorders, analyzing intricate biological samples, conducting drug screening experiments, discovering diagnostic biomarkers, and elucidating the mechanisms behind drug action and resistance.
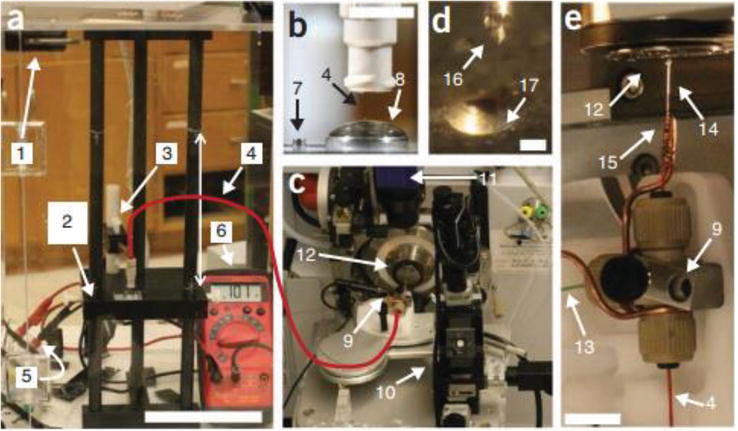
Nemes et al. [31] proposed a detailed protocol for investigating and quantifying metabolites in individual isolated neurons through the utilization of single-cell CE combined with electrospray ionization time-of-flight MS (Figure 3). The procedure necessitated approximately 2 hours for preparing the sample, isolating neurons, and extracting metabolites, and an additional hour for measuring metabolism. By utilizing this method, over 300 distinct compounds within the mass range of typical metabolites were detected in various individual neurons ranging from 25 to 500 μm in diameter. A subset of identified compounds was found to be adequate for revealing metabolic differences among freshly isolated neurons of different types as well as changes in the metabolite profiles of cultured neurons. Using the CE-MS approach combined with whole-cell patch clamp, Aerts et al. successfully detected 60 metabolites from only 3 pl of cytoplasm within a single cell. This technique allowed them to observe differences in the metabolome of heterogeneous cells within the brain by analyzing samples obtained from specific cellular structures [32].
Figure 3.
Experimental setup of the single-cell CE-ESI-MS system. (a) the front view of the CE platform: (1) the enclosure equipped with a safety door; (2) platform for sample loading; (3) a holder that allows manual positioning of the separation capillary; (4) the separation capillary; (5) a resistor connected in series to a stable high-voltage power supply and the CE platform; (6) a digital multimeter connected in parallel to measure voltage drop on the resistor. The scale bar is 10 cm. (b) A magnified view of the sample-loading platform includes (7) a sample-loading vial and (8) an electrolyte-containing vial with the separation capillary positioned 2 mm below the electrolyte meniscus. The scale bar is 1 cm. (c) A distant view of the CE-ESI-MS ion source consists of (9) the CE-ESI interface equipped on (10) a three-axis translation stage; (11) CCD camera; and (12) inlet of mass spectrometer. (d) A magnified view shows (16) the stable Taylor cone (17) and the orifice of the mass spectrometer sampling plate. The scale bar is 500 μm. (e) Close-up view of the CE-ESI-MS ion source highlighting a T-union that houses fused silica capillaries for CE separation and (13) ESI sheath solution delivery, as well as (14) a metal emitter grounded through (15) a copper wire. The scale bar is 1 cm [31].
Onjiko et al. [33] developed a CE-ESI-MS method to analyze metabolites in the genome expression of various cell types. They identified 40 metabolites from Xenopus laevis embryos at the 16-cell stage, which had distinct tissue fates. The findings indicated that certain metabolites exhibited varying levels of activity among wild-type and unperturbed embryos’ cell types. Advancements also have been achieved by this research group in the analysis of embryo metabolism, which is a difficult task due to its diminishing cell sizes and intricate three-dimensional transformations. They successfully conducted metabolic analysis on live frog embryos by incorporating capillary microsampling, micro-scale metabolite extraction, and CE-ESI-MS techniques, resulting in the identification of 230 distinct molecular characteristics. This approach has expanded the potential for acquiring more profound understanding of the process of embryonic development [34].
CE-MS also has been utilized in the metabolism analysis of plants and microbes. The physiological metabolism of these organisms is greatly influenced by environmental conditions, but there remains limited knowledge regarding the impact of such factors on their dynamic metabolic changes. To address this gap, a CE-MS approach was employed to analyze the transcript and metabolism of Synechocystis sp. PCC 6803 under nitrogen starvation [35]. The simultaneous analysis of 161 metabolites in Synechocystis sp. PCC 6803 was conducted before and after nitrogen depletion. The study revealed that the levels of glycogen and downstream metabolites involved in sugar breakdown increased during nitrogen starvation in Synechocystis sp. PCC 6803, thereby reconciling the discrepancy between upregulated sugar catabolic genes and glycogen accumulation observed in this unicellular cyanobacterium.
3.2 Proteins
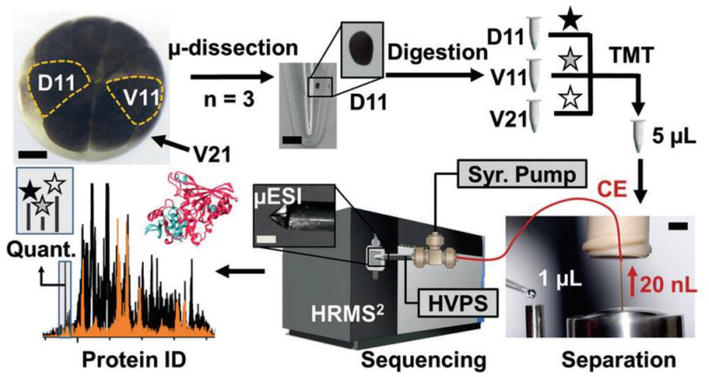
The utilization of CE has greatly enhanced our understanding of the proteome in individual cells. Lombard-Banek et al. [36] conducted a pioneering quantitative proteomics investigation on blastomeres, identifying and quantifying 438 protein groups across three distinct types: D11, V11, and V21. Interestingly, it is noteworthy that the majority of proteins found in individual blastomeres of the same cell type (such as D11) exhibited a significant degree of overlap. However, there were a few instances where protein expression did not coincide, which could potentially indicate divergent developmental paths for the daughter cells originating from these specific blastomeres. Moreover, their research focus then shifted toward examining blastocyst cells within the 16-cell Xenopus embryos (Figure 4) [37]. The single blastocyst cells were isolated through microdissection and underwent pre-treatment procedures, including cell lysis, protein reduction, alkylation, and overnight enzymatic hydrolysis. The proteins were then analyzed qualitatively and quantitatively using CE, microelectrospray ionization, and high-resolution mass spectrometry (CE-μESI-HRMS). The study achieved coverage of approximately 30% of the predicted proteome for individual X. laevis blastomeres, with the identification of 1630 proteins from only 20 ng of non-vitelline proteins in a single blastocyst cell measuring about 150 μm in diameter. Figure 5 presented an alternative approach developed by this team, which involved the integration of subcellular capillary microsampling, one-step protein extraction and digestion, peptide separation using CE, ionization through electrokinetically pumped nanoelectrospray, and detection using high-resolution Orbitrap MS. This method enabled the direct analysis of proteomics in individual live cells, specifically in vertebrate embryos. This breakthrough represented a significant advancement as it overcame the limitation that MS was not compatible with complex tissues. The study eventually identified and quantified approximately 750–800 protein groups with exceptional sensitivity and accuracy in detection. Moreover, this technology demonstrated its scalability for application in live zebrafish embryos [38].
Figure 4.
Microanalytical process that allows for the simultaneous quantification of multiple proteins in individual cells within the 16-cell Xenopus embryo. This approach involves microdissection, micro-scale bottom-up proteomics, and a specially designed single-cell CE-μESI platform coupled with a high-resolution tandem mass spectrometer (HRMS2). HVPS: high-voltage power supply; Syr. Pump: syringe pump. Scale bars: 150 μm (embryo and μESI, left-middle panels), 250 μm (microcentrifuge vial), 1.5 mm (separation, right panel) [37].
Figure 5.
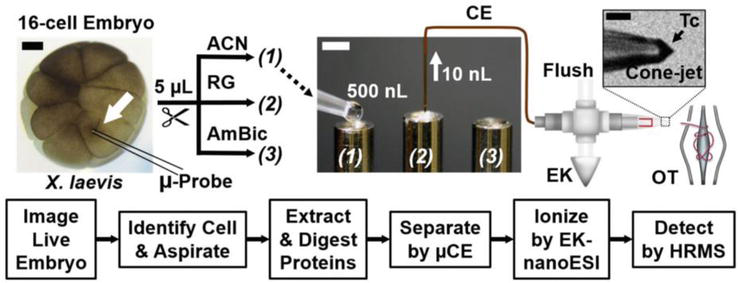
Proteomic analysis of a single cell in a live X. laevis embryo without the use of labeling techniques. The given example demonstrates the optical recognition of the midline animal-dorsal cell (D11, indicated by a white arrow) in the 16-cell embryo. Approximately 20 nl of cellular content were extracted using capillary microsampling techniques employing a microprobe. The aspirated sample containing proteins was subjected to extraction and digestion processes. Subsequently, peptides were separated utilizing a microanalytical CE platform and ionized through a custom-designed electrokinetically pumped nanoelectrospray ionization (EK-nESI) source. This source was continuously monitored using a long-working distance camera to ensure stable operation within the cone-jet regime (referred to as Taylor cone or Tc), thereby facilitating efficient ionization. The resulting peptide ions were then analyzed utilizing an Orbitrap MS with high-resolution capabilities. Scale bars are provided for reference: 200 μm in black and 1 mm in white [38].
The recent advancements in CE-MS have significantly improved its detection capabilities by introducing a reversed-phase C18 microcolumn for pre-separation prior to CE, enabling the identification of 141 proteins from a protein digest sample as low as 500 pg and up to 737 proteins from a protein digest sample of just 1 ng [39]. And the PANC-1 cells (around 20 μm in diameter) have been among the tiniest cell types examined using CE. During analysis, researchers noted slight variations in the phosphorylation rates of protein kinase B among individual cells [40].
4. Application of electrophoresis in the ionization of the analytes from single cells for MS analysis
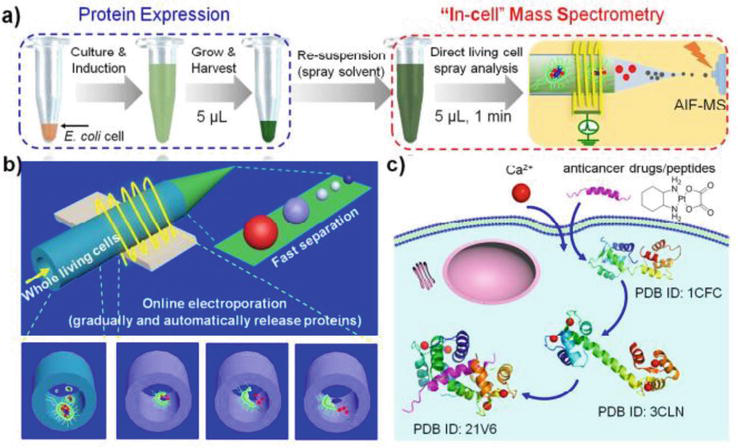
Ensuring that the protein states detected in single-cell MS are consistent with those within the cell is a crucial issue. Huang’s research team postulated that the optimal accuracy can be achieved by promptly detecting proteins within a time frame of 100 ms after their release from the cell. Consequently, they developed an “in-cell” MS method for on-site analysis of proteins and protein complexes in living cells [41, 42, 43]. Figure 6a illustrates the integration of online electroporation-induced protein release and millisecond-scale micro-electrophoretic separation into a standard nanospray needle. A low-frequency pulsed high potential, generated in-house, is applied through a ring silver electrode mounted outside the needle to initiate online electroporation, fast separation, and nESI successively without any physical contact between the electrode and cells. In a typical experiment, living cells are injected into the needle via a syringe preloaded with cell suspensions. The cells pass through an area with high potential due to nanospray force and targeted proteins are released through online electroporation (Figure 6b). This procedure is crucial for extracting protein samples from cells without the need for conventional sampling techniques. Instead, protein extraction in “in-cell” MS occurs automatically and continuously, resembling electroporation when high potential is applied. Following this automated release-based protein extraction, ultrafast electrophoresis is implemented to address or mitigate any potential matrix effects that may arise from the simultaneous release of cellular components, such as inorganic salts and organic small molecules. It is important to mention that both the online electroporation and separation procedures can be completed within a very short time frame of milliseconds. Moreover, “in-cell” MS utilizes nESI as an ionization technique to promptly convert proteins in solution released from living cells into the gas phase, followed by high-resolution Orbitrap mass identification.
Figure 6.
Schematic diagram of (a) "in-cell" MS online electroporation, (b) following millisecond microelectrophoresis setups, and (c) its application for in-situ monitoring of dynamic protein-ligand. As demonstrated, the enhanced desolvation effectiveness in the all-ion-fragmentation mode allows for the identification of individual proteins and detection of larger protein complexes within living cells using "in-cell" MS. It is important to acknowledge that various factors, such as cell penetration efficiency, reaction rates, concentration, and intracellular constituents, influence the binding states between proteins and ligands. AIF-MS refers to all-ion-fragmentation MS [41].
In conclusion, the unique features of “in-cell” MS encompass the avoidance of offline lysis and protein sampling, elimination of offline separation, and minimal manipulation processes on cells. These characteristics facilitate the characterization of larger proteins and protein complexes within intact living cells (Figure 6c), making high-throughput analysis achievable. The utilization of this approach has facilitated the detection of a broader range of protein complexes, including 17 proteins with molecular weights ranging from 4 to 44 kDa. Additionally, the “in-cell” MS technique allows for real-time monitoring of dynamic protein interactions in live cells, and its feasibility has been demonstrated through the test of the interaction between calcium-regulated calmodulin and melittin. This innovative method for protein analysis shows significant potential applications in various fields, such as biochemistry labs, protein engineering, and the protein industry.
As mentioned earlier, the incorporation of electrophoresis and MS into experimental workflows has greatly promoted the development of single-cell analysis. Electrophoresis plays an important role in all stages of single-cell MS analysis, including the sampling process, separation of analytes, and ionization (Table 1). By integrating with single-cell MS in various ways, electrophoresis can effectively enhance the accuracy, substance coverage, analysis speed, and other properties of single-cell MS, thus playing a crucial role in the fields of metabolomics, proteomics, metallomics, and beyond.
Summary of the application of electrophoresis in the single-cell MS analysis.
5.2 Future direction
In the future, the combination of electrophoresis and MS will become more diverse, particularly with the advancement of ambient ionization MS [44, 45]. Coupling electrophoresis with atmospheric pressure ionization sources will be a crucial direction for development. Building upon this, the creation of stable electrophoresis-MS instruments is another important area to focus on as it can enhance the stability, reproducibility, automation, programming capabilities, analysis speed, and accuracy of the analytical process.
This work was supported by the National Natural Science Foundation of China (No. 21864001), and the Sub-project of Key Project at the Central Government Level: the ability establishment of sustainable use for valuable Chinese medicine resources (2060302-2101-01).
2.Sun LL, Dubiak KM, Peuchen EH, Zhang ZB, Zhu GJ, Huber PW, et al. Single cell proteomics using frog (Xenopus laevis) blastomeres isolated from early stage embryos, which form a geometric progression in protein content. Analytical Chemistry. 2016;88(13):6653-6657. DOI: 10.1021/acs.analchem.6b01921
3.Klepárník K, Foret F. Recent advances in the development of single cell analysis—a review. Analytica Chimica Acta. 2013;800:12-21. DOI: 10.1016/j.aca.2013.09.004
4.Wang Q , Fan JW, Bian XY, Yao H, Yuan XH, Han Y, et al. A microenvironment sensitive pillar[5]arene-based fluorescent probe for cell imaging and drug delivery. Chinese Chemical Letters. 2022;33(4):1979-1982. DOI: 10.1016/j.cclet.2021.10.040
5.Sheng YW, Zhou MJ, You CJ, Dai XX. Dynamics and biological relevance of epigenetic N6-methyladenine DNA modification in eukaryotic cells. Chinese Chemical Letters. 2022;33(5):2253-2258. DOI: 10.1016/j.cclet.2021.08.109
6.Xu YZ, Zhang YF, Yang HH, Yin W, Zeng LL, Fang S, et al. Two-dimensional coordination polymer-based nanosensor for sensitive and reliable nucleic acids detection in living cells. Chinese Chemical Letters. 2022;33(2):968-972. DOI: 10.1016/j.cclet.2021.07.041
7.Shen J, Chen J, Wang D, Liu ZJ, Han GM, Liu BH, et al. Real-time quantification of nuclear RNA export using an intracellular relocation probe. Chinese Chemical Letters. 2022;33(8):3865-3868. DOI: 10.1016/j.cclet.2021.10.032
8.Yang XK, Zhang FL, Jin XK, Jiao YT, Zhang XW, Liu YL, et al. Nanoelectrochemistry reveals how soluble Aβ42 oligomers alter vesicular storage and release of glutamate. Proceedings of the National Academy of Sciences of the United States of America. 2023;120(19):e2219994120. DOI: 10.1073/pnas.2219994120
9.Qi YT, Jiang H, Wu WT, Zhang FL, Tian SY, Fan WT, et al. Homeostasis inside single activated phagolysosomes: quantitative and selective measurements of submillisecond dynamics of reactive oxygen and nitrogen species production with a nanoelectrochemical sensor. Journal of the American Chemical Society. 2022;144(22):9723-9733. DOI: 10.1021/jacs.2c01857
10.Yang XK, Zhang FL, Wu WT, Tang Y, Yan J, Liu YL, et al. Quantitative nano-amperometric measurement of intravesicular glutamate content and of its sub-quantal release by living neurons. Angewandte Chemie International Edition. 2021;60(29):15803-15808. DOI: 10.1002/anie.202100882
11.Jiang H, Qi YT, Wu WT, Wen MY, Liu YL, Huang WH. Intracellular monitoring of nadh release from mitochondria using a single functionalized nanowire electrode. Chemical Science. 2020;11:8771-8778. DOI: 10.1039/D0SC02787A
12.Wei X, Yang M, Jiang Z, Liu JH, Zhang X, Chen ML, et al. A modular single-cell pipette microfluidic chip coupling to ETAAS and ICP-MS for single cell analysis. Chinese Chemical Letters. 2022;33(3):1373-1376. DOI: 10.1016/j.cclet.2021.08.024
13.Sun CL, Ma CX, Li LL, Han YH, Wang DJ, Wan X. A novel on-tissue cycloaddition reagent for mass spectrometry imaging of lipid C=C position isomers in biological tissues. Chinese Chemical Letters. 2022;33(4):2073-2076. DOI: 10.1016/j.cclet.2021.08.034
14.Zhang WM, Han ZS, Liang YQ , Zhang Q , Dou XN, Guo GS, et al. A pico-HPLC-LIF system for the amplification-free determination of multiple miRNAs in cells. Chinese Chemical Letters. 2021;32(7):2183-2186. DOI: 10.1016/j.cclet.2020.12.007
15.Nahar L, Onder A, Sarker SD. A review on the recent advances in HPLC, UHPLC and UPLC analyses of naturally occurring cannabinoids (2010-2019). Phytochemical Analysis. 2020;31(4):413-457. DOI: 10.1002/pca.2906
16.Zhang QF, Xiao HM, Zhan JT, Yuan BF, Feng YQ. Simultaneous determination of indole metabolites of tryptophan in rat feces by chemical labeling assisted liquid chromatography-tandem mass spectrometry. Chinese Chemical Letters. 2022;33(11):4746-4749. DOI: 10.1016/j.cclet.2022.01.004
17.Harstad RK, Johnson AC, Weisenberger MM, Bowser MT. Capillary electrophoresis. Analytical Chemistry. 2016;88(1):299-319. DOI: 10.1021/acs.analchem.5b04125
19.Mizuno H, Tsuyama N, Harada T, Masujima T. Live single-cell video-mass spectrometry for cellular and subcellular molecular detection and cell classification. Journal of Mass Spectrometry. 2008;43(12):1692-1700. DOI: 10.1002/jms.1460
20.Esaki T, Masujima T. Fluorescence probing live single-cell mass spectrometry for direct analysis of organelle metabolism. Analytical Sciences. 2015;31(12):1211-1213. DOI: 10.2116/analsci.31.1211
21.Zhang LW, Foreman DP, Grant PA, Shrestha B, Moody SA, Villiers F, et al. In situ metabolic analysis of single plant cells by capillary microsampling and electrospray ionization mass spectrometry with ion mobility separation. Analyst. 2014;139(20):5079-5085. DOI: 10.1039/C4AN01018C
22.Yin RC, Prabhakaran V, Laskin J. Quantitative extraction and mass spectrometry analysis at a single-cell level. Analytical Chemistry. 2018;90(13):7937-7945. DOI: 10.1021/acs.analchem.8b00551
23.Gong XY, Zhao YY, Cai SQ , Fu SJ, Yang CD, Zhang SC, et al. Single cell analysis with probe ESI-mass spectrometry: detection of metabolites at cellular and subcellular levels. Analytical Chemistry. 2014;86(8):3809-3816. DOI: 10.1021/ac500882e
24.Yu Z, Chen LC, Ninomiya S, Mandal MK, Hiraoka K, Nonami H. Piezoelectric inkjet assisted rapid electrospray ionization mass spectrometric analysis of metabolites in plant single cells via a direct sampling probe. Analyst. 2014;139(22):5734-5739. DOI: 10.1039/C4AN01068J
25.Deng JW, Yang YY, Xu MZ, Wang XW, Lin L, Yao ZP, et al. Surface-coated probe nanoelectrospray ionization mass spectrometry for analysis of target compounds in individual small organisms. Analytical Chemistry. 2015;87(19):9923-9930. DOI: 10.1021/acs.analchem.5b03110
26.Phelps MS, Verbeck GF. A lipidomics demonstration of the importance of single cell analysis. Analytical Methods. 2015;7(9):3668-3670. DOI: 10.1039/C5AY00379B
27.Sun M, Yang ZB. Metabolomic studies of live single cancer stem cells using mass spectrometry. Analytical Chemistry. 2019;91(3):2384-2391. DOI: 10.1021/acs.analchem.8b05166
28.Song LL, Chingin K, Wang M, Zhong DC, Chen HW, Xu JQ. Polarity-specific profiling of metabolites in single cells by probe electrophoresis mass spectrometry. Analytical Chemistry. 2022;94(10):4175-4182. DOI: 10.1021/acs.analchem.1c03997
29.DeLaney K, Sauer CS, Vu NQ , Li LJ. Recent advances and new perspectives in capillary electrophoresis-mass spectrometry for single cell “omics”. Molecules. 2019;24(1):42. DOI: 10.3390/molecules24010042
30.Zhou W, Zhang BF, Liu YK, Wang CL, Sun WQ , Li W, et al. Advances in capillary electrophoresis-mass spectrometry for cell analysis. Trends in Analytical Chemistry. 2019;117:316-330. DOI: 10.1016/j.trac.2019.05.011
31.Nemes P, Rubakhin SS, Aerts JT, Sweedler JV. Qualitative and quantitative metabolomic investigation of single neurons by capillary electrophoresis electrospray ionization mass spectrometry. Nature Protocols. 2013;8(4):783-799. DOI: 10.1038/nprot.2013.035
32.Aerts JT, Louis KR, Crandall SR, Govindaiah G, Cox CL, Sweedler JV. Patch clamp electrophysiology and capillary electrophoresis–mass spectrometry metabolomics for single cell characterization. Analytical Chemistry. 2014;86(6):3203-3208. DOI: 10.1021/ac500168d
33.Onjiko RM, Moody SA, Nemes P. Single-cell mass spectrometry reveals small molecules that affect cell fates in the 16-cell embryo. Proceedings of the National Academy of Sciences of the United States of America. 2015;112(21):6545-6550. DOI: 10.1073/pnas.1423682112
34.Onjiko RM, Portero EP, Moody SA, Nemes P. In situ microprobe single-cell capillary electrophoresis mass spectrometry: metabolic reorganization in single differentiating cells in the live vertebrate (Xenopus laevis) embryo. Analytical Chemistry. 2017;89(13):7069-7076. DOI: 10.1021/acs.analchem.7b00880
35.Osanai T, Oikawa A, Shirai T, Kuwahara A, Iijima H, Tanaka K, et al. Capillary electrophoresis–mass spectrometry reveals the distribution of carbon metabolites during nitrogen starvation in Synechocystis sp. PCC 6803. Environmental Microbiology. 2014;16(2):512-524. DOI: 10.1111/1462-2920.12170
36.Lombard-Banek C, Reddy S, Moody SA, Nemes P. Label-free quantification of proteins in single embryonic cells with neural fate in the cleavage-stage frog (Xenopus laevis) embryo using capillary electrophoresis electrospray ionization high-resolution mass spectrometry (CE-ESI-HRMS). Molecular & Cellular Proteomics. 2016;15(8):2756-2768. DOI: 10.1074/mcp.M115.057760
37.Lombard-Banek C, Moody SA, Nemes P. Single-cell mass spectrometry for discovery proteomics: quantifying translational cell heterogeneity in the 16-cell frog (Xenopus) embryo. Angewandte Chemie International Edition. 2016;55(7):2454-2458. DOI: 10.1002/anie.201510411
38.Lombard-Banek C, Moody SA, Manzini MC, Nemes P. Microsampling capillary electrophoresis mass spectrometry enables single-cell proteomics in complex tissues: developing cell clones in live Xenopus laevis and zebrafish embryos. Analytical Chemistry. 2019;91(7):4797-4805. DOI: 10.1021/acs.analchem.9b00345
39.Choi SB, Lombard-Banek C, Muñoz-LLancao P, Manzini MC, Nemes P. Enhanced peptide detection toward single-neuron proteomics by reversed-phase fractionation capillary electrophoresis mass spectrometry. Journal of the American Society for Mass Spectrometry. 2018;29(5):913-922. DOI: 10.1007/s13361-017-1838-1
40.Mainz ER, Wang QZ, Lawrence DS, Allbritton NL. An integrated chemical cytometry method: shining a light on akt activity in single cells. Angewandte Chemie International Edition. 2016;55(42):13095-13098. DOI: 10.1002/anie.201606914
41.Li GY, Yuan S, Zheng SH, Liu YZ, Huang GM. In situ living cell protein analysis by single-step mass spectrometry. Analytical Chemistry. 2018;90(5):3409-3415. DOI: 10.1021/acs.analchem.7b05055
42.Li GY, Yuan S, Pan Y, Liu YZ, Huang GM. Binding states of protein–metal complexes in cells. Analytical Chemistry. 2016;88(22):10860-10866. DOI: 10.1021/acs.analchem.6b00032
43.Chen YT, Li GY, Yuan SM, Pan Y, Liu YZ, Huang GM. Ultrafast microelectrophoresis: behind direct mass spectrometry measurements of proteins and metabolites in living cell/cells. Analytical Chemistry. 2019;91(16):10441-10447. DOI: 10.1021/acs.analchem.9b00716
44.Feider CL, Krieger A, DeHoog RJ, Eberlin LS. Ambient ionization mass spectrometry: recent developments and applications. Analytical Chemistry. 2019;91(7):4266-4290. DOI: 10.1021/acs.analchem.9b00807
45.Zhang XL, Zhang H, Wang XC, Huang KK, Wang D, Chen HW. Advances in ambient ionization for mass spectrometry. Chinese Journal of Analytical Chemistry. 2018;46(11):1703-1713. DOI: 10.1016/S1872-2040(18)61122-3
Written By
Hui Li and Jiaquan Xu
Submitted: 25 July 2023Reviewed: 03 August 2023Published: 03 November 2023
 Open access peer-reviewed chapter