Open Access is an initiative that aims to make scientific research freely available to all. To date our community has made over 100 million downloads. It’s based on principles of collaboration, unobstructed discovery, and, most importantly, scientific progression. As PhD students, we found it difficult to access the research we needed, so we decided to create a new Open Access publisher that levels the playing field for scientists across the world. How? By making research easy to access, and puts the academic needs of the researchers before the business interests of publishers.
We are a community of more than 103,000 authors and editors from 3,291 institutions spanning 160 countries, including Nobel Prize winners and some of the world’s most-cited researchers. Publishing on IntechOpen allows authors to earn citations and find new collaborators, meaning more people see your work not only from your own field of study, but from other related fields too.
To purchase hard copies of this book, please contact the representative in India:
CBS Publishers & Distributors Pvt. Ltd.
www.cbspd.com
|
customercare@cbspd.com
The veterinary practitioner, for the diagnosis of diseases, needs practical tools, fast, inexpensive, and, above all, available. The importance of this chapter lies in the reduction of various para-clinical examinations known in bovine medicine, which are often difficult to handle during a displacement in rural areas and which are also expensive. For this reason, serum protein electrophoresis (SPE) is an important component of laboratory diagnostic evaluations for serum protein measurement. Electrophoresis is based on the movement of charged particles through a buffered medium subjected to an electric field. Some variations that can be noticed in the SPE depend on some physiological and pathological cases. Early diagnosis of diseases is particularly important because treatments are no longer effective when the degree of consequences damages are too severe; because the clinical signs are not specific, the general clinical examination of the dairy cow can only lead to a suspicion of disease without a necessary tool, for confirmation or discover an insidious inflammatory process.
Clinic Department, Veterinary Institute, University in Ouled Yaïch, Algeria
*Address all correspondence to: metref_ahmed@univ-blida.dz
1. Introduction
Electrophoresis is the most widely used technique for standard fractionation of serum proteins in clinical biochemistry and molecular biology [1]. By this technique, serum proteins can be separated into albumin and globulin fractions by electrophoresis. This method consists of an electrical charge applied to agarose or cellulose gel matrix; electrophoresis capillary proteins are currently the most practiced, allowing serum proteins to migrate through the matrix and separate into bands based on their charge and size. The separation of protein fractions occurs in a free liquid medium created by the low-viscosity buffer, in which the application of high voltage generates an electro-osmotic flow, causing a rapid movement of proteins toward the cathode [2]. The matrix of migration is stained to detect the protein bands and read via densitometry to generate a tracing.
This allows a better separation of proteins with similar physicochemical characteristics, generating multiple subpeaks or narrower peaks [3]. Serum protein electrophoresis has been studied in animal and equine medicine, in particular for the clinical diagnosis of diseases characterized by dysproteinemia (leishmaniasis, ehrlichiosis, and feline infectious peritonitis) or to identify the presence of inflammation [4]. Electrophoresis is based on the movement of charged particles through a buffered medium subjected to an electric field [5]. Agarose gel is combined with an alkaline buffer solution (pH 9.1). A semi-automatic system usually does this. The separated proteins are stained with an “Amidoschwarz” solution, and the excess dye is removed in an acidic solution. The electrophoretic profiles are analyzed visually using a densitometer that gives an accurate relative quantification of each individualized area to detect anomalies. The densitometer reads the gel to define the relative concentrations (percentages) of each fraction. Agarose gel electrophoresis has several advantages over cellulose acetate (better reproducibility of results and greater clarity of electrophoretic strips). The migration takes place at 20 Watt (through two electrodes, one negative, the other positive), at 20°C (for about 7 minutes). The system performs all coloring, bleaching, and drying sequences. Then, we wait until the tank cools. The dry gel is removed for its final treatment: the reading will be done through a densitometer, which allows the relative concentrations (percentages) of each fraction to be defined. Serum proteins have a negative charge, so in an electric field, they migrate to the positive pole, and they are separated from each other by different bands depending on their size [6]. The speed of their movement depends on the characteristics of the isolated protein, including its electric charge, size, shape, strength of the electric field, type of medium used for separation, and temperature. After separation, the protein fractions are fixed in an acidic solution to denature the proteins and immobilize them on the support [7]. The proteins are then stained and quantified by density measurement, also providing graphical data so that they can be analyzed by computer depending on the electrophoretic system used [4].
2. The normal value of serum blood electrophoresis in cattle
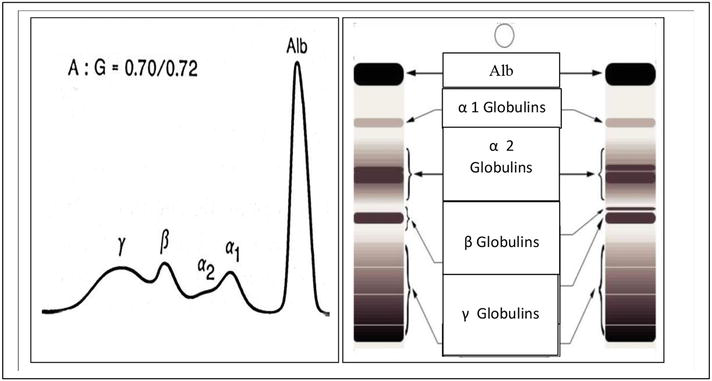
In cattle, the normal profile of an SPE includes albumin and α-, β-, and γ-globulins (see Figure 1). The α-fraction is the most rapidly migrating protein relative to all globulins, and in most species, it migrates as the α-fraction1 (fast) and α2 (slow). Many proteins of the acute phase of inflammation, considered diagnostically important, migrate in this fraction. Alpha1-antitrypsin, α1-acid glycoprotein, α1-antichymotrypsin, α1-ketoprotein, serum amyloid A, and α1-lipoprotein have been identified in the α1-globulin area, whereas haptoglobin, α2-microglobulin, α2-macroglobulin, ceruloplasmin, α2-antiplasmin, and α2-lipoprotein in the α2-globulin fraction [8]. This method (SPE) is also recommended to determine the distribution of globulins and quantify several fractions accurately (α-, β-, and γ-globulins), [9, 10, 11].
Figure 1.
Example of healthy bovine serum protein electrophoresis.
3. The physiological variations of serum blood electrophoresis in cattle
The animal is considered clinically healthy if it does not show any decline in its zootechnical value, or expresses any sign of disease and influence of biological variations (the state of stress of an animal, the biological rhythm specific to each animal), the administration of drugs or tranquilizers [13]. We obtained a standard electrophoretic tracing, comprising five fractions: The first fraction is represented by albumin (Alb), followed by α1-, α2-, β-, and γ-globulins. In the physiological state, there is a clear dip between the end of the α2 fraction, and that of β-globulin (see Figure 1). This result corroborates with that found by authors [14, 15, 16, 17]. Other authors describe a six-fraction separation using agarose gel electrophoresis: albumin, α1- and α2-, β1- and β2-, and γ-globulins [18]. The interpretation of the biochemical parameters measured can only be significant for an individual because each organism has a specific reactivity toward its environment, and a diagnostic opinion remains exclusively the domain of the clinician. The value of different components is described in Table 1.
Section
Value
Ratio: A/G
0.7
Albumin (Alb)
25–42 g/l
α1-globulins
6–12 g/l
α2-globulins
3.5–9.5 g/l
Β-globulins
4–11 g/l
Γ-globulins
7–26 g/l
Table 1.
The normal value of different sections in bovine serum blood electrophoresis [19].
3.1 Proteinogram variation in relation to age
The influence of age on proteinogram values has been studied by other authors and does not corroborate our results. Each author finds the age of the animals is one of the important factors that can affect the concentrations of the different serum protein fractions or their electrophoretic pattern, especially in the early months of life [20], and showed that in young and adult cattle, there is also the existence of an age-related influence for α- and γ-globulin fractions namely, the values of α1-globulins were higher in calves, while for adult animals they presented higher concentrations of γ-globulins [21].
3.2 Proteinogram variation in relation to body condition score
The body condition of the animals is one of the indicators of the efficiency and safety of a ration, so for this reason, they directly impact the different components of SPE, especially the negative marker like albumin [16].
3.3 Variation of the proteinogram in relation to the physiological stage
The body condition varies significantly according to the physiological stage [22]; hence, the interest in the conduct of the dry period, which is a strategic and determining period for the nutritional future of the animal and the herd, his impact on SPE is significant by nutrition condition [17].
4. The pathological variations of serum blood electrophoresis in cattle
4.1 Albumin to globulin ratio (A/G)
Albumin is a small protein with a molecular weight of 69 kDa. The main functions of albumin are the maintenance of homeostasis by regulating oncotic pressure, blood pH buffering, and the transport of substances (fatty acids, fat-soluble hormones, and unconjugated bilirubin). It also acts as a free radical captor [23]. The liver is the principal site of albumin synthesis. Its degradation takes place in the liver, but other tissues may be involved: muscles, kidneys, and skin. The plasma concentration of albumin is determined by the intensity of hepatic synthesis, which is generally in balance with its elimination. It is responsible for about 75% of the plasma osmotic pressure and is a major source of amino acids that can be used by the animal’s body when needed [24]. Hypoalbuminemia may therefore be caused by a lack of synthesis, which may be an indication of severe hepatic disorders. However, hypoalbuminemia may result from renal leakage caused by glomerulopathy. It may also be the result of severe inflammation of the intestine, leading to protein loss. Hypo-albuminemia is therefore not specific to liver disease. It is also not very sensitive since it only appears at the end of the evolution of a hepatic disease [8].
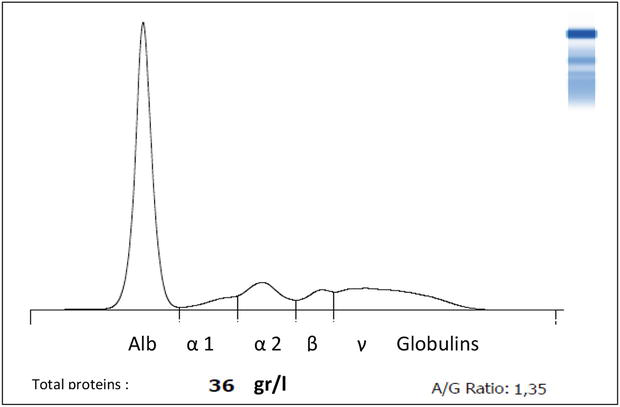
However, it is a consequence of poor rationing associated or not with parasitic infestation. This confirms that it is a good negative marker of inflammation, as previously established [8, 25]. The normal A/G ratio is between 0.6 and 0.9 in cows, but the relative concentrations of albumin and globulins can be changed in many conditions or diseases, resulting in changes in their ratio. Also, considers that in chronic and severe liver diseases, there is usually an increase in immunoglobulins (gamma-globulins: IgM, IgG, and IgA) together with a decrease in serum albumin concentration [25]. There may also be an increase in inflammatory proteins such as α2 and β-globulins. In the case of evolving abscesses, an increase in fibrinogen may be noted along with a decrease in the A/G ratio. Unfortunately, the decrease in the A/G ratio is not specific to liver damage: it can fall in many infectious or autoimmune diseases [26, 27], for that only serum protein electrophoresis (SPE) is of real interest in interpreting a drop in the A/G ratio (see Figure 2).
Figure 2.
Electrophoresis pattern of a 6-year-old cow with hypo-proteinemia [28].
4.2 α1-globulins
The alpha 1 zone is constituted by alpha 1 antitripsin, orosomucoid, and alpha 1 antichymotripsin. The usual value is 6 gr/l [19]. Most of the cattle present a low value [28]. This abnormality in comparison with normal range [19], we had a low wave, without specific clinical manifestations. This anomaly reported in humans, has not been previously revealed in ruminants. The studies at this time has not been able to determine the cause of these cases. We suggested the hypothesis of a congenital origin of α1 antitrypsin deficiency [the major protein of α1 zone] [8], like for humans, because of the similarities of the role and origin in the two species. However, in cattle, the serum levels of α1-antitripsin can be so low that their systemic detection is difficult [29]. This case is described in humans [30], also, it is the result of an impairment of the respiratory system [31, 32, 33, 34]. However, only the CSF (cerebrospinal fluid) in cattle contained α1-antitripsin, with detectable value [29].
4.3 α2-globulins
The alpha 2 zone is constituted by haptoglobin, ceruloplasmin, Gc globulin, alpha 2 macroglobulin, and alpha-lipoproteins. We have a presence of peaks for the cases that present bronchopneumonia with a state of thinness [28]. The latter is suspected of developing chronic inflammatory conditions without clinical expression that would prevent them from gaining weight. It was noted that this coincides with an increase in total protein levels and acute phase proteins [35]. The α2 fraction obtained by electrophoresis is always increased during an inflammatory or infectious process since the majority of acute phase proteins (APPs) migrate to this area. It would therefore be wise to take this fact into account rather than using separate APP assays that require more expensive techniques. Alpha2-globulins are most often increased during bronchopneumonia [8].
4.4 β-globulins
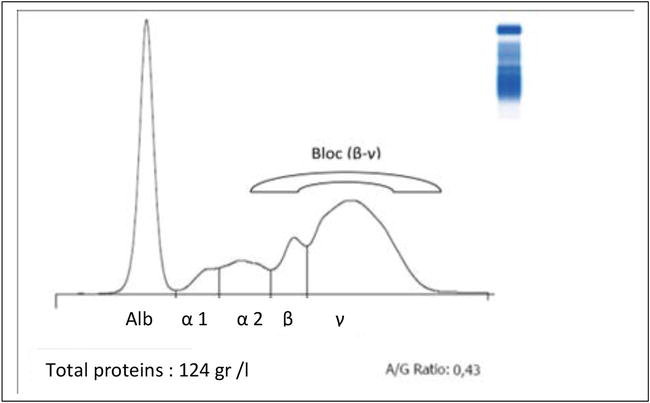
They are composed of fractions: transferin, heopexin, betalipoprotein, and complement C3. This fraction has recorded an increase in its area in liver diseases [19, 36] because it is associated with an increase of specific enzymes to the liver function and total proteinemia (including the gamma-globulin fraction, alpha2globulin) with a pattern characterized by the formation of a block (β-γ) when the chronic development (see Figure 3). The cases of hypo-beta-globulins (small wave) appeared simultaneously with the cases of hypo-albuminemia, and this was in the absence of an increase of the enzymes of the hepatic function and without particular clinical signs. In these cases, we believe that there is a lack of food intake in relation to the physiological state and real needs of these animals [36].
Figure 3.
Plot of blood serum electrophoresis of cow with liver.
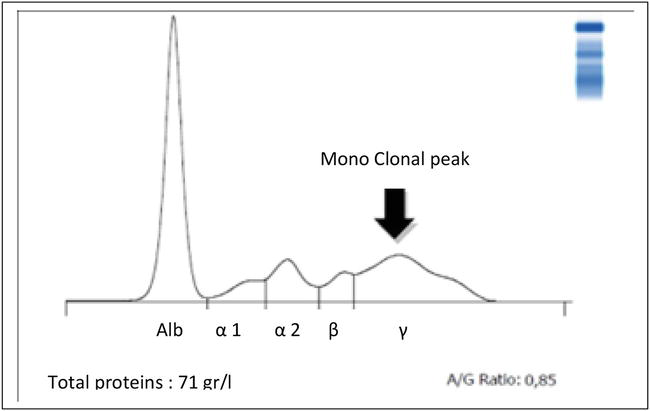
They constitute the group of immunoglobulins (IgG, IgA, IgD, IgE, and IgM): we noticed that their increase is permanent during clinical conditions such as lameness, bronchopneumonia, and mastitis [28]. They could not be revealed by the other biochemical parameters assayed independently of the clinic; this makes them a good indicator of inflammation. We distinguish two representative groups of hyper-gammas-globulins: Those with monoclonal peaks (narrow and homogeneous): monoclonal gammopathy (MG) is characterized by the increase of a single type of Ig belonging to a well-defined class and subclass [37]. It is a synthesis of antibodies directed against possible specific antigens caused by viral, bacterial, or parasitic attacks [20]. As a result, the poor weight status of these cases of cattle, which do not express clinical manifestations, is explained [28]. Other authors have described these monoclonal peaks in this species for older subjects (exceeding 6 months) for lymphocytic leukemia or reticuloendothelial system tumors [8, 12]. Monoclonal gammopathy is characterized by a sharp, homogeneous, spike-like peak in the focal region of the γ-globulin area (see Figure 4).
Figure 4.
Plot of blood serum electrophoresis of a young bull, 6 months old, delayed growth (monoclonal peak) [28].
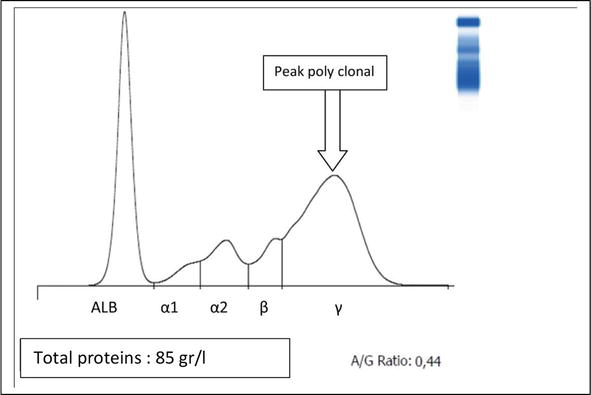
The second group includes polyclonal hyper-gamma-globulins (diffuse increase). This is the case of cattle that develop general or organ-specific inflammatory diseases (see Figure 5) [38].
Figure 5.
Plot of blood serum electrophoresis of cow with chronic mastitis (poly clonal peak) [28].
Electrophoresis alone can provide an answer to many clinical diagnostic problems. Its interpretation, in combination with the data collected for each individual, has made it possible to confirm clinically apparent cases and to discover other asymptomatic cases. We can consider serum protein electrophoresis as a practical tool for diagnosis in rural medicine: the ease of its realization, the simplicity of its method, the rapidity of its response (less than 1 h), and the quality of its information. The interpretation of the biochemical parameters measured can only be meaningful for an individual (a diagnostic choice remains exclusively the domain of the clinician). The study of the tracings allowed us to discover that electrophoresis alone can provide an answer to a large number of clinical diagnostic problems. Its interpretation in combination, with all the data collected for each individual, allowed us to confirm clinically apparent cases and to discover other asymptomatic cases. Electrophoresis should be combined with the clinical examination and other complementary examinations (Biopsy, Hematology, Bacteriology). It should be associated with other more specific biochemical assays (specific functional exploration of organs) in order to avoid the veterinary practitioner having to recommend uncertain treatments. The abnormal electrophoretic profile of serum proteins may be characteristic of certain disorders or diseases but, in other cases, may indicate only nonspecific pathological processes. Despite this low specificity in the diagnosis of certain diseases, the determination of serum protein profile in ruminants and the correct interpretation of their results are very useful for clinicians in the diagnosis of healthy and diseased animals and can serve as a basis for other specific laboratory examinations. We can consider serum protein electrophoresis as a practical tool for diagnosis in rural medicine: the ease of realization, the simplicity of its method, the rapidity of its response (less than 1 h), the quality of its information; electrophoresis constitutes, therefore, a practical and economical alternative in the semiology exploration of ruminant’s medicine.
There is no conflict of interest. We do not benefit from any financial support from an organization or institution.
References
1.O’Connell T, Horite T, Kasravi B. Understanding and interpreting serum protein electrophoresis. American Family Physician. 2005;2005(71):105-112
2.Giordano A, Paltrinieri S. Interpretation of capillary zone electrophoresis compared with cellulose acetate and agarose gel electrophoresis: Reference intervals and diagnostic efficiency in dogs and cats. Veterinary Clinical Pathology. 2010;2010(39):464-473
3.Petersen Jr OA, Mohammad A, Da P. Capillary electrophoresis and its application in the clinical laboratory. Clinica Chimica Acta. 2003;2003(330):1-30
4.Vavricka S, Burri E, Beglinger C, Degen L, Manz M. Serum protein electrophoresis: An underused but very useful test. Digestion. 2009;2009(79):203-210
5.Azim W, Azim S, Ahmed K, Shafi H, Rafi T, Luqman M. Diagnostic significance of serum protein electrophoresis. Biomédica. 2004;2004(20):40-44
6.Esmaeilnejad B, Tavassoli M, Asri-Rezaei S, Dalir-Naghadeh B, Pourseyed S. Evaluation of serum total protein concentration and protein fractions in sheep naturally infected with Babesia ovis. Comparative Clinical Pathology. 2014;2014(23):151-155
7.Tymchak L. 2010. Amino acids and proteins. In: Bishop ML, Fody EP, Schoeff LE, editors. Clinical Chemistry: Techniques, Principles, Correlations. 6th ed. Philadelphia, USA: Lippincott Williams & Wilkins; 2010. pp. 223-265
8.Smith B, van Metre D, Pusterla N. Book, Large Animal Internal Medicine. 6th ed. Elsevier Inc.; 2021. pp. 435-442
9.Cray C, Rodriguez M, Zaias J. Protein electrophoresis in psittacine plasma. Veterinary Clinical Pathology. 2007;2007(36):64-72
10.Cray C, Tatum LM. Applications of protein electrophoresis in avian diagnostics. Journal of Avian Medicine and Surgery. 1998;1998(12):4-10
11.Metref A, Melizi M. Importance of serum protein electrophoresis in bovine medicine (easy tool for diagnosis). Global Veterinaria. 2017;19(2):509-516
12.Kaneko JJ. A century of animal clinical biochemistry: growth, maturity and visions for the future. Revue de Medecine Veterinaire. 2000;151(7):601-605
13.Stockham SL, Scott MA. Introductory concepts. In: Fundamentals of Veterinary Clinical Pathology. Blackwell Publishing Company, Iowa State Press; 2002. pp. 3-31
14.Dartois HR. Contribution à la mise en œuvre d’une méthode d’analyse des protéines sériques par électrophorèse en gel d’agarose. Thèse. 2011. Ecole vétérinaire d’Alfort
15.Errico G, Giordano A, Paltrinieri S. Diagnostic accuracy of electrophoretic analysis of native or defibrinated plasma using serum as a reference sample. Veterinary Clinical Pathology. 2012;2012(41):529-540
16.Alberghina D, Giannetto C, Vazzana I, Ferrantelli V, Piccione G. Reference intervals for total protein concentration, serum protein fractions, and albumin/globulin ratios in clinically healthy dairy cows. Journal of Veterinary Diagnostic Investigation. 2011;2011(23):111-114
17.Piccione G, Messina V, Alberghina D, Giannetto C, Caselle S, Assenza A. Seasonal vari-ations in serum protein fractions of dairy cows during different physiological phases. Comparative Clinical Pathology. 2012;2012(21):1439-1443
18.Nagy O, Tóthová C, Nagyová V, Kováč G. Comparison of serum protein electropho-retic pattern in cows and small ruminants. Acta Veterinaria Brno. 2015;2015(84):187-195
19.Fontaine M. Book, Vade-mecum du vétérinaire, 15ème édition, office nationale des publications universitaire. 1993
20.Tóthová C, Nagy O, Nagyová V, Kováč G. The concentrations of selected blood serum proteins in calves during the first three months of life. Acta Veterinaria Brno. 2016;2016(85):33-40
21.Tóthová C, Nagy O, Seidel H, Kováč G. Serum protein electrophoretic pattern in clini-cally healthy calves and cows determined by agarose gel electrophoresis. Comparative Clinical Pathology. 2013;2013(22):15-20
22.Drame ED, Hanzen C, Houtain JY, Laurent Y, Fall A. Profil de l'état corporel au cours du post-partum chez la vache laitière. Annales De Medecine Veterinaire. 1999;1999(143):265-270
23.Hankins J. The role of albumin in fluid and electrolyte balance. Journal of Infusion Nursing. 2006;2006(29):260-265
24.Mackiewicz A. Acute phase proteins and transformed cells. International Review of Cytology. 1997;1997(170):225-300
25.Stockham SL, Scott MA. Liver function. In: Fundamentals of Veterinary Clinical Pathology. Blackwell Publishing Company, Iowa State Press; 2002. pp. 461-487
26.Js L. Albumin for end-stage liver disease. Korean Journal of Internal Medicine. 2012;2012(27):13-19
27.Kelly R. Ruminant liver disease. In: Cotton M, editors. Gross Pathology of Ruminants. Proceedings Sydney: Post-Graduate Foundation in Veterinary Science. University of Sydney; 2003. pp. 81-96
28.Metref A, Aouane N, Djamila K, Mohamed M. Abnormalities of serum protein electrophoresis in cattle, compare between assays for markers of inflammation and markers of liver alteration. International Journal of Veterinary Science. 2021;10(3):208-213
29.Di Filippo PA, Lannes ST, Meireles MAD, Nogueira AFS, Ribeiro LMF, Graça FAS, et al. Acute phase proteins in serum and cerebrospinal fluid in healthy cattle: possible use for assessment of neurological diseases. Brazilian Journal of Veterinary Research. 2018;38:779-784
30.Denden S, Lakhdar R, Leban N, Daimi H, Elhayek D, Knani J, et al. Development: Alpha 1 antitrypsin deficiency. Mediterranean Journal of Human Genetics. 2010;1:26-33
31.Janciauskiene SM, Bals R, Koczulla R, Vogelmeier C, Köhnlein T, Welte T. The discovery of α1-antitrypsin and its role in health and disease. Respiratory Medicine. 2011;105:1129-1139
32.Tuder RM, Janciauskiene SM, Petrache I. Lung disease associated with α1-antitrypsin deficiency. Proceedings of the American Thoracic Society. 2010;7:381-386
33.Fagliari JJ, Passipieri M, Okuda HQ , Silva SL, Silva PC. Serum protein concentrations, including acute phase proteins, in calves with hepatogenous photosensitization. Arquivo Brasileiro de Medicina Veterinária e Zootecnia. 2007;59:1355-1358
34.Sampaio PH, Fidelis JOL, Marques LC, Machado RZ, Barnabé PA, André MR, et al. Acutephase protein behavior in dairy cattle herd naturally infected with Trypanosoma vivax. Veterinary Parasitology. 2015;211:141-145
35.Humblet MF, Coghe J, Lekeux P, Godeau JM. Acute phase proteins assessment for an early selection of treatments in growing calves suffering from bronchopneumonia under field conditions. Research in Veterinary Science. 2004;2004(77):41-47
36.Camus M, Krimer P, Leroy B, Almy F. Evaluation of the positive predictive value of serum protein electrophoresis beta-gamma bridging for hepatic disease in three domestic animal species. Veterinary Pathology. 2010;2010(47):1064-1070
37.Lecarrer D. Serum Protein Electrophoresis Immunofixation. SEBIA (INC); 1994. 125 p (11 p-31 p)
38.Jackson D, Elsawa S. Factors regulating immunoglobulin production by normal and disease-associated plasma cells. Biomolecules. 2015;5:20-40
Written By
Ahmed Khiredine Metref
Submitted: 03 October 2023Reviewed: 25 October 2023Published: 21 December 2023
 Open access peer-reviewed chapter