Open Access is an initiative that aims to make scientific research freely available to all. To date our community has made over 100 million downloads. It’s based on principles of collaboration, unobstructed discovery, and, most importantly, scientific progression. As PhD students, we found it difficult to access the research we needed, so we decided to create a new Open Access publisher that levels the playing field for scientists across the world. How? By making research easy to access, and puts the academic needs of the researchers before the business interests of publishers.
We are a community of more than 103,000 authors and editors from 3,291 institutions spanning 160 countries, including Nobel Prize winners and some of the world’s most-cited researchers. Publishing on IntechOpen allows authors to earn citations and find new collaborators, meaning more people see your work not only from your own field of study, but from other related fields too.
To purchase hard copies of this book, please contact the representative in India:
CBS Publishers & Distributors Pvt. Ltd.
www.cbspd.com
|
customercare@cbspd.com
Molecular techniques based on DNA analysis have become an indispensable tool for the identification and classification of organisms, addressing the limitations of taxonomy based on morphological characters. There are different methods for the analysis of the variability of DNA which can provide unique genetic signatures capable of distinguishing closely related species, hybrid specimens or even individuals within the same species. Here we describe two methods that allow species identification by agarose gel electrophoresis separation techniques. DNA barcoding is a method of identifying any species based on a short DNA sequence amplified by PCR from a specific region of the genome, as most species have distinct genetic markers, or “barcodes”, that are unique to them. By performing a bioinformatic analysis of the PCR-amplified barcode of an unknown sample against a database of known barcodes, it is possible to identify the species to which the sample belongs. On the other hand, Random Amplified Polymorphic DNA (RAPD) is used to detect genetic variation within a species. It is a PCR-based method that employs short, random primers to amplify DNA fragments from genomic DNA. The amplified fragments are then separated by gel electrophoresis and visualized as a banding pattern on the gel.
DNA barcoding and RAPD (Random Amplified Polymorphic DNA) are two molecular biology techniques based on PCR used to analyze genetic variability within populations and species. These methods rely on the presence of genetic variation, which originates from mutation and recombination processes together with genetic drift and gene flow. Examining genetic variation within and between species provides insight into how organisms are related to each other and how they have evolved over time. Genetic variation can help determine the degree of relatedness between different species, identify common ancestors and reveal patterns of diversification and adaptation. It also helps to understand the genetic distinctiveness and uniqueness of different species, thus contributing to our understanding of biodiversity and the processes that shape it. We will discuss the application of these molecular markers along with others that can be used as alternatives in genetic studies. Among the most common options are those based on enzymatic digestion, such as RFLP (Restriction fragment length polymorphism), based on PCR, such as ISSR (Inter Simple Sequence Repeat), or on the combination of both procedures, such as AFLP (Amplified fragment length polymorphism). In this work we show the usefulness of using the DNA barcoding technique to identify food fraud in frozen fish samples. In addition, we use the RAPD technique for the identification of different Quercus species as an alternative technique in case there is not enough genetic variability to use the DNA barcoding technique.
DNA barcoding is a molecular technique consisting of the amplification of short DNA sequences, between 400 and 800 bp, which allows the taxonomic identification of the genetic material under study [1, 2]. DNA barcoding is based on the analysis of a tissue sample for short DNA sequences of specific genes that act as genetic markers. Although there may be minor variations in highly conserved regions of DNA during evolution, the main idea of DNA barcoding is to identify a standardized region or “barcode” that shows enough variation between species to distinguish them. By comparing the DNA barcode sequences of unknown samples to a reference database, species can be identified and classified, even when traditional morphological identification is challenging or not feasible because of the sample scarcity or damaged samples. DNA barcoding is the preferred technique due to its cost-effectiveness and time requirements.
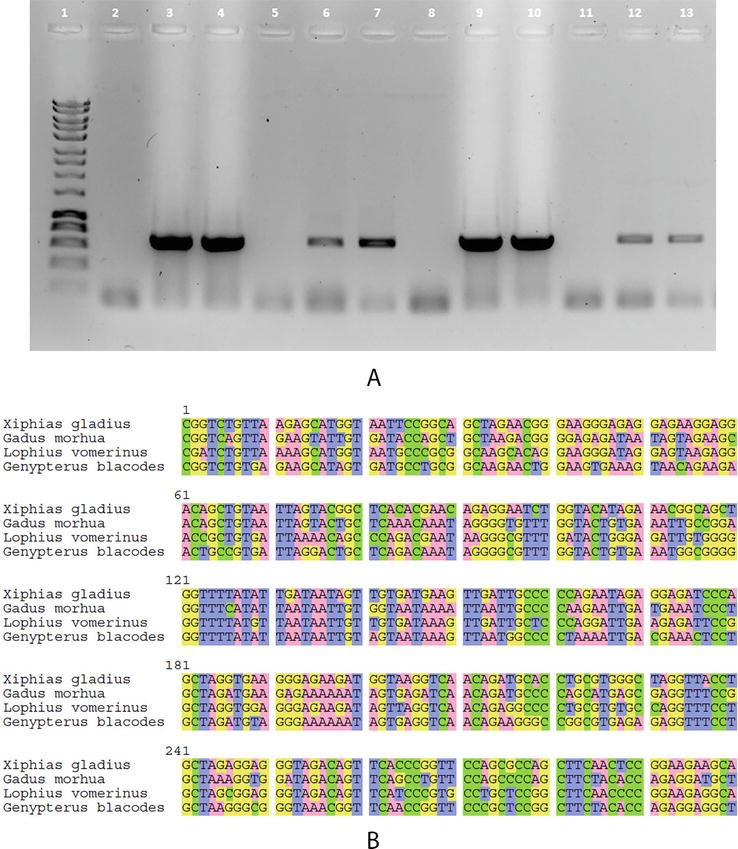
The great versatility of the barcoding technique makes it a very useful tool in different fields such as conservation biology, ecology, evolutionary biology and forensic analysis, among others. It has multiple applications such as species identification from any of the life stages of an organism (eggs, larvae, mature individuals or seeds), from damaged specimens, fecal or gut samples, to identify cryptic species (species that look similar but are genetically different), to promptly identify invasive species, to trace the biogeography of the species under study, studies on plant ecology, to control fraudulent trafficking of species or agricultural pests [3, 4]. It is also used by the pharmaceutical industry as a quality control or to check the correct labelling of foods in order to combat food fraud. Figure 1 shows an analysis of DNA barcoding of fish species from several samples of small frozen fish fragments from a commercial supplier. DNA extraction, PCR amplification, barcode sequencing and comparison with molecular databases were performed to match the resulting species with the one marked on the sample labelling.
Figure 1.
Use of DNA barcoding to identify food fraud. (A) Agarose gel electrophoresis of COI amplification products from different commercial samples of frozen fish analyzed with primers FISHCOILBC_ ts and FISHCOIHBC_ts (See Table 1). Lane 1: molecular marker. Lanes 3, 4: Xiphias gladius; Lanes 6, 7: Gadus morhua; Lanes 9, 10: Lophius vomerinus; Lanes 12, 13: Genypterus blacodes. Lanes 2, 5, 8, 11: respective negative control samples. (B) Multiple sequence alignment of the barcodes used in this study by Seaview software [5].
The use of short DNA sequences for species identification was first proposed by Hebert et al. [1] in 2003 at the University of Guelph, Canada. The mitochondrial cytochrome oxidase I (COI) gene was proposed as a candidate for establishing a global system for animal identification. The primer pair LCO1490 and HCO2198 (see Table 1) amplified a 658 bp region of this gene, sufficient for the identification of the specimens under study.
Primers name
Amplified gene
Sequence (5′-3′)
Amplified fragment size (pb)
PCR program
LCO1490
Mitochondrial gene. 5′ region of Subunit I of Cytochrome C oxidase (COI-5P) (invertebrate animals)
GGTCAACAAATCATAAAGATATTGG
≈700
(1)
HCO2198
TAAACTTCAGGGTGACCAAAAAATCA
vF1i_t1
Mitochondrial gene. 5′ region of Subunit I of Cytochrome C oxidase (COI-5P) (non-fish vertebrate animals)
TCTCAACCAACCACAAAGACATTGG
≈700
(2)
vR1d_t1
TAGACTTCTGGGTGGCCRAARAAYCA
FishCOILBC_ts
Mitochondrial gene. 5′ region of Cytochrome C oxidase subunit I (COI-5P) (fish vertebrate animals)
Pair of primers selected for different taxonomic groups. Data described are obtained from reference [6] and our own results.
“-”: not determined in our study.
Subsequently, numerous studies were carried out to search for new genes for the use of the technique in other taxonomic groups such as plants [4, 7, 8] or fungi [9]. When studying plant DNA barcodes, three chloroplastidic genetic regions (rbcL, matK and trnH-psbA) and one nuclear region such as the Internal Transcribed Spacer (ITS) were selected as the standard barcode of choice for most plant and fungal [4, 7, 9]. Molecular markers used as barcodes in the identification of different taxonomic groups have been established by the Barcode of Life (CBOLD) or iBOLD Consortium. The main steps of DNA barcoding are: (1) Sample collection, (2) Tissue sampling, (3) DNA isolation, (4) PCR amplification, (5) Sequencing and (6) analysis of the sequence obtained.
2.1 DNA barcoding technique
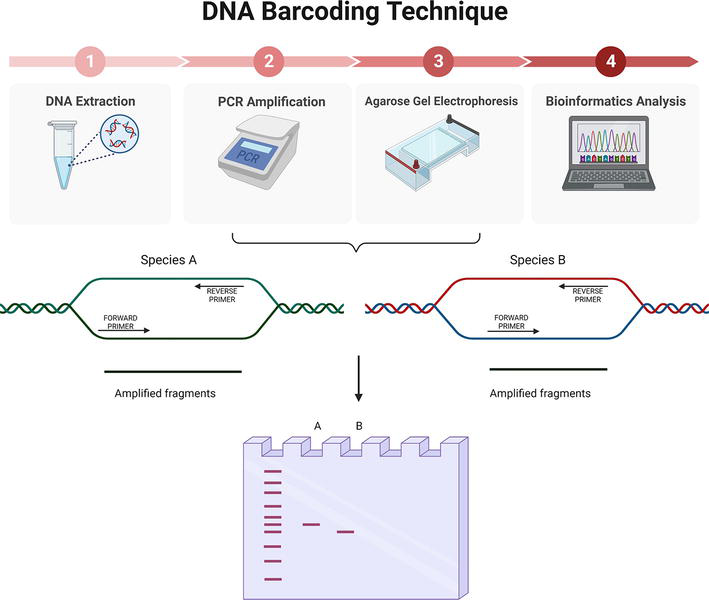
The DNA barcoding technique is based on the amplification of a DNA fragment by PCR with a primer pair complementary to the genomic region used as barcode. The amplification product is visualized by agarose gel electrophoresis. If a single specific fragment of the expected size is obtained, the amplification product is sequenced by Sanger for subsequent bioinformatic analysis and taxonomic identification (Figure 2).
Figure 2.
DNA barcoding technique. Top: 1) DNA extraction and quantification. 2) amplification of a short DNA sequence by PCR with previously designed primers. 3) visualization of the amplified fragment by agarose gel electrophoresis. 4) Bioinformatic analysis of short DNA sequences or ‘barcodes’ and identification of the sample. Bottom: Schematic representation of the barcode amplification and visualization after agarose gel electrophoresis from species A and B. Created with Biorender.com.
2.1.1 Extraction and quantification of genomic DNA
After sample collection and photographic documentation, DNA is extracted using standardized protocols or specific kits, which yield good quality, inhibitor-free genomic DNA for PCR amplification. Tissue lysis is performed with Proteinase K to degrade proteins such as nucleases that could degrade DNA during purification.
For the extraction of genomic DNA from animals, the use of the Edwards Buffer (200 mM Tris–HCl, pH = 7.5; 200 mM NaCl; 25 mM EDTA, 0.5% SDS; 0.1% β- Mercaptoetanol 1 μl/ml) [10, 11] is recommended. Because the high amount of phenolic compounds in plants, the DNA extracted with the Edwards Buffer protocol sometimes contains numerous PCR inhibitors, and the use of the commercial DNeasy® Plant ProKit (Qiagen N.V, Hilden, Germany) or CTAB buffer (0.1 M Tris–HCl (pH 8.0), 1.4 M NaCl, 0.02 M EDTA, 0.2 g/mL cetyltrimethyl-ammonium-bromide) (CTAB) [11, 12] is recommended.
DNA is quantified by spectrophotometer (NanoDrop ND-1000) and the ratio of absorbances 260:280 and 260:230 is used as a measure of the quality of DNA extraction. The former provides information on the purity of DNA and RNA in the sample: a ratio of ∼1.8 is considered as acceptable for DNA analysis and a ratio of ∼2.0 is accepted as acceptable for RNA. If compounds such as proteins, phenols or other contaminants that absorb at 280 nm are present in the sample, this ratio will be lower. Similarly, the presence of contaminants that absorb at 230 nm, such as carbohydrates, guanidine HCl or phenolic solutions [13], will result in values below ∼2.0 in the 260:230 ratio.
2.1.2 Design and selection of primers
Table 1 shows the different primers selected and tested for different taxonomic groups. Although they are functional for many taxa, for certain groups it is necessary to design specific primers that allow the amplification of the desired sequences [14]. Table 2 shows the PCR conditions for each pair of primers.
PCR program
Initial step
Number of Cycles
Denaturation step (A)
Annealing step (B)
Extension step (C)
Additional extension step
(1)
94°C 4′
35
94°C 1′
54°C 30′
72°C 1′
—
(2)
94°C 4′
35
94°C 15′
54°C 15′
72°C 30′
—
(3)
94°C 3′
35
94°C 30′
48°C 40′
72°C 1′
72°C 10′
(4)
95°C 2,5′
35
95°C 30′
56°C 30′
72°C 45′
72°C 10′
(5)
94°C 3′
35
94°C 30′
52°C 30′
72°C 45′
72°C 10′
Table 2.
PCR protocol for the amplification of the different group of organisms described in Table 1. Modified from [6].
2.1.3 PCR amplification
We have performed PCR amplifications in 50 μl of reaction volume in the presence of 1.25 units of GoTaq® G2 Flexi DNA polymerase 5 u/μl (Promega, Wisconsin, USA), 0.2 mM each dNTP, 0.2 μM of each primer and less of 0.2 μg of template DNA.
The PCR amplification program depends on the primers chosen (Table 2). PCR reactions were heated 5 min. at 94°C, followed by 35 cycles under the following conditions: 15–30 secs. at 94°C (Denaturation step); 15–40 secs. at 50–60°C (Annealing step), 1–3 min. at 72°C (Elongation step).
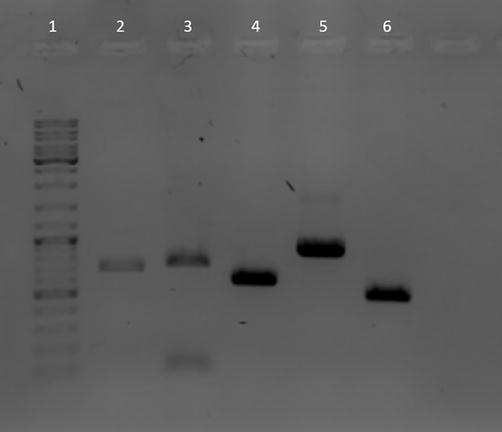
Analysis by agarose gel electrophoresis of the PCR products obtained for DNA barcoding analysis. Reactions were performed as described in the text. Lane 1: HyperLadder 1 kb. Lane 2: amplification of Gibbula divaricata COI barcode using LCO1490 and HCO2198 primers specific for invertebrates. Lane 3: amplification of Lophius vomerinus COI barcode using FISHCOILBC_ ts and FISHCOIHBC_ts primers specific for fish. Lanes 4, 5, 6: amplification of barcodes rbcL (rbcLa f and rbcLa rev primers), matK (matk-3F and matk-1R primers) and nrITS2 (nrITS2-S2F and nrITS2-S3 Rev. primers) respectively from the plant Nerium oleander.
2.1.5 DNA sequencing and bioinformatic analysis
PCR products are purified to remove components of the PCR reactions, resuspended in TE buffer and reverse and direct sequences are obtained by standard Sanger sequencing. To identify the species to which the obtained sequence corresponds, bioinformatic analysis involves the following steps: (1) Data preprocessing: quality control of the raw sequence data (.ab1 file format), which may include filtering out low-quality reads, trimming the end of the sequences, and removing any artifacts or contaminants. Free licensed software such as SnapGene Viewer can be used for this purpose. (2) Sequence alignment: preprocessed DNA sequences are aligned to a reference database. Alignment algorithms such as BLAST (Basic Local Alignment Search Tool) are used. Identification is performed based on sequence similarity. (3) Data analysis, which may include the calculation of genetic distances and phylogenetic trees.
It is particularly interesting to work with specific databases such as the Barcode of Life Data Systems (BOLD, www.boldsystems.org), which provides a repository of DNA barcode sequences of various species using the DNA Barcoding technique [14]. BoldSystem compiles all the information necessary for the taxonomic identification of an individual, short DNA sequence or “barcode”, taxonomic descriptions, photographs of specimens, geolocation and the sequences of other individuals of the species. The database itself, when including the problem sequence/s in the system, will return a phylogenetic tree based on the Neighbor-Joining statistical method, in which the species can be included within the corresponding phylogenetic group by comparing it with the sequences collected in the database. Furthermore, the phylogenetic tree obtained clearly includes the locations of all the sequences of the species with which the problem sequence has been identified, making it possible to study intraspecific diversity by inferring the phylogeographic character of the different variants of a species. This process is of great importance for studies of biogeography, invasive alien species or population ecology [15].
Random Amplification of Polymorphic DNA (RAPD) is a molecular biology technique that can be used for genetic analysis and identification of organisms when DNA barcoding is not feasible due to the absence of reference sequences in the databases or because the genetic proximity of species offers little genetic diversity in the genes used as barcodes [16]. RAPD is a PCR-based technique that amplifies random segments of DNA using arbitrary short primers. It requires no prior knowledge of the DNA sequence and can generate a unique, fingerprint-like pattern of amplified DNA fragments for each individual or species [17, 18]. RAPD analysis relies on the presence or absence of amplified DNA fragments, and the resulting banding patterns can be visualized by gel electrophoresis.
RAPD is a relatively simple, fast and low-cost technique, so it is used in several fields of genetics. The main advantage is that it is not necessary to know the genetic sequence to be studied, so when the starting information is insufficient to create specific primers, it is one of the best options for genetic studies. Other advantages are the possibility of genotyping a wide variety of organisms, from bacteria to animals or plants using the same primers and the high number of polymorphisms obtained in each test [18, 19, 20, 21].
3.1 Random amplified polymorphic DNA technique
The use of random sequence primers was first described in 1990 by Welsh and McClelland in their bacterial genome assay “Fingerprinting genomes using PCR with arbitrary primers”, which they called “Arbitrarily Primed Polymerase Chain Reaction” (AP-PC) [19, 22]. In the same year, Williams et al. published another paper describing a similar technique called “randomly amplified polymorphic DNA” (RAPD) [17, 19]. These two techniques, together with DNA amplification fingerprinting (DAF), have been grouped under the term Multiple Arbitrary Amplicon Profiling (MAAP) [20, 21]. All are based on the polymerase chain reaction (PCR) and follow the same principle: random amplification of DNA fragments, the main difference being the length of the primers, the annealing temperature and the type of gel electrophoresis used to visualize the bands generated [17, 20, 22, 23], with RAPD being the most popular due to its simplicity and low cost [23].
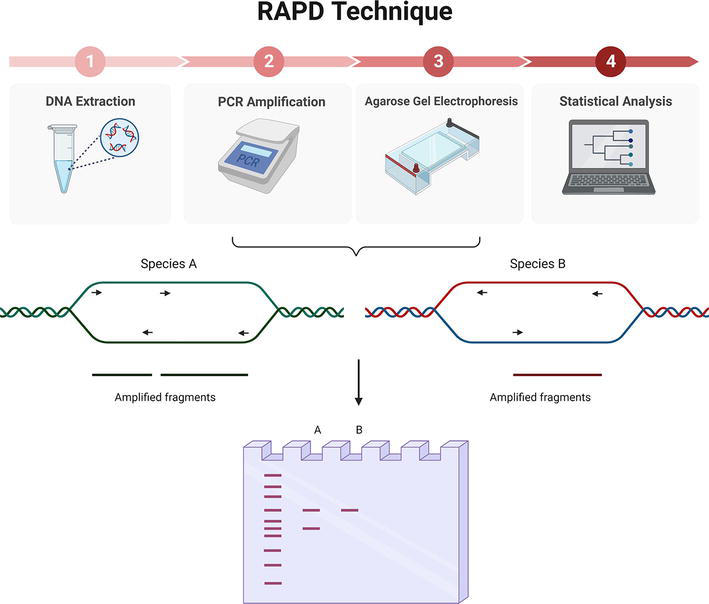
RAPDs use a single primer per PCR reaction, as opposed to the two primers used in traditional PCR. The primer has a length of 10 nucleotides and an arbitrary sequence with a GC content equal to or greater than 60% [17, 21] and acts as a direct and reverse primer at the same time (Figure 4). Using this type of primer, it is possible to find numerous loci to bind to throughout the genome [18, 19, 24]. Furthermore, in this type of PCR, a low annealing temperature is set so that, even if the complementarity of the primer with the strand is not perfect, around 90%, as long as the last bases of the 3′ end match, binding will occur, thus increasing the number of binding sites in the genome [19]. However, only fragments in which the binding site of one strand is between 0.5 and 4 kilobases from the binding site of the complementary strand and the 3′ ends are facing each other will be amplified (Figure 4) [18, 19, 24].
Figure 4.
RAPD technique involves 4 steps. Top: (1) sample DNA extraction, (2) PCR amplification with a specific primer, (3) agarose gel electrophoresis and, (4) statistical analysis. Bottom: Primer hybridizes at random along the genome, rendering two amplified bands in the case of species A and just one band in species B. results are visualized after agarose gel electrophoresis. Created with Biorender.com.
When using the RAPD technique, it must be assumed that the bands of the different labeled loci do not migrate the same distance on the gel [16]. However, it may happen that among the amplified products bands with the same molecular weight are found in different species, which could be due to homologous traits, those inherited from a common ancestor, or homoplastic traits, those that have arisen independently in a population. It follows that if two individuals have the same band, their degree of relatedness is higher [24].
With the data obtained, a statistical study can be carried out by generating a binary matrix in which a value of 1 is given to the presence of a certain band in the gel and 0 for its absence, in order to subsequently calculate similarity coefficients of the individuals, allelic frequency, distance matrices or generate dendrograms using various computer programs [20, 25, 26, 27].
3.2 Amplification conditions
We have performed PCR amplifications for RAPDs in 50 μl of reaction volume in the presence of 1.25 units of GoTaq® G2 Flexi DNA polymerase 5 u/μl (Promega, Wisconsin, USA), 0.2 mM each dNTP, 0.4 μM of each primer and less of 0.5 μg of template DNA.
PCR amplification conditions must be set up considering the type of primers used. It is recommended to optimize the conditions by conducting a gradient PCR or varying the annealing temperature, primer concentration, or other parameters to achieve the best results and reproducibility of the specific experiment (Figure 4), [18, 19]. Low annealing temperature promotes the appearance of primer-dimer formation. On the contrary, high annealing temperature reduces the number of polymorphic bands. PCR reactions are performed with just one primer instead of two. Samples were heated three or four min. at 94–95°C, followed by 35–45 cycles under the following conditions: 30–60 s at 92–94°C (Denaturation step); 40–120 s at 36–40°C (Annealing step), 90–120 s at 72°C (Elongation step), and a final extension at 72°C for 7–10 min. [27, 28, 29, 30]. We achieved the best results with the following conditions: 4 min. at 94°C, followed by 40 cycles of 40 s at 94°C, annealing at 40°C for 45 s, and elongation at 72°C for 90 s, and a final extension at 72°C for 10 min.
3.3 Agarose gel electrophoresis
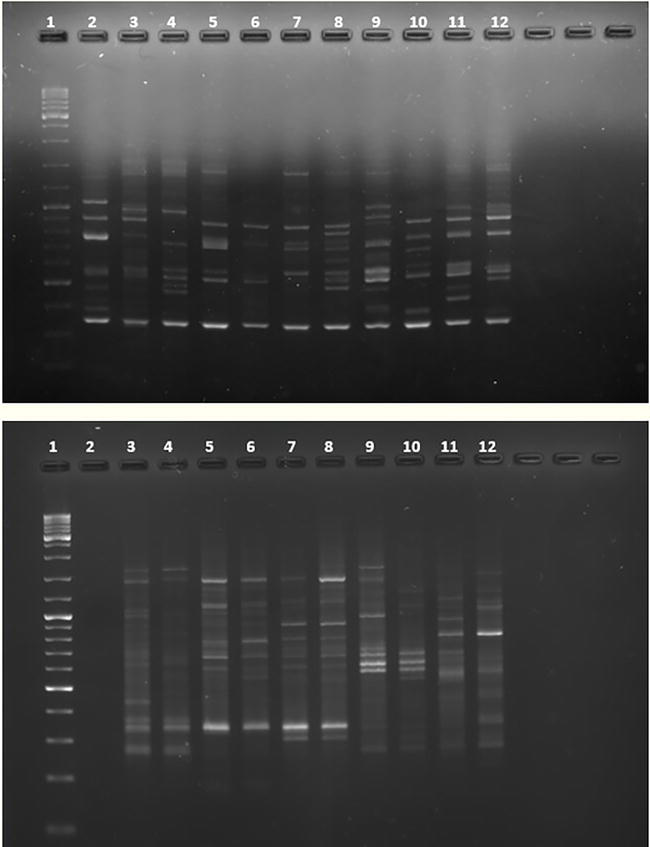
After PCR, the banding pattern generated is visualized on an agarose gel using a classical electrophoresis apparatus. For each sample, 3 to 20 polymorphic bands can be obtained, with molecular weights ranging from 0.5 to 5 kilobases, depending on the distance between the primer binding sites (Figure 4) [18, 19]. Due to the large number of bands obtained and the variety of sizes, the gel must be run at low voltage [27, 30]. The best results in our laboratory have been obtained using a voltage of 4.5 V/cm2 for 120 minutes in a medium-sized (15 × 10 cm) tray. Differences can be obtained by varying the PCR amplification conditions (see Figure 5).
Figure 5.
Analysis by agarose gel electrophoresis of the RAPDs products, the OPD-11 (5′- AGCGCCATTG - 3′) primer was used. A comparison of amplification profiles by RAPD technique is shown. Top: Reaction conditions: 45 cycles and annealing temperature at 36°C. Bottom: The number of cycles was decreased to 40 and the annealing temperature was increased to 40°C. Lane 1: molecular marker. Lane 2: negative control (mixture PCR + water). Lanes 3, 4: Quercus coccifera. Lanes 5, 6: Quercus faginea. Lanes 7, 8: Quercus robur. Lanes 9, 10: Quercus rotundifolia. Lanes 11, 12: Quercus suber. The primer-dimer phenomenon can be observed on top gel as a common band that migrates ahead on the gel. This band disappears in the gel at botom when changing the PCR conditions and achieving, in part, more specific binding.
Gels are prepared at a concentration of 1.5–2.0% agarose, as this favors the separation of smaller fragments [20, 27, 30, 31]. The intercalating agent we prefer to use is ethidium bromide for RAPD, as it shows better results than other alternatives such as SYBR™ Safe or GreenSafe [23, 25], but certain safety measures must be followed because of its mutagenic effect. Alternatively, a polyacrylamide gel with AgNO3 as a stain can be used, as is done in the AP-PCR technique [16, 19, 22, 23].
Although RAPD has limitations, such as difficulties in reproducibility and difficulties in interpreting complex banding patterns, it can provide valuable insights into the genetic makeup and relationships of organisms when other methods like DNA barcoding are not feasible [18, 19, 20, 21].
RAPD can be used in conjunction with other molecular markers, such as microsatellites, to obtain a more complete picture of genetic diversity to identify individuals within a species. Microsatellite typing, also known as simple sequence repeat (SSR) typing, is a molecular biology technique used to genotype individuals based on short tandem repeat (STR) or microsatellite variations in the DNA. Microsatellites are short DNA sequences, usually consisting of 1–6 base pair motifs, which are tandem repeats and are highly variable in length and number of repeats. The instability of microsatellite repeats occurs because of slippage errors in replication [32] or defects in repair by the mismatch repair machinery, leading to alterations in the number of repeat units. During DNA replication, a repetitive DNA sequence, such as a microsatellite, may form a hairpin loop formed by the repetitive sequence itself. These secondary structures can cause DNA polymerase to stall and dissociate from the template strand, leading to the slippage error [32, 33, 34]. These alterations consist in microsatellite expansions (increased number of repeat units) and contractions (decreased number of repeat units).
Used to genotype individuals based on variations in STRs in DNA, it has been widely used in population genetics, forensic science, and plant and animal breeding. However, it has the limitation that the DNA sequence flanking the target microsatellite must be known for primer design. As for RAPDS, SSR markers only indicate the presence or absence of amplified fragments in a sample, so they considered dominant markers because they do not provide information on heterozygosity or allelic dosage [18, 21, 23].
In this work we have used DNA Barcodes as well as RAPDs for the identification of species. Other methods are based on enzymatic digestion (RFLP, Restriction fragment length polymorphism), PCR (ISSR, Inter-Simple Sequence Repeat), or combination of both procedures (AFLP, Amplified fragment length polymorphism). The latter two proposals solve problems of RAPD assays such as reproducibility and specificity. In the case of ISSR, this is due to the longer primer length and higher PCR annealing temperature, despite the use of a random sequence primer. However, they cannot distinguish between homozygotes and heterozygotes [18, 19, 21, 23]. In addition, the cost of the AFLP technique is quite high and requires a high level of expertise because the procedures are more complex [21]. RFLP can be used to distinguish heterozygosity due to its codominant character; however, as it requires a large amount of starting DNA, knowledge of the sequence to be studied and because is not very useful for differentiating between evolutionarily close species, it is not a widely used alternative [18, 19, 21, 23].
The use of barcoding and RAPDs (Random Amplified Polymorphic DNA) techniques has significantly contributed to the identification of species in various fields of research, including biology, ecology, conservation, and forensics. Both methods offer valuable tools for species identification, each with its own strengths and limitations.
Barcoding, which involves the analysis of specific DNA regions, such as the mitochondrial cytochrome c oxidase subunit I (COI) gene or other barcodes, has gained widespread recognition as a powerful tool for species identification. The barcodes described in the text exhibit sufficient variation across species, allowing for reliable differentiation even among closely related taxa. Barcoding offers several advantages, including its simplicity, cost-effectiveness, and the ability to identify species based on fragmented or degraded DNA samples. This technique has been particularly useful in large-scale biodiversity assessments, tracking invasive species, and detecting species in complex environmental samples. However, studies on species hybridization have shown certain limitations, so RAPDs have been used in these cases. These molecular markers have also been widely used for population genetics studies, phylogenetic analysis, and identification of closely related species. The technique is relatively simple and cost-effective, requiring minimal DNA sequence information. However, RAPDs have some limitations, such as issues with reproducibility, sensitivity to DNA quality and quantity, and difficulties in standardization and comparison across different laboratories.
The combined use of barcoding and RAPDs has proven to be a powerful approach, particularly when addressing complex taxonomic or evolutionary questions. By integrating the information provided by both techniques, researchers can enhance the accuracy and resolution of species identification. Barcoding can provide a reliable species-level identification, while RAPDs can reveal intraspecific genetic variation and patterns, allowing for the study of population structure and differentiation. The continued advancement of sequencing technologies and bioinformatics tools will further refine and expand the application of these techniques, enabling more efficient and accurate species identification in the future.
Part of this work was funded by the project OpenLab (SmartCampus, University of Malaga, Spain).
References
1.Hebert PDN, Cywinska A, Ball SL, de Waard JR. Biological identifications through DNA barcodes. Proceedings of the Royal Society of London Series B: Biological Sciences. 2003;270(1512):312-321. DOI: 10.1098/rspb.2002.2218
2.Trivedi S, Rehman H, Saggu S, Panneerselvam C, Ghosh SK, editors. DNA Barcoding and Molecular Phylogeny. Switzerland: Springer International Publishing; 2020. DOI: 10.1007/978-3-030-50075-7
3.Shadrin DM. DNA barcoding: Applications. Russian Journal of Genetics. 2021;57(4):489-497. DOI: 10.1134/S102279542104013X
4.Kress WJ. Plant DNA barcodes: Applications today and in the future: Plant DNA barcode applications. Journal of Systematics and Evolution. 2017;55(4):291-307. DOI: 10.1111/jse.12254
5.Gouy M, Guindon S, Gascuel O. SeaView version 4: A multiplatform graphical user interface for sequence alignment and phylogenetic tree building. Molecular Biology and Evolution. 2010;27(2):221-224
6.Cold Spring Harbor Laboratory DNA Learning Center. Using DNA Barcodes to Identify and Classify Living Things [Internet]. 2018. Available from: https://dnabarcoding101.org/files/using-dna-barcodes.pdf [Accessed: May 01, 2023]
7.CBOL Plant Working Group. A DNA barcode for land plants. Proceedings of the National Academy of Sciences. 2009;106(31):12794-12797. DOI: 10.1073/pnas.0905845106
8.de Vere N, Rich TC, Trinder SA, Long C. DNA barcoding for plants. Methods in Molecular Biology. 2015;1245:101-118. DOI: 10.1007/978-1-4939-1966-6_8
9.Schoch CL, Seifert KA, Huhndorf S, Robert V, Spouge JL, Levesque CA, et al. Nuclear ribosomal internal transcribed spacer (ITS) region as a universal DNA barcode marker for Fungi. Proceedings of the National Academy of Sciences of the United States of America. 2012;109(16):6241-6246. DOI: 10.1073/pnas.1117018109
10.Majaneva M, Diserud OH, Eagle SHC, Hajibabaei M, Ekrem T. Choice of DNA extraction method affects DNA metabarcoding of unsorted invertebrate bulk samples. Metabarcoding and Metagenomics. 2018;2(2):1-12. DOI: 10.3897/mbmg.2.26664
11.Whitlock R, Hipperson H, Mannarelli M, Burke T. A high-throughput protocol for extracting high-purity genomic DNA from plants and animals. Molecular Ecology Resources. 2008;8(4):736-741. DOI: 10.1111/j.1755-0998.2007.02074.x
12.Tamari F, Hinkley CS, Ramprashad N. A comparison of DNA extraction methods using Petunia hybrida tissues. Journal of Biomolecular Techniques JBT. 2013;24(3):113-118. DOI: 10.7171/jbt.13-2403-001
13.Thermo Scientific. 260/280 and 260/230 Ratios [Internet]. 2019. Available from: https://dna.uga.edu/wp-content/uploads/sites/51/2019/02/Note-on-the-260_280-and-260_230-Ratios.pdf [Accessed: May 01, 2023]
14.Ratnasingham S, Hebert PDN. Bold: The barcode of life data system. Molecular Ecology Notes. 2007;7(3):355-364. DOI: 10.1111/j.1471-8286.2007.01678.x
15.Gostel MR, Kress WJ. The expanding role of DNA barcodes: Indispensable tools for ecology, evolution, and conservation. Diversity. 2022;14(3):213. DOI: 10.3390/d14030213
16.Alcántara MR. Breve Revisión de Marcadores Moleculares. In: Eguiarte LE, Souza V, Aguirre X, editors. Ecología molecular. Secretaría de Medio Ambiente y Recursos Naturales, Instituto Nacional de Ecología; 2007. pp. 541-566
17.Williams JGK, Kubelik AR, Livak KJ, Rafalski JA, Tingey SV. DNA polymorphisms amplified by arbitrary primers are useful as genetic markers. Nucleic Acids Research. 1990;18(22):6531-6535. DOI: 10.1093/nar/18.22.6531
19.Liu Z. Randomly amplified polymorphic DNA (RAPD). In: Liu Z, editor. Aquaculture Genome Technologies. 2007. p. 21-28. DOI: 10.1002/9780470277560.ch3.
20.Wojciechowska-Koszko I, Mnichowska-Polanowska M, Roszkowska P, Sławiński M, Giedrys-Kalemba S, Dołęgowska B, et al. Improved RAPD method for Candida parapsilosis fingerprinting. Genes. 2023;14(4):868. DOI: 10.3390/genes14040868
21.Grover A, Sharma PC. Development and use of molecular markers: Past and present. Critical Reviews in Biotechnology. 2016;36(2):290-302. DOI: 10.3109/07388551.2014.959891
22.Welsh J, McClelland M. Fingerprinting genomes using PCR with arbitrary primers. Nucleic Acids Research. 1990;18(24):7213-7218. DOI: 10.1093/nar/18.24.7213
23.Idrees M, Irshad M. Molecular markers in plants for analysis of genetic diversity: A review. European Academic Research. 2014;2:1513-1540
24.Tingey SV, del Tufo JP. Genetic analysis with random amplified polymorphic DNA markers. Plant Physiology. 1993;101(2):349-352. DOI: 10.1104/pp.101.2.349
25.Kumari. Randomly amplified polymorphic DNA – A brief review. American Journal of Animal and Veterinary Sciences. 2014;9(1):6-13. DOI: 10.3844/ajavsp.2014.6.13
26.Dwivedi S, Singh S, Chauhan UK, Tiwari MK. Inter and intraspecific genetic diversity (RAPD) among three most frequent species of macrofungi (Ganoderma lucidum, Leucoagricus sp. and Lentinus sp.) of tropical forest of Central India. Journal of Genetic Engineering and Biotechnoly. 2018;16(1):133-141. DOI: 10.1016/j.jgeb.2017.11.008
27.Ardi M. Genetic variation among Iranian oaks (Quercus spp.) using random amplified polymorphic DNA (RAPD) markers. African Journal of Biotechnoly. 2012;11(45):10291-10296. DOI: 10.5897/AJB12.325
28.Beteş D, Çolak R, Karacan GO, Kandemir İ, Kankiliç T, Çolak E. Population genetic variability of Myodes glareolus (Schreber, 1780) (Mammalia: Rodentia) distributed in Northern Anatolia as revealed by RAPD – PCR analysis. Acta Zoologica Bulgarica. 2014;66(1):31-37
29.Barreneche T, Bodenes C, Lexer C, Trontin JF, Fluch S, Streiff R, et al. A genetic linkage map of Quercus robur L. (pedunculate oak) based on RAPD, SCAR, microsatellite, minisatellite, isozyme and 5S rDNA markers. Theoretical and Applied Genetics. 1998;97(7):1090-1103. DOI: 10.1007/s001220050996
30.Subositi D, Mursyanti E, Widodo H, Widiyastuti Y. RAPD primer screening for markers development of Jinten Hitam (Nigella sativa L.) authentication. Rubiyo, Indrawanto C, editors. E3S Web of Conferences. 2021;306:01008. DOI: 10.1051/e3sconf/202130601008
31.Ylmaz M, Ozic C, Gok L. Principles of nucleic acid separation by agarose gel electrophoresis. In: Magdeldin S, editor. Gel Electrophoresis – Principles and Basics. London, UK: InTech; 2012. DOI: 10.5772/38654
32.Viguera E, Canceill D, Ehrlich SD. Replication slippage involves DNA polymerase pausing and dissociation. EMBO Journal. 2001;20(10):2587-2595. DOI: 10.1093/emboj/20.10.2587
33.Viguera E, Canceill D, Ehrlich SD. In vitro replication slippage by DNA polymerases from thermophilic organisms. Journal of Molecular Biology. 2001;312(2):323-333. DOI: 10.1006/jmbi.2001.4943
34.Castillo MG, Henneke G, Viguera E. Replication slippage of the thermophilic DNA polymerases B and D from the Euryarchaeota Pyrococcus abyssi. Frontiers in Microbiology. 2014;5:403. DOI: 10.3389/fmicb.2014.00403
Written By
Estefanía García-Luque, Ana del Pino-Pérez and Enrique Viguera
Submitted: 14 June 2023Reviewed: 27 June 2023Published: 03 November 2023
 Open access peer-reviewed chapter