Open Access is an initiative that aims to make scientific research freely available to all. To date our community has made over 100 million downloads. It’s based on principles of collaboration, unobstructed discovery, and, most importantly, scientific progression. As PhD students, we found it difficult to access the research we needed, so we decided to create a new Open Access publisher that levels the playing field for scientists across the world. How? By making research easy to access, and puts the academic needs of the researchers before the business interests of publishers.
We are a community of more than 103,000 authors and editors from 3,291 institutions spanning 160 countries, including Nobel Prize winners and some of the world’s most-cited researchers. Publishing on IntechOpen allows authors to earn citations and find new collaborators, meaning more people see your work not only from your own field of study, but from other related fields too.
To purchase hard copies of this book, please contact the representative in India:
CBS Publishers & Distributors Pvt. Ltd.
www.cbspd.com
|
customercare@cbspd.com
The aim of this work was to study the densification kinetics and to evaluate the electrical resistivity of hematite nanopowders (30 nm) during sintering by high-frequency microwave dilatometry (30 GHz) in multimodal cavity, as the purpose of providing new reference data on the kinetic behavior of the densification of high dielectric loss ceramic materials when subjected to microwave sintering, which are few in the literature to date. To analyze the densification kinetics, non-isothermal methods were used, such as the classic models of Woolfrey-Bannister and Dorn for the initial stage of sintering, and the model of Wang-Raj for the intermediate stage, both at heating rates ranging from 5 to 20°C/min. The results show an extreme very low activation energies, both for the initial stage (39–66 kJ/mol) and for the intermediate stage (68 kJ/mol), proved to be sufficient for material densification with less grain growth, compared to lower frequencies (2.45 GHz). In addition, the in situ resistance measurements revealed a decrease in electrical resistivity as a function of material densification, as well as a semiconductor behavior of the sintered hematite.
Graduate Program in Materials Science and Engineering, Materials Science Department, Federal University of São Carlos, São Carlos, Brazil
Claudia P. Fernandez Perdomo*
Graduate Program in Materials Science and Engineering, Materials Science Department, Federal University of São Carlos, São Carlos, Brazil
Guido Link
Karlsruhe Institute of Technology (KIT), Institute for Pulsed Power and Microwave Technology (IHM), Germany
Jhon Jelonnek
Karlsruhe Institute of Technology (KIT), Institute for Pulsed Power and Microwave Technology (IHM), Germany
Ruth Herta G.A. Kiminami
Graduate Program in Materials Science and Engineering, Materials Science Department, Federal University of São Carlos, São Carlos, Brazil
*Address all correspondence to: claudia.perdomo@ufscar.br
1. Introduction
The need for a better understanding of the sintering kinetics of microwave-assisted sintering of ceramics is growing. It is an unconventional process that has shown to be very efficient in the production of advanced high-density ceramics. It leads to a significant reduction in sintering time, as a result of enhanced diffusion processes based on non-thermal effects [1]. Studies on the sintering kinetics of the microwave-assisted process of ceramics sintering, particularly if considering hematite materials, are still scarce in the literature. The few studies reported in the literature adopt the classic sintering models used for conventional sintering. This is valid for both the isothermal sintering, which assesses the grain growth kinetics, and the non-isothermal sintering, which assesses the densification kinetics. The studies are done mainly at a microwave frequency of 2.45 GHz and in materials with an average particle size at a micrometric scale [2, 3, 4, 5]. Thus, the viability of using these classic models has encouraged the use of dilatometers heated by microwave radiation, both at 2.45 and at 30 GHz. This allows to evaluate the instantaneous linear shrinkage and enable studies of the kinetics behavior during sintering at different frequencies [2, 4, 6, 7]. Gyrotrons are used as the high-power microwave source at 30 GHz. The operation at 30 GHz is equivalent to a wavelength in free space of ∼10 mm. It offers a huge advantage for sintering such as increased power absorption. It enables the sintering of materials with low dielectric losses, which eliminates the need of using susceptors as the absorbed power density (Pabs) absorbed by the ceramics is directly proportional to the frequency [8, 9]. Eq. (1) shows the dependence of the absorbed power density from the operation frequency of the microwave [10].
Pabs=σE2=ωε′tanδE2=ωε′′E2E1
In (1)σ is the effective material conductivity, E is the electrical field, ω is the angular frequency of the wave. ε′ and ε″ correspond to real and imaginary part of effective permittivity, respectively, and tanδ is the loss tangent of the material.
In the literature, some works report on using microwaves operating at 30 GHz to assist ceramic sintering such as the thin film of barium and strontium titanate reported by Paul et al. [11]. The authors observed that sintering is fast with a reduction of the sintering time of approximately 67% if compared to conventional sintering. Moreover, the authors observed a lower incidence of defects, better homogeneity, and quality of films sintered by microwave. Birnboim et al. [12] made a comparative study of ZnO sintering at three different frequencies (2.45, 30, and 83 GHz) without any type of auxiliary heating or susceptor material. The authors monitored the interior and surface temperatures of the samples. It was observed that at 2.45 GHz, the interior temperature was higher than on the surface due to the heat losses from the surface, while at 30 and 83 GHz, the exterior temperature was higher, especially at high heating rates. The authors associated this to a decrease of the penetration depth when frequency is increased. These thermal gradient differences between the interior and surface depend on factors such as thermal and dielectric properties, the frequency, and heating rate. In 2013, Sudiana et al. [13] studied the alumina densification in microwave furnaces at 30 GHz and at 300 GHz. A raise in the densification was seen when using microwave-assisted sintering at 30 GHz if compared to the conventional sintering. Besides, the authors observed that the diffusion rate at 30 GHz was higher than at 300 GHz in all studied temperatures, and the grain sizes were similar in both processes at corresponding densities.
Dilatometer measurements of ceramics sintering provide important information related to the curve of linear thermal shrinkage in order to determine the temperature of the onset of shrinkage, ranges of initial and intermediate stages temperatures, and maximum linear shrinkage temperature. Link et al. [8] studied the sintering kinetics of nanometric zirconia stabilized with yttria in a at 30 GHz gyrotron system including a dilatometer. The results reveal a lower temperature for the onset of shrinkage as compared to the conventional heating as well as the retention of the nanoscale microstructure at the end of the process. Furthermore, the authors studied lead zirconate titanate (PZT) and observed lower sintering temperatures and a lower PbO loss by evaporation which allows for a better piezoelectric performance of the material. Thumm et al. [9] observed an advantage in processing of advanced materials such as submicron YSZ, PZT, dental ceramics, and SiO2 using microwave-assisted sintering at 30 GHz.
According to the data provided in the literature, if comparing the activation energy for densification during the microwave-assisted with conventional sintering, normally a reduction of the activation energy is observed during the heating of the material with microwaves. This reduction is normally associated with the non-thermal effects of the electromagnetic radiation. The hypothesis with better acceptance in the scientific community was postulated by Rybakov et al. [10, 14, 15]. An additional driving force, the so called ponderomotive driving force, acts in the mass transport of the ceramic material once a nonuniform electromagnetic field generates oscillatory movements of the charged particles. This additional force is of a nonthermal nature, resulting in a potential reduction of activation energy during sintering.
Link et al. [16] studied metallic compacts in the same dilatometry system for in situ electrical resistivity measurements as used in this report. These results allow the association to the electrical resistivity behavior as a function of the microwave sintering process. It can also be potentially used for ceramic materials. Pomar et al. [17] studied the microtubes of iron oxide synthesis by thermal oxidation of the hematite process. The process was monitored by in situ electrical resistivity measurements. The authors observed that during heating the values of electrical resistivity increase, as expected. Besides, they observed that during the formation of the microtubes, in the thermal oxidation process around 500°C, there was an abrupt change in these values, increasing by two orders of magnitude.
Hematite material is an important n-type semiconductor with a band gap in the range of 1.9 to 2.2 eV [18]. It is a material of great interest due to its properties that enable applications in several fields such as photochemical cells, catalysis, and gas sensors [19]. The hematite has relatively high dielectric losses. Consequently, it is a good absorber for the electromagnetic radiation. As reported by Ramya et al. [20], the loss tangent of the hematite measured with different initial particle sizes in the range of 19 to 33 nm was 0.704–1.463, respectively, in trials performed at 40°C and 1 kHz. Data of dielectric values of hematite and measurements in other frequencies are still scarce.
Other studies were performed on the hematite under microwave heating, such as reported by Togashi et al. [7]. The densification kinetics of the hematite nanopowders was evaluated using the linear thermal shrinkage curves in the analysis, obtained in a microwave-heated dilatometer at 2.45 GHz aided with a microwave susceptor and by dilatometry with conventional heating. The main conclusion of the study was the reduction of the activation energy for the initial stage and the intermediate stage of the microwave sintering. In the initial stage, the reduction is in the order of 10% and for the intermediate stage of 56.3%. This provides a better sintering kinetics and a reduction of the grain growth if compared to conventional heating. These results showed success in evaluating the sintering kinetics in samples sintered by microwave at 2.45 GHz, enabling a better thermodynamic understanding during sintering of the hematite at a low frequency (frequency 10× lower than in this study).
Thus, this work aims for the study of the sintering kinetics and the in situ electrical resistivity measurements of hematite nanopowders sintered by microwaves in the millimeter wave range.
Hematite nanopowders (Fe2O3) with an average particle size of 30 ± 2 nm were synthesized by a modified sol-gel method, as described by Togashi et al. [7]. For the dielectric characterization, the dielectric permittivity was measured with a cavity perturbation system, as the similar to the experimental scheme of Soldatov et al. [21]. The frequency was 2.45 GHz, and the temperature was varied from room temperature to 730°C. The compacts were in cylindrical shape with 7.8 mm of diameter and 10 mm of width. The penetration depth (Dp) was calculated by Eq. (2) [22].
Dp=122πf0,5μ0ε0εr′1+εr′′εr′2−1E2
f is the frequency of microwave operation, μ0 is the magnetic permeability and ε0, the permittivity, both in vacuum. εr′ is the relative real permittivity and εr′′, the relative imaginary permittivity, measured in this case with the perturbation cavity system.
For the dilatometric experiments, a microwave field at 30 GHz is used. Hematite powder compacts in a rectangular prismatic shape, with approximately dimensions of 10×3×3 mm, were pressed in a cold uniaxial press (P O Weber – PW40 model) with 330 MPa of pressure. It assures similar green densities of approximately 40% of theoretical density. The full density of hematite is 5.27 g/cm3 according to JCPDS-ICCD card number 89-0596. For the in situ electrical resistivity, the nanopowder was pressed in cylindrical shape with 5.5 mm in diameter and the length was 3 mm. Again, the density was 40% of theoretical density in all samples. Both experiments were performed in triplicate.
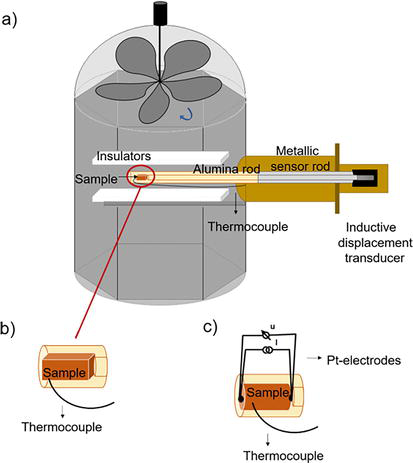
Both dilatometric and in situ electrical resistance measurement tests assisted by microwaves at 30 GHz were performed using a commercial dilatometer (Linseis GmbH, Germany) with alumina rod and support. It was coupled with a microwave furnace in a gyrotron system with maximum power of 15 kW, as described by Link et al. [15, 23]. Figure 1(a) schematizes the system. The cavity has a hexagonal shape and a rotational agitator on top to allow a more homogeneous field distribution. The heating rates used in this research were 5, 10, 15, and 20°C/min, up to 1200°C and a dwell time of 1 minute. The temperature was measured by a type-S thermocouple with a direct thermal contact to the sample (Figure 1(b)). Figure 1(c) schematizes the in situ four-wire electrical resistance measurements.
Figure 1.
Scheme of the dilatometry system coupled with a microwave furnace in a gyrotron system (adapted figure from Link et al. [23]) (a), representation of the temperature measurements for the dilatometric tests, using the S-type thermocouple (b) and for the in situ four-wire electrical resistance measurement (c), in which, in addition to the S-type thermocouple, two more platinum electrodes were used.
The in situ electrical resistance trials were performed with a heating rate of 20°C/min, and the measurements were performed using the four-wire multimeter method (Keithley 2002). To do so, two more electrodes were placed, each at one end of the sample, making a “sandwich” with the sample, as outlined in Figure 1(c). All the experiments were carried out in air atmosphere.
For the first cycle, using the green sample, a heating rate of 20°C/min and a controlled cooling rate of 13°C/min were applied. Same rates were used for the second cycle of in situ electrical resistance measurements, where the samples are already sintered. The electrical resistivity (ρ) was calculated by Eq. (3):
ρ=Rr2πlE3
R is the electrical resistance, in this study measured in situ, r is the radius of the cylindrical sample and, l its length, both for the green ceramic compact. In this case, r was approximately 2.8 mm and the length, 2 mm.
The analysis of the sintering kinetics of the hematite nanopowders was performed using Woolfrey-Bannister and Dorn nonisothermal models for the initial stage of sintering [24] and Wang-Raj constant heating rate model, for the intermediate stage of sintering [25]. The calculation of the activation energy for densification in each of these stages of sintering was carried out and compared with the data in the literature based on conventional heating and microwave hybrid heating at 2.45 GHz.
All the samples were carefully cut in transversal direction into two separate parts after the dilatometric tests at the different heating rates (5, 10, 15, and 20°C/min). The cross section was grinded and polished. The 5 and 20°C/min heating rate samples were analyzed using an optical microscope (Olympus – BX41M LED) to evaluate the microstructural homogeneity and potential differential shrinkage of the sample. And a thermal etching at a temperature 50°C below the sintering temperature, using the same heating rate of the dilatometry, was made for all samples, in order to evaluate the grain size, using a high-resolution scanning electronic microscope (HR-SEM microscope Hitachi, S-4800 type). The average grain size was estimated with the ImageJ software. The measurements of apparent density were performed in ethanol adopting the immersion method, using the principle of Archimedes.
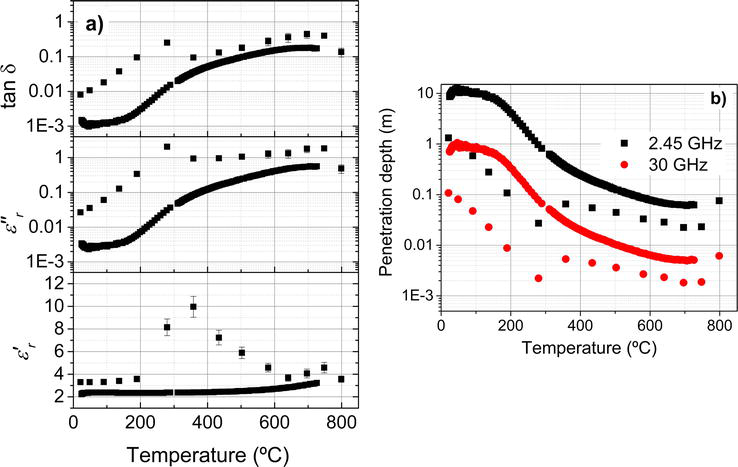
The dielectric characterization measurements at 2.45 GHz of the hematite with 30 nm of initial particle size are presented in Figure 2(a). The heating cycle was from room temperature to 730°C. In Figure 2(b), it is presented the penetration depth calculated for 2.45 GHz and an extrapolation to 30 GHz. This extrapolation was made, considering that the permittivity values and loss tangent do not change with the higher frequency. The penetration depth is the distance of the material surface to the distance in which the field magnitude decreases in a factor of 1/e.
Figure 2.
Dielectric characterization of nano-hematite by the perturbation cavity system at 2.45 GHz (a), measured penetration depth for 2.45 GHz and extrapolation curve for 30 GHz (b).
By the results, it is possible to observe that the permittivity, especially in the imaginary contribution, increases with the increase in temperature. The penetration depth decreases with the increase in temperature. In this case, at approximately 350°C, the hematite starts to absorb better the radiation at 2.45 GHz, characterizing the critical temperature of the material. Up to 680°C, there is an asymptotic behavior of the tan δ curve. The extrapolation curve shows the behavior of the hematite when sintered at high frequency. The penetration depth values would decrease, and it is expected that the absorbed power by the material increases. This results in better interaction of the hematite with the electromagnetic field with the increase in operating frequency.
3.1 Microwave dilatometry at 30 GHz
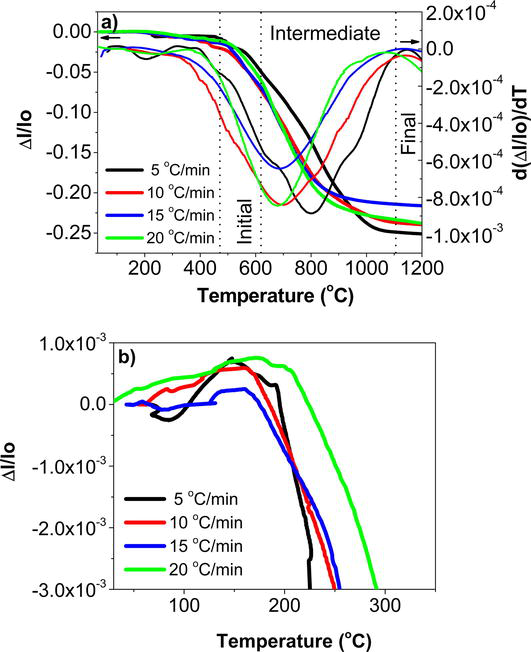
The microwave dilatometry results achieved with high frequency (30 GHz) sintering of hematite nanopowders with an average particle size of 30 ± 2 nm at different heating rates: 5, 10, 15, and 20°C/min, a final temperature of 1200°C, and dwell time of 1 minute are shown in Figure 3(a). Figure 3(b) shows the zoom of the temperature of the onset of shrinkage, highlighting that the region ∆l/lo becomes negative.
Figure 3.
Microwave-assisted dilatometry in high-frequency (30 GHz) curves of the nanometric hematite powder (a) and temperature onset of shrinkage (b) at the different heating rates.
Figure 3(b) reveals the onset of shrinkage at around 200°C, when the ∆l/lo values are negative. The temperature of maximum linear shrinkage rate corresponds to the minimum in the curves of the first derivative, which according to Figure 3(a), is found in the range of 700–824°C. There is the tendency of lower values of maximum shrinkage rate temperatures with increasing heating rate, as presented in Table 1. In Table 1, the values of the temperature of onset of shrinkage, range of temperature of the initial stage, maximum linear shrinkage rate temperature, range of intermediate stage of sintering, and total shrinkage in the different heating rates are presented.
Heating rate (°C/min)
Temperature of onset of shrinkage (°C)
Initial stage of sintering (°C)
Maximum linear shrinkage rate temperature (°C)
Intermediate stage of sintering (°C)
Total shrinkage (%)
5
199 ± 8
521–626
824 ± 28
626–1100
26.5 ± 0.2
10
178 ± 25
460–581
766 ± 46
581–1101
25.5 ± 0.3
15
166 ± 63
438–573
720 ± 50
573–1046
26.4 ± 0.5
20
214 ± 18
434–571
700 ± 21
571–1096
25.8 ± 1.0
Table 1.
Parameters from the results of the microwave-assisted dilatometry in high-frequency (30 GHz) curves as a function of heating rates for the nanometric hematite.
According to the values in Table 1, there is a decrease in the initial and intermediate stage ranges can be observed, as well as a decrease in the maximum linear shrinkage temperature with the increase in the heating rate. Higher temperatures of onset of shrinkage can be observed with the increase in the heating rate. However, by the errors associated, no significant tendency can be stated. Except for the lowest heating rate (5°C/min) for maximum linear shrinkage rate, that is possible to state a higher temperature compared to the other heating rates.
These values were compared with the values reported by Togashi et al. [7], who used the same hematite nanopowder of this work and sintered it by conventional dilatometry. It is possible to observe an accentuated decrease in the onset of shrinkage temperature, using microwave energy at 30 GHz, and it varied approximately at 200°C, and with conventional heating approximately 700°C, indicating that the shrinkage process with the use of microwave at 30 GHz heating starts at lower temperatures. As it is highlighted in Figure 3(b), this fact can be also attributed to the trials when realized by microwave dilatometry to produce a bigger temperature gradient between the trial material and the measurement system material, once the temperature distribution is highly dependent on dielectric properties of the analyzed material and on the materials surrounding it, as demonstrated by Link et al. [23]. Thus, for systems with relative high dielectric losses, such as the hematite, the interaction and electromagnetic field absorption is higher in the sample than in the alumina of the measurement system.
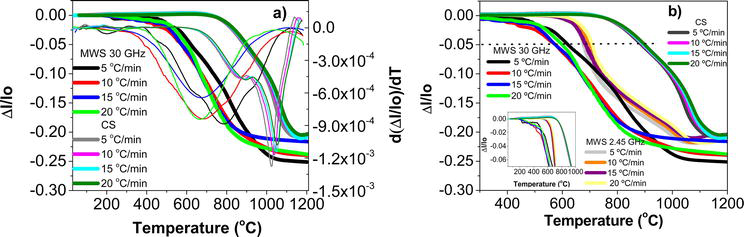
Figure 4(a) shows the graphical differences in the behavior of the linear shrinkage and the first derivative as a function of temperature in the microwave assisted in high-frequency (30 GHz) and conventional dilatometer measurements. Figure 4(b) shows the comparison between the microwave in high-frequency (30 GHz), microwave-assisted at 2.45 GHz (hybrid heating with the aid of a susceptor), and conventional dilatometer results, where the values at 2.45 GHz and conventional are from the literature and reported by Togashi et al. [7].
Figure 4.
Dilatometric curves (Δl/l0) and d(Δl/l0)/dT assisted by microwave in high frequency (30 GHz) and in conventional furnace from hematite nanopowder (a) and dilatometric curves (Δl/l0) as a function of temperature microwave assisted at 30 GHz, in comparison with microwave at 2.45 GHz and in conventional furnace with the same hematite nanopowders [7] (b).
According to the literature [7], the final relative density of the hematite, of the same origin, after conventional dilatometry was a little lower as compared to hematite sintered at 30 GHz, with a value of approximately 87%, while the samples sintered at 2.45 GHz had a relative density value of 91%. However, as can be observed in Figure 4, the samples shrank more with the microwave assisted at 30 GHz heating, showing a maximum linear shrinkage of 25.2%, while, according to the literature, in the conventional heating, this value was 20.8 and 21.8% at 2.45 GHz. The shrinkage is nonisotropic and a correction was made in the nonisothermal models.
Besides, in Figure 4, an accentuaded decrease in the envolved parameters is observed, such as: temperature of onset of shrinkage necessary for the microwave in high-frequency sintering, which is in the range of 200°C (insetFigure 4(b)), that is lower than with convetional heating, which was in the range of 673–676°C [7], to average reduction of approximately 500°C. In microwave at 2.45 GHz dilatometry this range was between 551 and 590°C, as reported in Ref. [7]; thus, there is an average reduction of 360°C in the temperature of onset of shrinkage with microwave sintering. The microwave at 2.45 GHz dilatometry has intermediates values, which are expected, since the susceptor used the sintering in this frequency was hybrid. Furthermore, theoretically in higher frequency (30 GHz) the absorbed power of the electromagnetic radiation by the material increases, increasing the contribution of the nonthermal effects during sintering. Link et al. [8] reported a reduction of 150°C in the sintering temperature, as well for the nanometric zirconia stabilized with yttria (36–37 nm) as for the PZT. The authors also reported a reduction in the dwell time from 60 to 10 min, when compared with the conventional sintering in order to obtain density values relatively similar. In this research, the reduction in the dwell time from 30 to 1 min was evaluated, and the results of densities were similar and of approximately 90% by microwave at 30 GHz heating.
There is a decrease in the beginning of the initial stage sintering temperature with the use of microwave in high-frequency heating compared with the literature data [7], the decrease in the microwave at 2.45 GHz heating is in the range of 100–185°C, while the decrease associated with the intermediate stage is in the range of 45–100°C. Compared with the conventional heating, this decrease is in the range of 270–365°C for the initial stage and 240–320°C for the intermediate stage of sintering. Once more, it was possible to observe lower temperatures necessary for the high-frequency (30 GHz) microwave sintering of the hematite. This is in accordance with what was published by Rybakov et al. [10], who reported a more drastic difference in the initial stage of sintering temperature, when compared with the intermediate and final stages of sintering of some ceramic materials, once the contribuition of the ponderomotive effect was higher [14].
An important difference to be highlighted in the comparison of the presented curves in Figure 4(b) is the intermediate behavior of the sintering kinetics at 2.45 GHz compared with 30 GHz and conventional sintering. In the temperature range of 740 and 800°C, close to the maximum shrinkage temperature, it is possible to observe a change in the slope of the linear shrinkage curve. At lower temperatures, the microwave assisted at 2.45 GHz dilatometry behaves similar to the conventional dilatometry. After the mentioned temperature range, the slope at 2.45 GHz is similar to the 30 GHz results. It is known that with hybrid heating when a susceptor material was used, the hematite behaves as a transparent material up to the range of 740–800°C and thereafter better absorbs the 2.45 GHz radiation, and temperature gradient between the hematite samples and the low loss alumina rod may occur. Thus, this temperature range corresponds to the so-called critical temperature, where predominant heating of the susceptor changes the predominant heating of the hematite sample [26]. The use of higher frequencies can eliminate the need of susceptor materials, since according to Eq. (1) the increase in frequency results in an increase in the absorbed power density as well as in the decrease in penetration depth (Eq. (2)) of the electromagnetic radiation.
In case of 30 GHz microwave sintering, the linear shrinkage curves slightly shift to lower temperature values with increasing heating rates. This can be explained by the volumetric heating effect going along with an inverse temperature profile and increasing temperature gradients with increasing heating rates [23]. However, this effect strongly depends on the dielectric losses of the material, since with higher dielectric losses and higher frequencies, and therefore lower penetration depth of the electromagnetic radiation, heating can be more superficial as well [6, 13], so that this trend in temperature shift can change. This is shown in Figure 2(b) for the hematite of this study, once there is low penetration depth and higher absorbed power.
In conventional heating where the shrinkage curves shift to higher temperatures, the opposite behavior can be seen. This is due to the delay in heat transfer because of low thermal conductivity of the powder compact, as also verified by Mazaheri et al. [27] for the conventional heating of zirconia nanopowder. Thus, the inversion in the tendency observed for the microwave in high frequency is possible to be associated with the increase in the diffusion mechanisms rate or a contribution of the inversion of temperature profiles. This contributes both to densification as grain growth for the ceramic materials. In case of the 2.45 GHz hybrid heating results, the trend with increasing heating rates is more comparable to conventional heating, due to the use of susceptor.
3.2 Densification kinetics
Obviously, only the decrease in the analyzed temperature parameters in the dilatometric trials, in an isolated form, cannot be the only resource in order to analyze the microwave-assisted sintering. Thus, for a better understanding of the densification process of a ceramic material during sintering, kinetics studies were performed, with approximate classic models, which are applied in submicron ceramic systems and conventional heating, and they were adapted to nanometric systems and microwave-assisted heating. All the trials were made in triplicate. And the temperature measurement was performed with a thermocouple, carefully placed in the sample. Once wrong temperature measurement could lead to wrong interpretation of the models.
The initial stage of the microwave-assisted sintering at 30 GHz was analyzed through the application of non-isothermal methods. Eq. (4) from Woolfrey-Bannister [24] shows the relationship between the product of temperature T and time derivative of the linear shrinkage dY/dt, and the linear shrinkage, Y = ∆l/lo with activation energy Q for densification in the initial stage of sintering
T2dYdt=Qn+1RYE4
where n is a characteristic factor for dominant sintering mechanism and R = 8.31 J/mol.K is gas constant.
In order to use Eq. (4), Eq. (5) from the Dorn model is needed, where the activation energy is calculated from the instantaneous shrinkage derivative as a function of temperatureV1 and V2, where V = dY/dT, referent to the temperatures T1 and T2, which delimitate the start and end of the initial stage of sintering.
Q≈RT1T2T1−T2lnV1V2E5
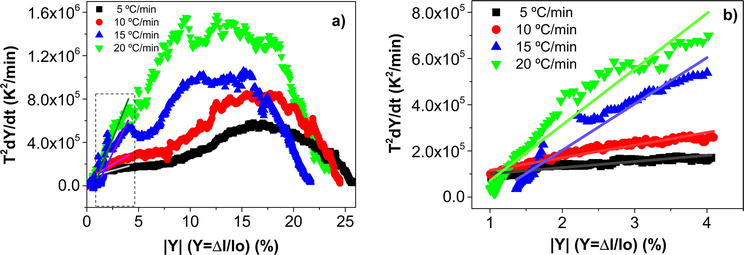
The initial stage of sintering is determined as the linear region of the graphic from Eq. (4), and they were obtained by the curve in Figure 5, as schematized below. Up to 1% there is a pre-initial stage of sintering where there is only the approach of the particles, but no significant shrinkage. Figure 5 highlights the region of the initial stage, and in detail, it is possible to see the entire graphic. The activation energy is calculated by Eq. (5), and in this case, with the slope of the curve in Figure 5, it is possible to calculate n, the dominant sintering mechanism. However, the value near to 0 indicates the nanoparticle rearrangement, and not the mechanism itself. In order to corroborate the range of initial stage sintering, here estimated between 1 and 4%, the graphic of LndY/dt vs. Y from Johnson model is presented. The linear region in the same range of Figures 5 and 6 only corroborates the estimation of the initial stage of sintering.
Figure 5.
Graphics from Woolfrey and Bannister model for the determination of the initial stage having T2dY/dt as a function of |Y| for different heating rates (a) and zoom linear fitting of the initial stage of sintering estimated between 1 and 4% of linear shrinkage (b).
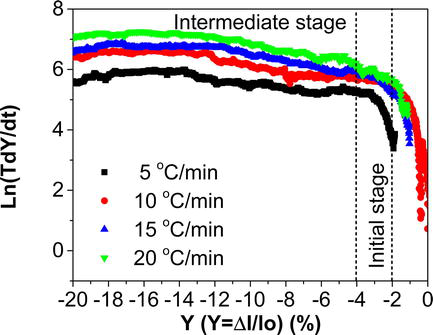
Figure 6.
Graphics from the Johnson model Ln(TdY/dt) as a function of Y with different heating rates.
The Johnson model considers the two spheres model, and the initial stage is analyzed by constant heating rate. Eq. (6) correlates the linear shrinkage rate (dY/dt) with particle size (g) and temperature (T) [28].
dYdt=A01gm1Ym2e−QRTTE6
A0 is a constant depending on the material and the sintering mechanism, m1 and m2 are exponents which have values of m1 = 1 and m2 = 0 for viscous flow, m1 = 3 and m2 = 1 for bulk diffusion, and m1 = 4 and m2 = 2 for grain boundary diffusion.
Y = ∆l/lo is the linear shrinkage in percentage, Q is the activation energy, and R is the gas constant. Adjusting and applying logarithm in both sides, Eq. (7) is obtained.
lnTdYdt=−QR1T+lnA0−m1lng−m2lnYE7
Figure 6 shows the graphic from Johnson model, corroborating a linear region of the graphic in the range of approximately 1 to 4%, corresponding to the initial stage of sintering.
According to Figures 5 and 6, the linear region corresponds to the initial stage, and it can be estimated, in this case, occurring from 1 to 4% of the linear shrinkage. In the literature, the initial stage is predicted when the densification reaches a maximum of 60–65%, depending on the studied material and green density [29]. Woolfrey [30] studied UO2 and estimated the initial stage between 600 and 1200°C in H2 atmosphere. The author concluded that with the decrease in green density, below the so-called critical range, there is a progressive decrease in the sintering rate. However, the green density does not affect the apparent activation energy values in the initial stage, despite it has an important effect in the intermediate stage.
In this study with hematite, starting with a nanometric powder, the analysis of the curves allowed the estimation of the initial stage up to 45% of the instantaneous density, corresponding to approximately 4% of linear shrinkage. This value was assumed, in view of the theory and together with the insightful analyses of Figure 5, knowing that the initial stage corresponds to the straight line of the graphic T2dY/dt vs. Y. Thus, in this case, the initial stage for the studied material ends at 45% of density, where begins immediately the intermediate stage.
The instantaneous density, ρ, of the samples in function of the shrinkage is given by Eq. (8), where ρ0 is the green density, l0 is the initial length of the sample and Δl is the linear shrinkage, where Δl = l-l0 [31].
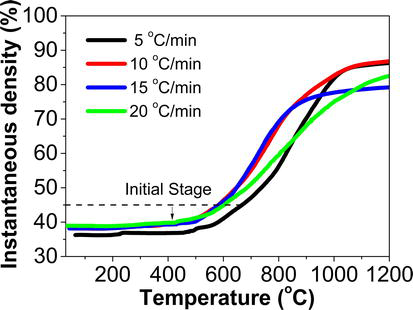
The instantaneous density values calculated by Eq. (8) are expected to be slightly smaller than the apparent density values calculated by Archimedes’ principle, as shown in Table IV later, since instantaneous density is an approximate statistical calculation, which considers only the linear shrinkage of the sample. While in the principle of Archimedes, the dry, humid, and immersed masses are estimated, considering the porosity of the sample. Figure 7 presents the densification graphic with the increase in temperature, depending on heating rate. In this case, it used the relative density, knowing that the theoretical density for hematite is 5.24 g/cm3.
Figure 7.
Graphic of instantaneous density vs. temperature with heating rates of 5 to 20°C/min.
Table 2 shows the obtained values of the activation energy for the densification in the microwave at 30 GHz initial stage of sintering in comparison to corresponding results obtained with 2.45 GHz [7] and conventional heating. These values were calculated by Eq. (5) after the estimation of the temperatures and shrinkages related to the begin and end of initial stage of sintering, as presented in the third row of Table 1.
Activation energy for the initial stage of sintering by microwave at 30 GHz of nanometric hematite compared with the results of the same material in Ref. [7].
As can be seen in Table 2 the activation energy obtained for initial stage sintering at 30 GHz decreases with increasing in heating rates. Furthermore, the values are significantly lower obtained for conventional and 2.45 GHz microwave sintering [7]. For conventional heating, the calculated range of activation energy for densification in the initial stage of sintering was between 179 and 168 kJ/mol, following the same tendency of decrease in energy values with the increase in heating rate. The microwave-assisted sintering at 2.45 GHz shows intermediate values in the range of 161–151 kJ/mol. Thus, a reduction of approximately 74 to 60%, compared with 2.45 GHz and 77 to 63%, with conventional, in the needed energy is observed for the densification in the initial stage.
The driving force for the sintering process is the decrease in free energy, by the reduction of energy associated with surfaces, and the process occurs by diffusion mechanisms and mass transport. It is reasonable to assume that these mechanisms are accelerated when using microwave radiation as an additional driving force, which would reduce the associated temperatures, as well as the energy for the initial stage of densification.
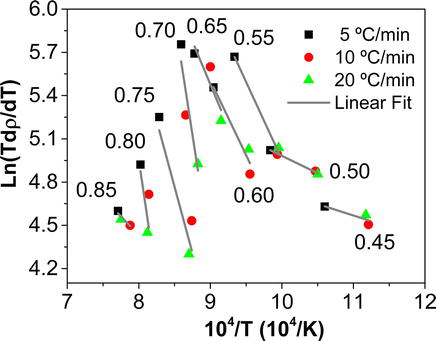
On the other hand, for the analysis of the intermediate stage of sintering the heating rate model Wang and Raj [25] was used. The authors estimated the intermediate stage range between 65 and 85% for a green density equal to 55%. Zhu et al. [2] estimated the intermediate stage between 70 and 90%, with an green density of approximately 48%. For this work, the intermediate stage range was identified between 45 and 85% of relative density. This estimation was made observing the end of the initial stage 4% of linear shrinkage and, in this case, corresponds to approximatedely 45% of relative density, as well as the observation of the curves lnTdρdT×10−4T in Figure 8. The intermediate stage corresponds to the straight lines of these graphics, which has inclinations with near values. Thus, by the cited method, the densification rate dρ/dT given by Eq. (9) depends on factors such as dimensionless constant A, the activation energy for densification in the intermediate stage Ea, a function f(p) which depends only on the density, the grain size G, and the dominant mechanism of sintering m and the heating rate dT/dt.
Figure 8.
Arrhenius plot of Ln (Tdρ/dT) as a function of the inverse of temperature in the range of 45 to 85% of relative density, corresponding to the intermediate stage of microwave at 30 GHz sintering of hematite.
It is assumed that after sintering, the grain size g depends solely on the density, and thus, through an Arrhenius plot of the densification as a function of inverse temperature, at the different heating rates, the activation energy for densification Ea for intermediate stage of sintering can be estimated. The mentioned Arrhenius plot is presented in Figure 8 for 30 GHz sintering and for relative densities in the range from 45 to 85%, which corresponds to intermediate stage.
And by Eq. (10), the activation energy for the intermediate stage of microwave-assisted sintering at 30 GHz of the nanometric (30 nm) hematite was calculated to 68 ± 15 kJ/mol. According to the literature [7], the activation energy for the intermediate stage using the microwave-assisted heating at 2.45 GHz dilatometric data was 273.1 ± 28.0 kJ/mol and for the conventional heating was 485.0 ± 34.0 kJ/mol for the same material. It is possible to observe a reduction of approximately 70 and 83% in the necessary energy for densification, when compared with microwave-assisted at 2.45 GHz and conventional heating, respectively, similar to the results obtained for the initial stage of microwave at 30 GHz sintering.
The microwave heating at 30 GHz of frequency, which has the electromagnetic wave in the millimetric range, can raise the nonthermal effect, reducing the temperatures compared with the conventional heating, besides the reduction observed in the densification kinetics. This nonthermal effect possibly generates the increase in the mass transport and diffusion, of thermally activated processes, such as sintering, which can be explained by the action of the ponderomotive force [4, 12]. Considering that these forces depend on mobile vacancies in ionic crystalline solids, as ceramic materials, they carry effective electrical charges which move and oscillate in the applied frequency; in this way, in higher frequencies, there is the increase in the processes of mass transport in ionic crystalline solids and the presence of grain boundaries near the pores act as vacancies sources, increasing the diffusivity in this region, and the nanometric materials potentially increase also the diffusivity compared to submicrometric materials [12, 32]. And this increase of mass transport, which results from the ponderomotive effect, is caused by an additional driving force that influences the reaction kinetics of sintering. However, the influence of the microwave radiation action decreases with the time of process, as a consequence of the changes in the microstructure of the sample itself, such as the neck formation and open porosity closure [14, 15].
3.3 In situ electrical resistivity
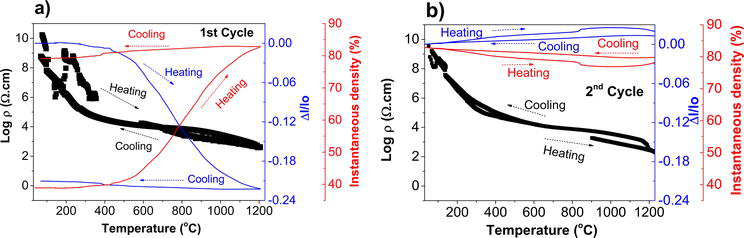
Parallel to dilatometric measurements, in situ electrical resistivity measurements were performed during 30 GHz sintering for nanometric (30 nm) hematite samples as a function of temperature, and with a heating rate of 20°C/min. This allows to evaluate the effect of densification on the electrical resistivity of the material. Values of ∆l/lo, log ρ and relative density (according to Eq. (8)) as a function of temperature are shown in Figure 7. With the results of the first analysis of the heating cycle in the green sample (first cycle) in Figure 9(a), the second analysis referring to the sintered sample (second cycle) in Figure 9(b).
Figure 9.
In situ electrical resistivity of nanometric hematite concurrent to microwave at 30 GHz dilatometry at 20°C/min (a) first cycle and (b) second cycle of heating.
Table 3 presents the maximum and minimum electrical resistivity measured in these trials, according to Eq. (3).
First cycle
Second cycle
Pmax [Ω.cm]
1.7×10¹⁰
6.0×10⁸
Pmin [Ω.cm]
3.8×10²
4.3×10²
Table 3.
Maximum and minimum electrical resistivity measured during trial in situ of hematite in microwave at 30 GHz.
The in situ electrical resistivity values measured were in the range of 3.8×10² to 1.7×10¹⁰ Ω.cm in the first cycle of heating and between 4.3×10² and 6.0×10⁸ Ω.cm in the second cycle of heating. It is possible to observe in the first cycle of heating, which refers to the densification cycle of the sample, the decrease in electrical resistivity values was in function of the increase in the relative density (porosity reduction). In the second cycle of heating (annealing), the sintered sample has a density around 85% and lower values of electrical resistivity in temperatures are observed below 200°C, as expected. Thus, the direct relationship between the material electrical behavior and density of the sample was observed.
It is known that the electrical conductivity is an intrinsic property of the material related to the facility of electrons transport; thus, the resistivity indicates the imposed resistance to this electronic movement [33]. In this sense, Kultayeva et al. [34] studied SiC containing alumina as a sintering aid and concluded that with the decrease in porosity, the electrical conductivity of the SiC was improved. This property depends strongly on microstructure and porosity of the material.
The results obtained and showed in the second cycle of heating from Figure 9(b) demonstrate the semiconductor behavior of hematite, by the reduction in the values of electrical resistivity as a function of the increase in temperature, by the greater diffusion energy from the charge carries with the increase in temperature.
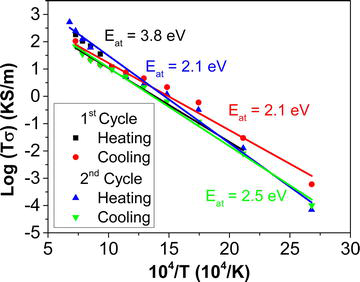
Others works, such as Link et al. [16], studied the metalic compacts sintering (pure iron and with graphite) using the same measurement system of in situ electrical resistivity as described in this work. The authors observed lower values of resistivity at 300°C, corresponding to the interparticle contact, as in the range of 600 to 700°C, due to the metalic powders starting to sinter. Tian-Ming et al. [35] studied the effect of porosity on electrical resistivity of carbon-based materials for electrode applications, and the authors demonstrated that both open and closed porosities increase the electrical resistivity values. However, the open porosity is the one that has the greater influence in the values of electrical properties of the material. Figure 10 presents the Arrhenius plot, considering a graphic of Log Tσ vs. 104/T.
Figure 10.
Arrhenius plot of log Tσ vs. 104/T during heating and cooling in the first and second cycles.
The dependence of the electrical conductivity (σ) with the temperature (T) is expressed by Eq. (11).
σ=σ0Te−EatkTE11
σ0 is a pre-exponential factor related with conductivity, Eat, the activation energy of the conduction process and k the Boltzmann constant, and its value is 13,806×10−22 J/K or 86,177×10−4 eV/K.
Thus, applying logarithm for both sides, Eq. (12) is obtained.
logTσ=logσ0−EatkTE12
This activation energy, differently of the activation energies previously presented, represents the needed energy in order to the electrons move inside the structure of the material [36]. The activation energy, in this case, decreases in the first cycle from heating to cooling. Going from 3.8 to 2.1 eV. The energy increases in the second cycle in the cooling process to 2.5 eV. Normally, lower values of activation energy are related to higher electrical conductivity values, once the energy needed for electron movement would be lower, generating thus, better mobility [36]. The decrease of the value of activation energy in the first cycle is coherent with the fact that densification is happening during sintering, and the conductivity increases during heating.
3.4 Final microstructure
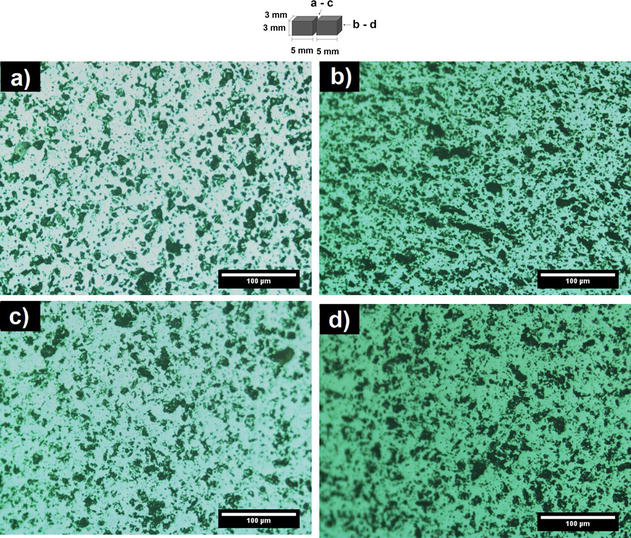
For the microstructural evaluation, the samples sintered at 30 GHz with the heating rates of 5 and 20°C/min were sectioned in half of its length, as described in the scheme above Figure 11, to evaluate the heating homogeneity. Each section was carefully grinded and polished and analyzed using optical microcopy. The results are presented in Figure 11.
Figure 11.
Optical micrographs of hematite after sintering at 30 GHz with a final temperature of 1200°C, dwell time of 1 minute, and heating rate of 5°C/min (a-b) and 20°C/min (c-d).
The optical micrographs in Figure 10 show a slight change in open porosity distribution. According to the evaluation with ImageJ program, in the threshold analysis, the percentage of open porosity is approximately 36–42% for (b-d) image and 30–28% for (a-c) images, respectively. So, it is possible to conclude that on the surface (b-d), the porosity is higher than in the center (a-c). This may indicate a thermal gradient between the surface and the center of the sample, which is expected in microwave sintering. The presence of cracks or flaws through the sample volume was not observed, indicating that there is no differential shrinkage.
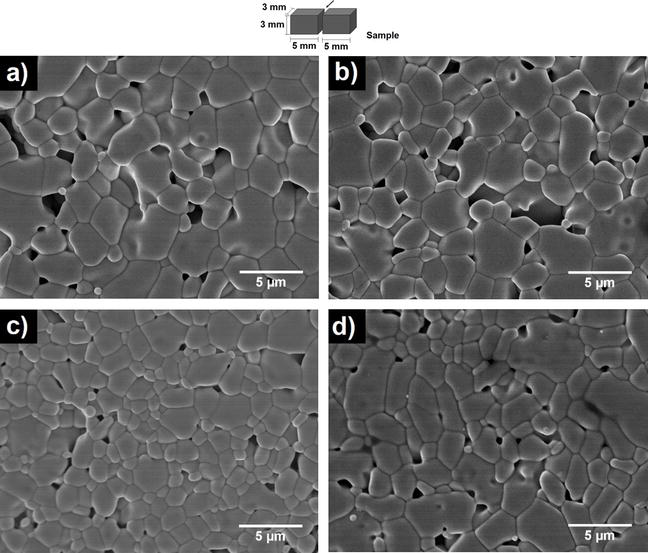
The final microstructure analyzed by SEM images of the samples submitted to microwave assisted dilatometry at 30 GHz in the different heating rates is presented in Figure 12.
Figure 12.
SEM images of hematite after 30 GHz microwave sintering at 1200°C, dwell time of 1 minute, and heating rate of (a) 5°C/min, (b) 10°C/min, (c) 15°C/min, and (d) 20°C/min.
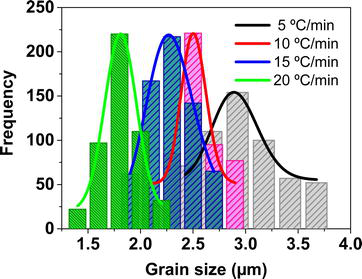
Figure 12 analysis shows the SEM micrographs and the final grain size distribution as a function of heating rate from 5 to 20°C/min. The reduction of the average grain sizes at higher heating rates can be observed. The final grain size distribution tends to be narrower at higher heating rates, as presented in Figure 13. The grain size distribution histograms, as represented in Figure 13, were fitted into a LogNormal curve distribution, according to Eq. (13).
Figure 13.
Comparative histograms from the average grain sizes with different heating rates.
y=y0+Aω′2πe−lnxxc22ω2E13
y and y0 are free parameters, and y0 tends to zero, A is an amplitude factor, ω′ the width of the peak associated to the dispersion, and xc the central point of the peak, corresponding to the average grain diameters. The values of ω′ in the different heating rates were: 0.097, 0.085, 0.084, and 0.047 for 5, 10, 15, and 20°C/min, which indicates with the narrower grain size distribution with higher heating rates.
Furthermore, the values of the average grain size are presented in Table 4 with the final relative density values, calculated by the principle of Archimedes.
Heating rate (°C/min)
Average grain size (μm)
Relative density (%)
5
2.8 ± 0.4
88 ± 2
10
2.5 ± 0.3
87 ± 1
15
2.3 ± 0.2
86 ± 3
20
1.9 ± 0.2
84 ± 3
Table 4.
Average grain size and final relative density of hematite after at 30 GHz microwave sintering.
This tendency of lower grain sizes and lower densities with the increase in heating rate was expected, as reported in the literature by Chu et al. [37] who evaluated this kind of behavior of ZnO under conventional sintering, where lower grain sizes were observed at higher heating rates. Bykov et al. [38] observed the sintering kinetics by the isothermal method and obtained lower grain sizes using millimeter wave sintering compared to the conventional sintering.
Lange [39] studied the conventional sintering of alumina and postulated that the maximum linear shrinkage rate occurred with a relative density of 77%. The author observed the alteration in sintering kinetics. Until the temperature associated with this density, the densification processes dominate, and after that, the grain growth happens. For the hematite analyzed in this work, this maximum shrinkage rate temperature occurs in the range of densities of 65%. Thus, from this densification higher grain growth is expected, even in case of high-frequency microwave sintering.
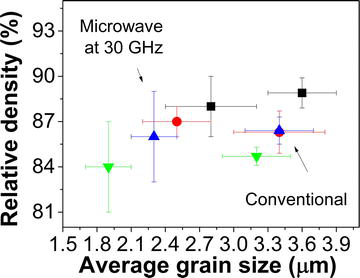
The average grain sizes in the investigated range of heating rates were in the range from 1.9 to 2.8 μm for 30 GHz microwave sintering. In case of conventional sintering of identical hematite powder, the range was 3.2 to 3.6 μm [7]. Figure 14 shows the comparison between these values in function of apparent relative density. There is a clear effect of heating rate on the final grain size and relative final density for both microwave heating at 30 GHz and conventional heating [7].
Figure 14.
Relative density as a function of the average grain sizes of hematite sintered by microwave at 30 GHz and conventional [7] at 1200°C in the different heating rates.
Higher density values were observed at lower heating rates resulting in larger grain sizes after sintering. This observation is consistent with the fact that during sintering, there is a strong competition between densification and grain growth, due to the fact that both processes have the same driving force, which is the decrease in the free energy of the system, and specifically in this case, the decrease in the free energy associated with surfaces [40].
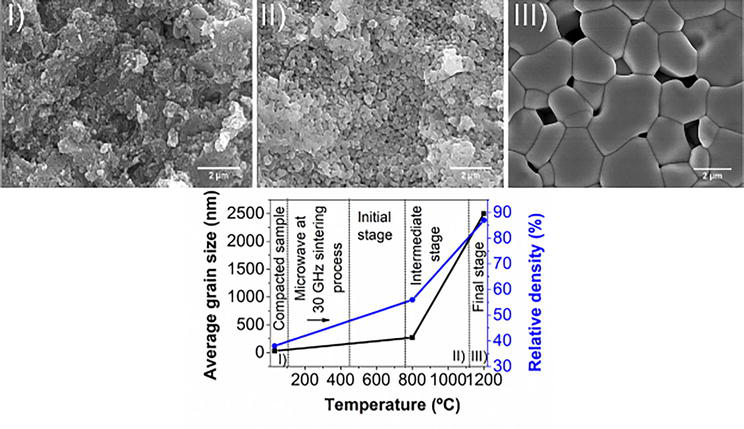
The evolution in grain size, density and microstructure, starting from the nanometric hematite compact, until reaching the beginning of the intermediate stage, near to the temperature of 800°C and up to the final stage obtained at 1200°C is presented in Figure 15. The micrographs refer to microwave sintering at 30 GHz performed with a heating rate of 10°C/min.
Figure 15.
Evolution of the grain size, density, and microstructure of the compacted hematite (30 nm) during microwave sintering at 30 GHz and heating rate of 10°C/min.
From the microstructural evolution presented in Figure 15, it can be observed that the intermediate stage of sintering is responsible for pore rounding, neck formation that show that the beginning of the diffusion mechanisms favors the grain growth, as well as the densification during microwave-assisted sintering at high frequency (30 GHz). The average grain size with a heating cycle up to 800°C, where the intermediate sintering stage started, was 270 ± 30 nm with a grain growth of approximately 90% in relation to the initial size of the nanopowders of 30 nm. The final bulk density in this condition was approximately 56% measured by the immersion method. The heating rate was 10°C/min. At the end of the process, the obtained grain size was 2.5 ± 0.3 μm at a relative density of about 87%
The sintering kinetics models from nonisothermal methods, such as the classics by Woolfrey and Bannister and by Dorn for the initial stage of sintering, and by Wang and Raj, for the intermediate stage, have been applied to in situ dilatometer measurement results during 30 GHz microwave sintering of hematite nanopowders with heating rates varying from 5 to 20°C. Densification to relative densities close to 90% was achieved, regardless of the heating rate. The results demonstrated the effectiveness of using these models.
The results showed that with all sintering conditions, the onset of shrinkage as well as the ranges of initial and intermediate stages of sintering was observed at lower temperatures when compared to 2.45 GHz microwave sintering as well as conventional sintering of the same material. Based on these models, the activation energies for the initial stage and for the intermediate stage of sintering have been estimated to be 39–66 kJ/mol and 68 kJ/mol, respectively. Compared to 2.45 GHz and conventional sintering, those activation energies were significantly lower, which might be an indication of nonthermal effects due to additional driving forces such as the ponderomotive force.
Less grain growth was observed compared to conventional heating. For microwave sintering at 30 GHz grain sizes between 1.9 and 2.8 μm were obtained. It was also observed that with increasing heating rates the average grain size was smaller and has narrower grain size distribution. Moreover, in all cases, the microstructures were homogeneous, showing controlled and uniform heating.
From the in situ electrical resistance measurements, the decrease in resistivity as a function of the increase in the density of the sample could be observed, as well as a semiconductor behavior of the hematite.
The authors gratefully acknowledge the financial support of the Brazilian research funding agencies: FAPESP (Process no. 2017/13769-1), CAPES (Process 88882.332729/2019-01 and 88887.370181/2019-00), CNPq (Process 305129/2018-0 and 165313/2017-0). This study was financed in part by the Coordenação de Aperfeiçoamento de Pessoal de Nível Superior – Brasil (CAPES) – finance code 001.
References
1.Agrawal D. Microwave sintering of ceramics, composites and metal powders. In: Fang Z, editor. Sinter. Adv. Mater. Fundam. Process. Duxford, Kidlington, United Kingdom and Cambridge, United States of America: Woodhead Publishing; 2010. pp. 222-248
2.Zhu J, Ouyang C, Xiao S, Gao Y. Microwave sintering versus conventional sintering of NiCuZn ferrites. Part I: Densification evolution. Journal of Magnetism and Magnetic Materials. 2016;407:308-313
3.Zuo F, Badev A, Saunier S, Goeuriot D, Heuguet R, Marinel S. Microwave versus conventional sintering: Estimate of the apparent activation energy for densification of α-alumina and zinc oxide. Journal of the European Ceramic Society. 2014;34:3013-3110
4.Zuo F, Saunier S, Marinel S, Chanin-Lambert P, Peillon N, Goeuriot D. Investigation of the mechanism(s) controlling microwave sintering of α-alumina: Influence of the powder parameters on the grain growth, thermodynamics and densification kinetics. Journal of the European Ceramic Society. 2015;35:959-970
5.Brosnan KH, Messing GL, Agrawal DK. Microwave sintering of Alumina at 2.45 GHz. Journal of the American Ceramic Society. 2003;86:1307-1312
6.Sudiana IN, Mitsudo S, Inagaki S, Ngkoimani LO, Rianse U, Aripin H. Apparent activation energy in high frequency microwave sintering of alumina ceramic. Advanced Materials Research. 2015;1123:391-396
7.Togashi MM, Perdomo CPF, Kiminami RHGA. Densification kinetics of nano-hematite using microwave assisted dilatometry. Ceramics International. 2020;46:28546-28560
8.Link G, Rhee S, Feher L, Thumm M. Millimeter wave sintering of ceramics. In: Heinrich JG, Aldinger F, editors. Ceram. Mater. Components Engines. Germany: Wiley-VCH Verlag GmbH, Winheim; 2001. pp. 457-461
9.Thumm M, Feher L, Link G. Micro- and millimeter-wave processing of advanced materials at Karlsruhe research center. In: Nov. Mater. Process. By Adv. Electromagn. Energy Sources, Proceedings of the International Symposium on Novel Materials. Processing by Advanced Electromagnetic Energy Sources March 19–22, 2004, Osaka, Japan. 2005. pp. 93-98
10.Rybakov KI, Olevsky EA, Krikun EV. Microwave sintering: Fundamentals and Modeling. Journal of the American Ceramic Society. 2013;96:1003-1020
11.Paul F, Menesklou W, Link G, Zhou X, Haußelt J, Binder JR. Impact of microwave sintering on dielectric properties of screen printed Ba0.6Sr0.4TiO3 thick films. Journal of the European Ceramic Society. 2014;34:687-694
12.Birnboim A, Gershon D, Calame J, Birman A, Carmel Y, Rodgers J, et al. Comparative study of microwave sintering of zinc oxide at 2.45, 30, and 83 GHz. Journal of the American Ceramic Society. 1998;81:1493, 1501
13.Sudiana IN, Ito R, Inagaki S, Kuwayama K, Sako K, Mitsudo S. Densification of alumina ceramics sintered by using submillimeter wave gyrotron. Journal of Infrared, Millimeter, and Terahertz Waves. 2013;34:627-638
14.Rybakov KI, Olevsky EA, Semenov VE. The microwave ponderomotive effect on ceramic sintering. Scripta Materialia. 2012;66:1049-1052
15.Rybakov KI, Semenov VE, Link G, Thumm M. Preferred orientation of pores in ceramics under heating by a linearly polarized microwave field. Journal of Applied Physics. 2007;101(084915):1-5
16.Link G, Mahmoud MM, Thumm M. Dilatometric study and in situ resistivity measurements during Millimeter wave sintering of metal powder compacts. Processing and properties of advanced ceramics and composites. IV Ceramic Transactions. 2012;234:145-149
17.Pomar CD, Martinho H, Ferreira FF, Goia TS, Rodas ACD, Santos SF, et al. Synthesis of magnetic microtubes decorated with nanowires and cells. AIP Advances. 2018;8:045008
18.Li J, Chu D. Energy band engineering of metal oxide for enhanced visible light absorption. In: Lin Z, Ye M, Wang M, editors. Multifunctional Photocatalytic Materials for Energy. Duxford, Kidlington, United Kingdom and Cambridge, United States of America: Woodhead Publishing; 2018. pp. 49-78
19.Muhajir M, Puspitasari P, Razak JA. Synthesis and applications of hematite α-Fe2O3: A review. Journal of Mechanical Science and Technology. 2019;3:51-58
20.Ramya SIS, Mahadevan CK. Effect of calcination on the electrical properties and quantum Cofinement of Fe2O3 Nanoparitcles. International Journal of Research in Engenering and Technology. 2014;3:570-581
21.Soldatov S, Umminger M, Heinzel A, Link G, Lepers B, Jelonnek J. Dielectric characterization of concrete at high temperatures. Cement and Concrete Composites. 2016;73:54-61
22.Metaxas AC. Foundations of Electroheat, a Unified Approach. 1st ed. Chichester, United Kingdom: John Wiley & Sons; 1996
23.Link G, Rhee S, Thumm M. Dilatometer measurements in a mm-wave oven. In: Willert-Porada M, editor. Advances in Microwave and Radio Frequency Processing. Berlin, Heidelberg, Germany: Springer; 2006. pp. 506-513
24.Woolfrey JL, Bannister MJ. Nonisothermal techniques for studying initial-stage sintering. Journal of the American Ceramic Society. 1972;55:390-394
25.Wang J, Raj R. Estimate of the activation energies for boundary diffusion from rate-controlled sintering of pure alumina, and alumina doped with zirconia or Titania. Journal of the American Ceramic Society. 1990;73(5):1172–1175
26.Menezes RR, Souto PM, Kiminami RHGA. Microwave sintering of ceramic materials. In: Lakshmanan A, editor. Sinter. Ceram. - New Emerg. Tech. London, UK, London: Intech Open; 2012. pp. 3-25
27.Mazaheri M, Simchi A, Dourandish M, Golestani-Fard F. Master sintering curves of a nanoscale 3Y-TZP powder compacts. Ceramics International. 2009;35:547-554
28.Johnson DL. New method of obtaining volume, grain-boundary, and surface diffusion coefficients from sintering data. Journal of Applied Physics. 1969;40:192-200
29.Barsoum MW. Fundamentals of Ceramics. 2nd ed. Boca Raton, United States of America: CRC Press; 2019
30.Woolfrey JL. Effect of green density on the initial-stage sintering kinetics of UO2. Journal of the American Ceramic Society. 1972;55:383-389
31.Rahaman MN. Ceramic Processing and Sintering. 2nd ed. Florida: Taylor and Francis group; 2003
32.Rybakov KI, Semenov VE. Mass transport in ionic crystals induced by the ponderomotive action of a high-frequency electric field. Physical Review B. 1995;52:3030-3033. DOI: 10.1103/physrevb.52.3030 accessed February 15, 2023
33.Heaney MB. Electrical conductivity and resistivity. In: Webster JG, editor. Electrical Measurement, Signal Processing, and Displays. Boca Raton, United States of America: CRC Press; 2003
34.Kultayeva S, Ha JH, Malik R, Kim YW, Kim KJ. Effects of porosity on electrical and thermal conductivities of porous SiC ceramics. Journal of the European Ceramic Society. 2020;40:996-1004
35.Tian-ming S, Li-min D, Chen W, Wen-Li GUO, Li W, Tong-xiang L. Effect of porosity on the electrical resistivity of carbon materials. New Carbon Materials. 2013;28:349-354
36.Sharma M, Yashonath S. Correlation between conductivity or diffusivity and activation energy in amorphous solids. The Journal of Chemical Physics. 2008;129:144103
37.Chu MY, Rahaman MN, De Jonghe LC, Brook RJ. Effect of heating rate on sintering and coarsening. Journal of the American Ceramic Society. 1991;74:1217-1225
38.Bykov Y, Holoptsev V, Makino Y, Miyake S, Plotnikov I, Ueno T. Kinetics of densification and phase transformation at microwave sintering of silicon nitride with alumina and yttria or ytterbia as additives. Journal of the Japan Society of Powder and Powder Metallurgy. 2001;48(6):558-564
39.Lange FF. Sinterability of agglomerated powders. Journal of the American Ceramic Society. 1984;67:83-89
40.German RM. Thermodynamics of sintering. In: Fang ZZ, editor. Sintering of Advanced Materials. Fundamentals and processes: Woodhead publishing; 2010
Written By
Marina Magro Togashi, Claudia P. Fernandez Perdomo, Guido Link, Jhon Jelonnek and Ruth Herta G.A. Kiminami
Submitted: 24 April 2023Reviewed: 03 May 2023Published: 21 June 2023
 Open access peer-reviewed chapter