Open Access is an initiative that aims to make scientific research freely available to all. To date our community has made over 100 million downloads. It’s based on principles of collaboration, unobstructed discovery, and, most importantly, scientific progression. As PhD students, we found it difficult to access the research we needed, so we decided to create a new Open Access publisher that levels the playing field for scientists across the world. How? By making research easy to access, and puts the academic needs of the researchers before the business interests of publishers.
We are a community of more than 103,000 authors and editors from 3,291 institutions spanning 160 countries, including Nobel Prize winners and some of the world’s most-cited researchers. Publishing on IntechOpen allows authors to earn citations and find new collaborators, meaning more people see your work not only from your own field of study, but from other related fields too.
To purchase hard copies of this book, please contact the representative in India:
CBS Publishers & Distributors Pvt. Ltd.
www.cbspd.com
|
customercare@cbspd.com
Permanent magnet synchronous motors (PMSM) are widely used in applications such as industrial, automotive, robotics, medical, and military applications. External rotor permanent magnet synchronous motors (ER-PMSM), a type of PMSM, provide high output torque at low volume. Although potentially usable in robotic and military applications, they are often used in drones due to the cogging torques involved in the output torques. In this chapter, using Model Predictive Control (MPC) and PID controller, position control of ER-PMSMs will be presented. The controlled autoregressive and integrated moving average (CARIMA) model is determined for the MPC algorithm. Experimental studies are carried out with these position control structures. In addition, the selected controllers will be compared using different position references. Their advantages and disadvantages will be explained in detail.
Keywords
model predictive control
external rotor permanent magnet synchronous motor
field oriented control
controlled autoregressive and integrated moving average
*Address all correspondence to: goksel.kizir@roketsan.com.tr
1. Introduction
Model predictive control is frequently preferred in industrial, automotive, and military applications recently as a control method. The main reason for this is the desire to control the system in the most optimal way. If there is a model to represent the system, optimum control signals can be produced with model predictive control.
One of the application areas of MPC is the control of electrical machines. The definition of electrical machines is a device that converts electrical energy into mechanical energy. Permanent Magnet Synchronous Motors (PMSMs), which make this conversion in small volumes and high efficiency, are one of the most preferred types of electrical machines. PMSMs are used in many industrial, automotive, robotic, and military applications. There are many methods to control PMSMs with and without sensors in the literature [1, 2, 3, 4, 5, 6, 7].
Two areas where PMSMs are frequently preferred for similar control purpose are robotics and military applications. PMSMs are used as actuators that control a joint in robotic applications, as well as control the angular position of a vane in military applications. This position control may need to be of high precision in both areas. Since position data is needed as feedback in position control of PMSMs, sensorless control methods cannot be applied in these applications. In such applications, the control methods preferred recently are intelligent control methods or model-based control methods [8, 9, 10, 11, 12].
Thanks to the developing technology and developing production infrastructures, PMSMs in different structures can be produced. Coreless PMSMs, a type of PMSM, can produce constant torque. The stator windings of Coreless PMSMs are air wound instead of a core. In this way, much lower cogging torque occurs at output torques compared to other PMSMs. Due to their low cogging torque, they are preferred in robotics and military applications [13, 14, 15, 16].
The main drawback of these coreless PMSMs is their low output torque. In order to meet high output torque requirements for relatively small actuator designs, higher transmission ratios may be considered. However, designing an actuator with higher transmission ratios arise other considerations such as efficiency, backlash, etc.
ER-PMSM has gradually become popular with the characteristics of low loss, simplistic-compact structure, and reliable in operation. Unlike Coreless PMSMs, ER-PMSMs can provide high output torques at a similar volume. Since the stator windings of most of the ER-PMSMs have cores, cogging occurs in the output torques of the ER-PMSMs. This cogging torque causes a disruption effect on the control. There are studies in the literature for modeling/reducing the cogging torque [17, 18, 19, 20]. However, ER-PMSMs do not have position control application. In addition, most of the developed ER-PMSMs are used in drones.
In this study, which aims to produce high output torque with low transmission ratio, the use of ER-PMSMs as an actuator in an application that requires precise position control is evaluated. It is planned to increase the efficiency of the transmission mechanism with a low transmission ratio. In addition, with the position controller to be designed, it is desired to minimize the effect of the cogging torque on the control.
MPC is selected for position control. Additionally, a comparison is added in order to evaluate the performance of MPC. The sequential PID control structure, which is frequently preferred for motor control in the literature, is preferred for this comparison. In the third part, there are four different test scenario results of two controllers. The fourth section is the section where the test results are discussed. In the last part, the results of the study are evaluated.
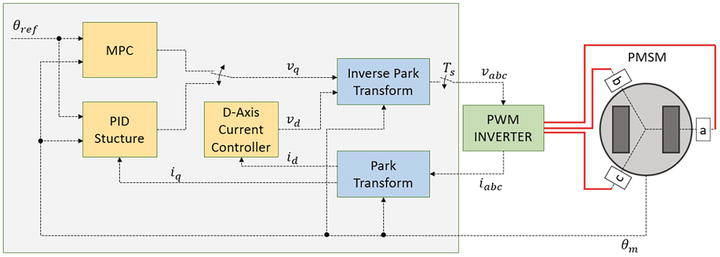
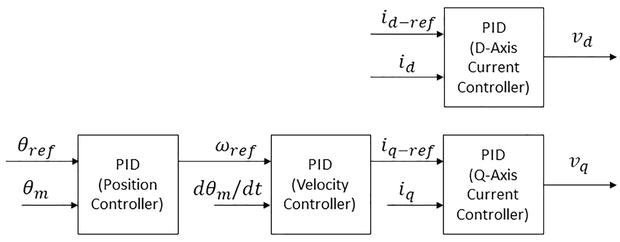
The block diagram of PMSM and control strategies in this chapter is given in Figure 1. A three-phase PMSM is driven by a PWM inverter circuit. Three-phase control voltage is applied to the PWM inverter circuit, and the three-phase current value is read by analog sensors in this circuit. In addition, the angular position of the PMSM is read by an incremental encoder.
Figure 1.
PMSM and control strategies block diagram.
In the control algorithm, the rotor position of PMSM is controlled by both MPC and PID. Both control structures calculate the PMSM q-axis control voltage. While MPC only needs angular position data for this calculation, PID controller structure also needs the q-axis current of the PMSM. In addition to the position control, the d-axis current of the PMSM is kept at zero by a different controller. In this chapter, PID controller structure is chosen as the d-axis current controller.
Obtained d- and q-axis voltages are converted to PMSM phase voltages by Inverse Park Transform. In addition, the d- and q-axis currents required by the PID controller, and the d-axis current controller are obtained by Park Transform.
In the second part, PMSM model and control strategies are explained. Field oriented control (FOC), which is the PMSM driving method, is explained, the PID controller structure and the selection criteria of the PID controller coefficients are mentioned. Finally, the determined MPC method is explained in detail.
2.1 PMSM model
PMSMs are synchronous motors with permanent magnets on their rotors and windings on their stators [7]. The stator windings are usually three-phases, although five- or eight-phases configurations are also available. Considering the positions of their rotors, PMSMs can be classified in two ways as external (outer) rotor and inner rotor.
Although this difference in design changes the speed and torque characteristics of both motors, their mathematical models are the same. PMSM mathematical models are available for both three phases (abc-phases) and two axes (dq-axis). Since PMSM control can be handled linearly with two-axis modeling, two-axis modeling is preferred in this study. The equations of the PMSM according to the dq-axis set are as follows.
vd=Rsid−ωLqiq+ρLdid+λpmE1
vq=Rsiq+ωLdid+λpm+ρLqiqE2
Te=3p/2λpmiq+Ld−LqidiqE3
Te−Tl−Tcoggθm=ρωmJ+BωmE4
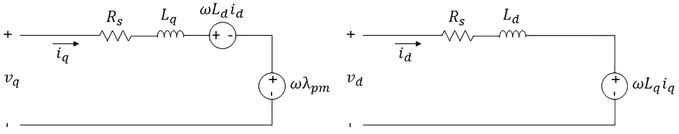
Rd and Rq parameters in the equations represent the relevant axis resistances. Ld and Lq represent the relevant axis inductances. ω is electrical where ωm is mechanical velocity. p is the number of pole pairs. B is the friction coefficient, λpm is magnet mutual flux linkage. Te is electrical torque generated by the motor and Tcogg is the cogging torque depending on the motor position θm. J is inertia of rotor. ρ is the derivative operator. The equivalent circuit of PMSM electrical equations is as in Figure 2.
Figure 2.
Equivalent circuit of PMSM electrical equations.
While controlling PMSMs, control voltage is applied to q-axis, and a voltage is applied to the d-axis in order to keep the d-axis current at zero. Assuming the d-axis current is controlled as zero, Eqs. (2) and (3) simplify as in Eqs. (5) and (6).
vq=Rsiq+ωλpm+ρLqiqE5
Te=3p/2λpmiqE6
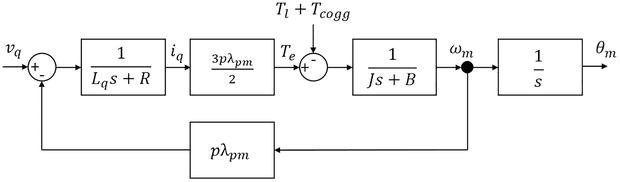
PMSM transfer function to be created using Eqs. (4)–(6) will be as in Figure 3.
Figure 3.
PMSM transfer function block diagram.
In MPC, the PMSM mathematical equations that are arranged for the motor position are the output and the q-axis voltage is the input of the system. The transfer function in MPC is given in Eq. (7).
Gpmsm=3/2∗p∗λpmLqJs3+RsJ+LqBs2+3/2pλpm2+RsBsE7
While obtaining this equation, it is assumed that current flow through the d-axis is zero. Hence the PMSM mathematical equations are simplified. The d-axis current of the PMSM is kept at zero with a PID controller.
2.2 Field oriented control
The Field Oriented Control (FOC) is a method based on controlling the stator currents represented by vectors. FOC gives proficient control capability over the full torque and speed ranges. Its implementation requires transformation of stator currents from the stationary reference frame to the rotor flux reference frame (also known as d-q reference frame). It was originally developed for high-performance motor applications that are required to operate smoothly.
Field oriented controlled machines need two components as input references: the torque component (aligned with the q-axis) and the flux component (aligned with d-axis). The torque reference of the PMSM is controlled by q-axis. The PMSM flux is kept constant by controlling of the d-axis. Besides, d-axis is used for parameter estimation in some applications [9].
The Park Transformation is a transformation between phases of the PMSM and axis of the FOC. The Park transformation converts abc-phases of the PMSM to dq-axis of the FOC and The Inverse Park Transformation coverts dq-axis of the FOC to abc-phases of the PMSM. Park’s Transformation sdq=Tabcdqθsabc and inverse Park’s transformation sabc=Tdqabcθsdq is given in Eqs. (8) and (9) respectively where θ is electrical angle.
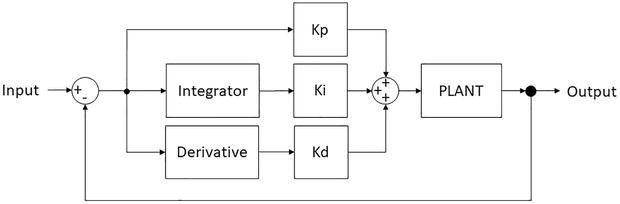
The classical PID controller transfer function is as in Eq. (10). The PID controller structure is shown in Figure 4.
Figure 4.
Block diagram of PID Controller.
Gpid=Kp+Kis+KdsE10
The PID control structure used in this study is shown in Figure 4. A cascade structure is preferred as the PID control structure. The output of the position controller is set as the velocity controller reference where the output of the velocity controller is the q-axis current controller reference. The d-axis current reference is set to zero. PMSM position and currents are measured from the system. The velocity value is obtained by taking the discrete derivative of the measured position value.
PID controller outputs are produced on dq-axis and applied to three phases of PMSM with Inverse Park Transform. Utilizing the current values measured from the three phases of the PMSM, the currents in the dq-axis are calculated with Park Transform (Figure 5).
Figure 5.
Block diagram of PID controller structure.
The D coefficient of the d- and q-axis current controllers in the sequential PID controller structure has been determined as zero. This is because current measurements are made analog and the derivative expression of current noise degrades the controller performance. Eq. (11) is used while determining the PI controller coefficients of these two current controllers. Eq. (11) is simplified version of Eqs. (1) and (2) and has a siso structure. Since the electrical characteristic of PMSM is much faster than the mechanical characteristic, there is no velocity dependent expression in Eq. (11).
ixvx=Gcur_pid=1Lxs+RsE11
In the velocity controller, as in the current controllers, the D coefficient is set to zero. The reason for this is that the velocity is not measured directly in the system and is obtained by taking the derivative of the position data. The second derivative of the position data degrades the controller performance. Eq. (12) is used while determining the PI controller coefficients of the speed controller. In addition, the velocity controller bandwidth is determined to be 1/10 of the current controller bandwidth. Since the current controller is 10 times more than the speed controller, changes in the current dynamics according to the Nyquist Criteria will not affect the dynamics of the speed controller.
ωmiq=Gvel_pid=3p/2λpmJs+BE12
In the position controller, the P controller is selected. In addition, the position controller bandwidth is determined to be 1/10 of the velocity controller bandwidth. Thus, the velocity of the PMSM will be 10 times faster than the dynamics of the position controller, and only the integral expression will remain between the speed and the position. Eq. (13) is used to determine the position controller P coefficient. The I term of PID is used to prevent steady state error in current and speed controllers. In addition, there is no steady state error inherent in the position controller designed equation. Therefore, choosing the position controller as P instead of PID will provide ease of operation.
θmωm=Gpos_pid=1sE13
2.4 Model predictive control
The controlled autoregressive and integrated moving average (CARIMA) model is determined as t MPC algorithm [21]. The reason for choosing the CARIMA model as the MPC method is not only the optimization process can be made offline but also, in this method, the processing load on the microcontroller is relatively low. Generic CARIMA equation is given in Eq. (14).
azyk=bzuk+dkE14
az and bz in Eq. (14) represent the transfer function of the system, and dk represents disturbance and measurement noise effects simultaneously.
Unlike the generic CARIMA model, noise and disturbances are removed and the simplest transfer function model is obtained as in Eq. (15).
azyk=bzukE15
Eq. (16) is obtained if both sides of the Eq. (15) are multiplied by the expression ∆.
Azyk=bz∆ukE16
az∆=AzE17
If the Eq. (16) is written in expanded and matrix form for n steps, Eq. (18) is obtained.
Eq. (23) is obtained if Eq. (18) is arranged to give the estimation of the output value. The expression y→k+1 in Eq. (23) is the estimation of the output value in the next step. u→k value is the input signal to be applied to the system in current step. u→k−1 is the input signal applied to the system in the previous step and y→k is the output value in the current step.
The transfer function to be used for MPC is obtained in Eq. (23). In the next step, the cost function of the system should be determined. The cost function used in this study is given in Eq. (27).
If the matrices in Eqs. (28) and (29) are updated to calculate the next step of the prediction, instead of n step long vector, the calculations are simplified as follows.
S=H1xnTWyH1xn+WuE30
X=H1xnTWyPH1xnTWyQ−H1xnTWyE31
According to the cost function, the solution is given in Eq. (32).
∆u→k=Pry→k+1−Dk∆u→k−1−Nky→kE32
Pr=S−1HTWyE33
Dk=S−1H1xnTWyPE34
Nk=S−1H1xnTWyQE35
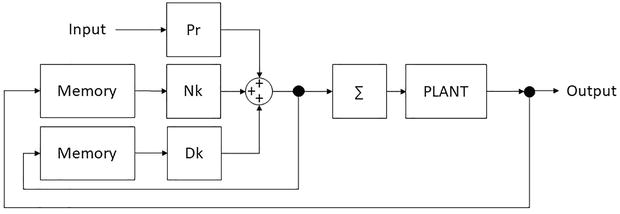
The block diagram of MPC is as in Figure 4. To obtain the control signal, the reference input value is multiplied by the Pr matrix. In next step, the output measurement of the system and the measurement matrix obtained from the previous output values are multiplied by the Dk matrix. In final step, the delta of the reference signal applied to the system and the matrix obtained from the previous values of these deltas are multiplied by the Nk matrix. The result obtained is added together. This value is the delta reference value to be applied to the system. This delta reference value is added at each step (Figure 6).
Figure 6.
Block diagram of MPC.
In order to convert the PMSM transfer function in Eq. (7) to CARIMA form in Eq. (11), it is necessary to switch from the s transform of Eq. (36) to the z transform. Tustin method is selected for this process. According to the Tustin method, the following equation is used to obtain the z transform of an equation in the s transform. Ts is the sampling time of the z transform.
s←2Tsz−1z+1E36
The CARIMA form of the PMSM transfer function is as in Eqs. (38) and (39).
s←2Tsz−1z+1E37
az=a3z3+a2z2+a1z+a0E38
bz=32pλpmTs3z3+3z2+3z+1E39
a3=4TSRsJ+Lqb+8LqJ+2Ts232pλpm2+RsbE40
a2=−4TSRsJ+Lqb−24LqJ+2Ts232pλpm2+RsbE41
a1=−4TSRsJ+Lqb+24LqJ−2Ts232pλpm2+RsbE42
a0=4TSRsJ+Lqb−8LqJ−2Ts232pλpm2+RsbE43
After obtaining the CARIMA form, the other matrices required for MPC are calculated in MATLAB because their sizes are very large.
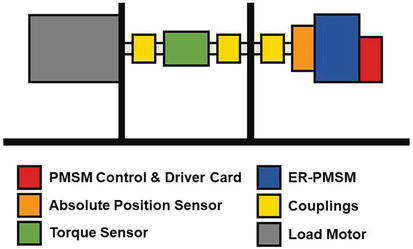
The test system is given in Figure 7. In the test system, there is an absolute encoder connected to the output shaft of the ER-PMSM for measuring the position of the ER-PMSM. The resolution of this encoder is 21 bits. This value is sufficient for us to observe the movement precisely. There is a driver card that controls and drives the ER-PMSM. FPGA is used as a smart unit in this card. These three components are used in all of the no-load tests of the ER-PMSM described below.
Figure 7.
Test system block diagram.
Experimental studies are carried out with a driver card that is controlled by FPGA. Since the calculations can be made in parallel and quickly, control performance can be evaluated without being affected by the computation load and time.
The load motor in the test system has its own controller. This controller uses the data from the torque sensor in the test setup as a feedback signal and controls the load motor to apply the desired load.
The test system uses one interface, which is not included in Figure 7. This interface sends commands to the ER-PMSM controller and the load motor controller simultaneously. In this way, two controllers work simultaneously.
Finally, the tests are carried out without the transmission mechanism. The ER-PMSM output shaft is directly connected to the load motor output shaft with the couplings shown in Figure 7. There are only couplings and torque sensor between load motor and ER-PMSM.
The parameters of the ER-PMSM are used in the experimental setup are given in Table 1. MPC parameters are selected as in Table 2. PID parameters are given in Table 3.
Parameter
Value
Rd, and Rq
91mΩ
Ld
57μH
Lq
78μH
λpm
2.9mWb
p
21
J
1.33·10−4kg·m2
Table 1.
ER-PMSM parameters.
ny
nu
Wy
Wu
Ts
21
1
1
1
1ms
Table 2.
MPC parameters.
Position Controller
Velocity Controller
Current Controller
Kp
Ki
Kd
Kp
Ki
Kd
Kp
Ki
Kd
73
0
0
0.375
39
0
0.5
1250
0
Table 3.
PID parameters.
D-axis and q-axis current controllers are selected the same. The sampling time of the current controllers is determined as 50μs. The position and speed control sampling times are set to 1 ms.
Experimental study is carried out in four different test condition. In these tests, both the sensitivity of position control is observed and the two controllers are compared with each other.
In the first test, position control sensitivity of ER-PMSMs under cogging torque is investigated. In the second and third tests, the performances of both controllers are compared. The performance comparison is made for the condition where there is no external disturbance factor. In the last test, the disturbance caused by external factors such load torque is examined.
3.1 Low speed position control test
In this test, the position reference profile is shown in Figure 8, which changes at a speed of 0.5 rad/s, is applied as the position reference. The purpose of the test is to examine the effect of cogging torque on position control as the rotor position changes at a slow rate. In addition, there is no external load in this test.
Figure 8.
Low speed position control test experimental results.
In Figure 8, there are position control outputs for both controllers. It can be observed from Figure 8 that, there are small ripples in position tracking in both controllers. These ripples are at 4mrad in PID controller, as they are 10mrad in MPC.
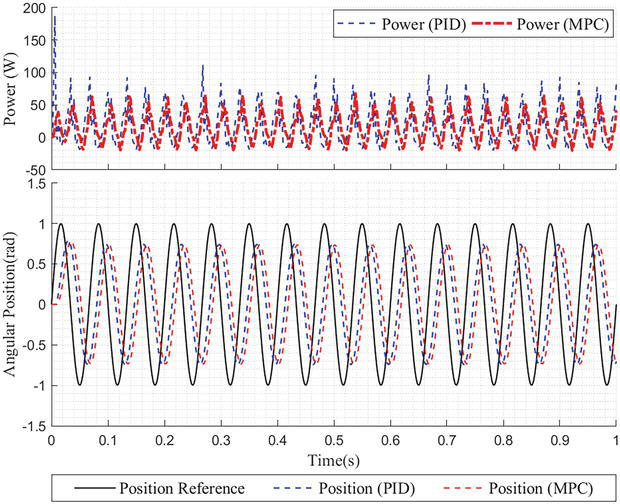
3.2 Sinusoidal reference position control test
In this test, a sinusoidal signal with an amplitude of 1 rad and a frequency of 15 Hz is set as the position reference. The purpose of this test is to examine the bandwidths of the controllers. In addition, there is no external load in this test.
In Figure 9, there are position control outputs for both controllers. As can be observed from Figure 9, the amplitude bandwidth of both controllers is same. However, phase shift in position control with MPC is higher than with PID.
Figure 9.
Sinusoidal reference position control test experiment results.
Moreover, Figure 9 shows the power consumption of both controllers during the sinusoidal motion. As can be seen from the power graph, control with MPC consumes less power than PID.
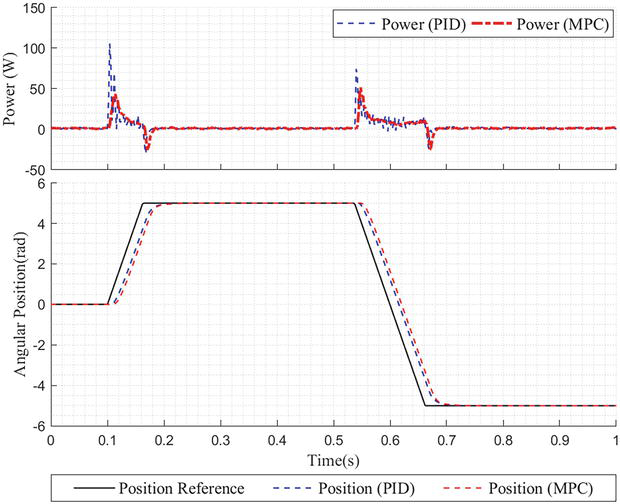
3.3 Step reference position control test
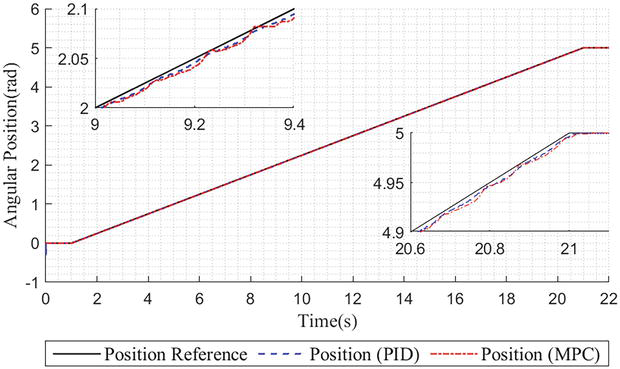
In this test, a step signal with an amplitude of 5rad and a rate of 80rad/s is set as the position reference. The purpose of this test is to observe the step response of both controllers. There is also no external load in this test.
In Figure 10, there are position control outputs of the both controllers are given. It can be observed from Figure 10 that, rise time and settling time values are the same for both controllers. In MPC, the acceleration at the beginning of the motion is lower than in PID. However, the MPC slackened faster in the last part of the movement, both controllers completed the movement in the same time.
Figure 10.
Step reference position control test experiment results.
Also, Figure 10 shows the power consumption of both controllers while making step motion. As can be seen from the power graph, control with MPC consumes less power than PID.
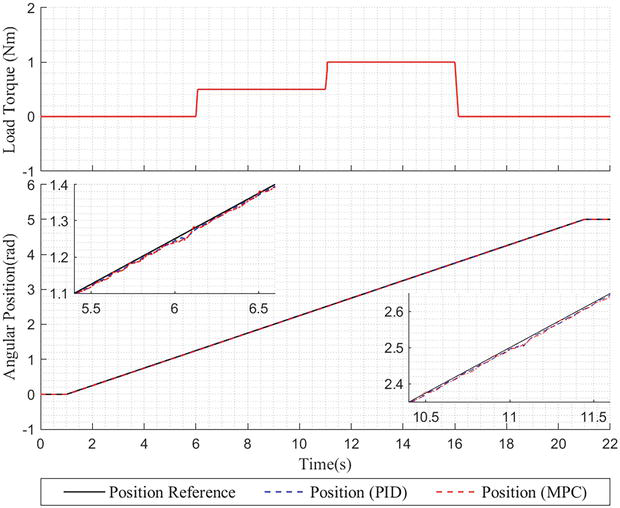
3.4 Low speed position control test with external load
In this test, the command in “Low-Speed Position Control Test” is used as the position reference. However, unlike the “Low-Speed Position Control Test”, the external load in Figure 11 is applied to the PMSM rotor shaft. This test investigates the effects of an external load, a.k.a. disturbance rejection performance.
Figure 11.
Low speed position control test with external load experiment result.
As can be observed in Figure 11, position tracking where the load is constant is the same as in the “Low-Speed Position Control Test”. When the load changes suddenly, the position control error increases up to 20mrad for both controllers. MPC compensates for this error within 30ms, while PID controller compensates for this error within approximately 90ms.
Four different tests are carried out both not only to observe the control performance of the ER-PMSM but also to compare the two designed controllers with each other.
As a result of “Low-Speed Position Control Tests” for both externally loaded and unloaded conditions, it has been observed that ER-PMSMs can be used in high-precision motion control applications. Cogging torque of ER-PMSMs causes ripples during movement. However, the level of these ripples is small and can be ignored in many applications. In addition, external loads on the rotor shaft do not have a negative effect on the position control of ER-PMSMs. Controllers can compensate these external loads rapidly.
After observing that the position control of ER-PMSMs can be done precisely with two different controllers, the advantages and disadvantages of these two controllers are investigated. First of all, the parameters of these two controllers are set to give similar performance. When the position outputs in the test results are examined, it is observed that the two controllers perform similarly.
It has been observed that the peak power consumption is lower in the control with MPC. The main reason for this behavior is that the acceleration characteristics of the two controllers are different. Although acceleration takes longer in MPC then PID, so the maximum acceleration level in MPC is lower then PID. In PID, on the other hand, the initial value of the acceleration is high, the acceleration time is shorter. Therefore, both controllers have similar performance in both sinusoidal reference and step signal reference, there are differences in power consumption.
Another difference between the two controllers is the processing loads. In the control with PID, it is necessary to control both at higher sampling frequencies and the much more operations. In MPC, on the other hand, fewer operations are performed with a low sampling frequency. Moreover, position measurement is sufficient for MPC, while current measurement is necessary for sequential PID control.
In this chapter, the use of ER-PMSMs in applications that require precise position control is investigated. Additionally, MPC is determined as the control method. PMSM position control structure is established using the CARIMA model. To compare the MPC performance, the sequential PID controller structure is established. These control methods are tested under four different test scenarios.
When the test results are examined, it is observed that the effect of cogging on control performance is relatively low even in a system without transmission elements (such as gearbox etc.) at the output shaft. Together with the transmission mechanism, the fluctuations caused by the cogging will be negligible. According to these results, it is shown that actuators with low transmission rates can be designed with ER-PMSMs.
In addition, when the test results of the two different control structures are examined, it is observed that the MPC is more suitable than PID controller in terms of energy consumption. It is also observed that the processing load of the MPC is less than PID controller and it can operate at a lower sampling time compared to the PID controller. As a result of this evaluation, for energy limited applications, it should be considered that would be more appropriate to use MPC in the control of ER-PMSMs.
Authors gratefully acknowledge reviewers’ comments and the financial support of Roketsan Inc.
References
1.Mohanraj D, Gopalakrishnan J, Chokkalingam B, Mihet-Popa L. Critical aspects of electric motor drive controllers and mitigation of torque ripple—Review. IEEE Access. 2022;10:73635-73674. DOI: 10.1109/ACCESS.2022.3187515
2.Wang G, Valla M, Solsona J. Position Sensorless permanent magnet synchronous machine drives—A review. IEEE Transactions on Industrial Electronics. 2020;67(7):5830-5842. DOI: 10.1109/TIE.2019.2955409
3.Xu D, Wang B, Zhang G, Wang G, Yu Y. A review of sensorless control methods for AC motor drives. CES Transactions on Electrical Machines and Systems. 2018;2(1):104-115. DOI: 10.23919/TEMS.2018.8326456
4.Sayed E, Yang Y, Bilgin B, Bakr MH, Emadi A. A comprehensive review of flux barriers in interior permanent magnet synchronous machines. IEEE Access. 2019;7:149168-149181. DOI: 10.1109/ACCESS.2019.2947047
5.De Klerk ML, Saha AK. A comprehensive review of advanced traction motor control techniques suitable for electric vehicle applications. IEEE Access. 2021;9:125080-125108. DOI: 10.1109/ACCESS.2021.3110736
6.Zhu W, Chen D, Du H, Wang X. Position control for permanent magnet synchronous motor based on neural network and terminal sliding mode control. Transactions of the Institute of Measurement and Control. 2020;42(9):1632-1640. DOI: 10.1177/0142331219893799
7.Chen DB, Du HB, Jin XZ. Position tracking control for permanent magnet synchronous motor based on integral high-order terminal sliding mode control. In: Proceedings of 32nd Youth Academic Annual Conference of Chinese Association of Automation, 19–21 May 2017. Hefei, China: IEEE; 2017. pp. 234-239
8.Cheng Y, Zhang J, Du H, Wen G, Lin X. Global event-triggered output feedback stabilization of a class of nonlinear systems. IEEE Transactions on Systems, Man, and Cybernetics. 2021;51(7):4040-4047. DOI: 10.1109/TSMC.2019.2931497
9.Sahin M, Kizir G. Designing of Cascade controller by using the bees algorithm. International Journal of Control Systems and Robotics. 2022;7:36-46
10.Kiselev A, Kuznietsov A, Leidhold R. Position control of a permanent magnet synchronous motor using generalized predictive control algorithm. In: 2016 International Symposium on Power Electronics, Electrical Drives, Automation and Motion (SPEEDAM); 22–24 June 2016. Italy: IEEE; 2016. pp. 110-115
11.Sahin M. Optimization of model predictive control weights for control of permanent magnet synchronous motor by using the multi objective bees algorithm. In: Hamid UZA, Faudzi AM, editors. Model-Based Control Engineering - Recent Design and Implementations for Varied Applications [Internet]. London: IntechOpen; 2021. DOI: 10.5772/intechopen.98810
12.Zhao J, Ma T, Liu X, Zhao G, Dong N. Performance analysis of a coreless axial-flux PMSM by an improved magnetic equivalent circuit model. IEEE Transactions on Energy Conversion. 2021;36(3):2120-2130. DOI: 10.1109/TEC.2020.3040009
13.Miguel Guedes Rebelo J, Ângelo Rodrigues Silvestre M. Development of a modular controller to minimize current ripple in low inductance coreless permanent magnet motor. KEG [Internet]. 2020;5(6):757-768. Available from: https://knepublishing.com/index.php/KnE-Engineering/article/view/7095
14.Habib A. A systematic review on current research and developments on coreless axial-flux permanent-magnet machines. IET Electric Power Applications. 2022;16(10):1095-1116. DOI: 10.1049/elp2.12218
15.Tong W, Li S, Pan X, Wu S, Tang R. Analytical model for cogging torque calculation in surface-mounted permanent magnet motors with rotor eccentricity and magnet defects. IEEE Transactions on Energy Conversion. 2020;35(4):2191-2200. DOI: 10.1109/TEC.2020.2995902
16.Wang K, Liang Y, Wang D, Wang C. Cogging torque reduction by eccentric structure of teeth in external rotor permanent magnet synchronous motors. IET Electric Power Applications. 2018;13(1):57-63. DOI: 10.1049/iet-epa.2018.5048
17.Ahn JM, Son JC, Lim DK. Optimal Design of Outer-Rotor Surface Mounted Permanent Magnet Synchronous Motor for cogging torque reduction using territory particle swarm optimization. Journal of Electrical Engineering & Technology. 2021;16:429-443. DOI: 10.1007/s42835-020-00599-z
18.Deng W, Zuo S, Chen W, Qian Z, Qian C, Cao W. Comparison of eccentricity impact on electromagnetic forces in internal- and external-rotor permanent magnet synchronous motors. IEEE Transactions on Transportation Electrification. 2022;8(1):1242-1254. DOI: 10.1109/TTE.2021.3112521
19.Balashanmugham A, Maheswaran M. Permanent-magnet synchronous machine drives. In: El-Shahat A, Ruba M, editors. Applied Electromechanical Devices and Machines for Electric Mobility Solutions [Internet]. London: IntechOpen; 2019. Available from: https://www.intechopen.com/chapters/68961. DOI: 10.5772/intechopen.88597
20.Secer G, Kizir G, Sahin M. Parameter estimation of permanent magnet synchronous machines based on a new model considering discretization effects of digital controllers. In: 2019 IEEE Applied Power Electronics Conference and Exposition (APEC);17–21 March 2019. USA: IEEE; 2019. pp. 1046-1051
21.Rossiter JA. Model-Based Predictive Control a Practical Approach. 1st ed. Florida: CRC Press; 2004. p. 344. DOI: 10.1201/9781315272610
Written By
Goksel Kizir and Abdul Furkan Kanburoglu
Submitted: 12 December 2022Reviewed: 18 December 2022Published: 01 March 2023
 Open access peer-reviewed chapter