 Open access peer-reviewed chapter
Abstract
Cities with many parks and other green areas are better places to live because they attract more people, improve health and well-being, foster community, and attract tourists and investors. This paper details the detailed process of designing a drip and sprinkler irrigation network to irrigate a 300 m2 garden in a semiarid region of Algeria. Sprinkler irrigation was then performed using two models of sprinklers: the IPN-5-F, with a radius of 1.5 m, flow of 0.09 m3/h, and arc of 360°, and the IPN-12H, with a radius of 3 m. The first phase involved hydraulic sizing of the drip irrigation system for varying dripper flows, while the second addressed the use of a drip irrigation system. Drip and sprinkler irrigation have somewhat comparable watering schedules (from one for drip to 2 days for sprinkler), but drip’s flow rate is woefully inadequate when compared to sprinklers. Because of the pressure reduction provided by the manifold pipes in a drip irrigation system, it is efficient to install a single pump with a sufficient debt to service both systems.
Keywords
- irrigation systems
- water requirement
- hydraulic sizing
- arid region
- green spaces
1. Introduction
The presence of green areas in public places helps to improve the quality of air, water, and land by absorbing pollutants, while also working to keep air temperatures within safe ranges, giving shade, stabilizing soil, and reducing harmful carbon dioxide emissions [1]. The negative effects of the current rate of urbanization can be mitigated, in part, by green spaces. They divide up the money fairly between construction, transportation, and basic amenities. Solar energy is an essential alternative clean energy source that can help ensure the long-term viability of our civilization while reducing its environmental impact. With a solar thermal potential of 169,000 TWh/year and a solar photovoltaic potential of 13.9 TWh/year, Algeria is widely regarded as having the greatest solar potential in the entire Mediterranean basin. Whereas in the Algerian Sahara, the average annual sunshine hours are around 3500, which is always over 8 hours per day and can reach up to 12 hours per day in the summer [2, 3]. The focus of this section is on developing a robust solar-powered irrigation system for urban green areas in the semiarid southern region of Algeria (the Bechar region). In this investigation, we focused on two types of watering systems: drip and sprinkler. The following sections outline some of the overarching ideas involved in the development and operation of such systems. Figure 1 shows how the geometry of the garden was considered during the design of the smart irrigation system.
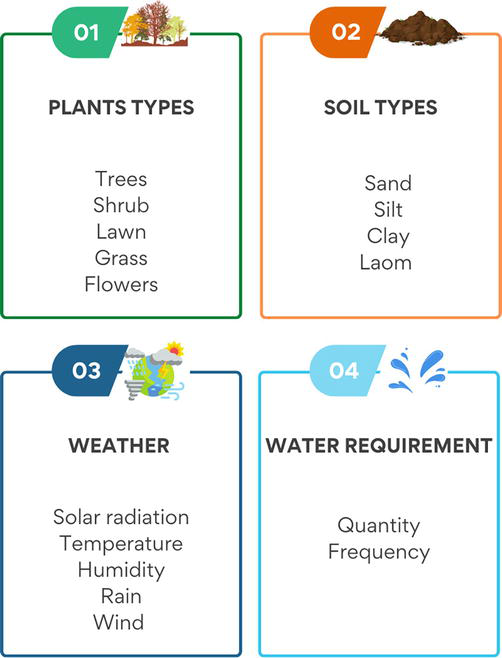
Figure 1.
Requirement parts of the irrigation system.
The following points are the most important criteria to be considered:
Excessive pressure allows the water to be dispersed into a fine mist, which facilitates the process of evaporation and imbalance in distribution. Weak pressure leads to water flow, poor distribution, and loss of large quantities of it.
Low pressure causes stagnant water to not only be poorly distributed but also to be wasted in significant quantities.
The evaporation and dispersal effects of weather and wind on sprinkler irrigation.
Use flat regions or have them releveled such that they slope only 2%.
It is crucial to confirm the availability of water and its quantity by collecting basic information, such as elevation differences, local climate data, soil type, and crop details (type, growth stage, and pacing).
Determine how much water will be needed at its highest point.
Decide between a drip and a sprinkler irrigation system.
Do the math on how often you should irrigate and how long it should run.
Figure out what pipe sizes you will need (supply, main, manifold, and laterals).
Find out how much energy was wasted because of friction.
Determine the sum dynamic head.
Finally, figure out how much energy will be needed for the pumps.
2. Study area
Collect data on elevation, climate, soil, and crops to determine water availability and amount. Determine how much water will be needed at its highest point.
Decide between a drip and a sprinkler irrigation system.
Do the math on how often you should irrigate and how long it should run.
Figure out what pipe sizes you will need (supply, main, manifold, and laterals).
Find out how much energy was wasted because of friction.
Determine the sum dynamic head.
Finally, figure out how much energy will be needed for the pumps.
There is a research area of palm trees and flowering shrubbery plants sharing a water demand (Figure 2). In the semiarid region of southern Algeria, this green space is part of the University of Bechar in the city of Bechar. It is roughly 300 m2 in size.
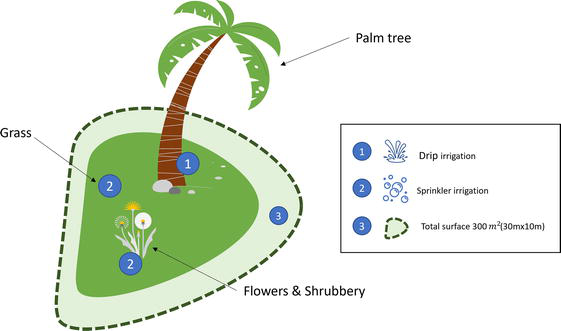
Figure 2.
Part of the study area and the different irrigation systems used.
There are 10 palms, evenly spaced at 3 m apart, in the middle section of this landscape, which is watered by a drip irrigation system and has sandy loam soil. Flowers and grass are sprinkle-irrigated in the two nonworking sections. Each palm in the drip irrigation network has two emitters spaced at 1.5 m apart, with each emitter watering an area of 4 m2 (representing 60 percent of the total wetted area). The following sections summarize the model used to estimate and calculate crop water needed to schedule daily and weekly irrigation and the hydraulic sizing for the two types of irrigation systems: drip and sprinkler systems, respectively presented in the Figure 2.
3. Hydraulic sizing model
3.1 Crop evapotranspiration
Source Plant Since evaporation and transpiration are both influenced by weather, they are climatic parameters. The FAO Penman-Monteith method is the only one suggested for calculating ETo. The technique was chosen because it is physically based, explicitly combines both physiological and aerodynamic characteristics [4] (see Figure 3), and provides a close approximation of grass ETo at the region studied.
Evaporation is the transfer of thermal energy that transforms water from a liquid or solid state into a gaseous state.Transpiration : The evaporation of water taken up by the crop and used immediately in the construction of plant tissue at a period. Soil evaporation is not a part of this.The term “evapotranspiration” (ET) refers to the total amount of water lost from the evaporation of soil and plants in the area occupied by the crop during its growth. The standard unit of ET is millimeters per day. Evapotranspiration, ET: It is the sum of the amount of water transpired by plants during the growth process and the amount that is evaporated from soil and vegetation in the domain occupied by the growing crop. ET is normally expressed in mm/day.
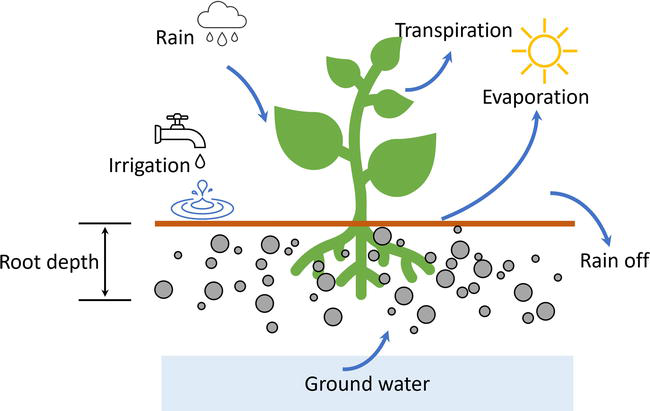
Figure 3.
Physiology and aerodynamic parameters process of a crop.
This refers to crop ET under standard conditions, that is,
where:
Crop evapotranspiration under nonstandard conditions, as mentioned above, is called ETc (adjusted). This refers to the growth of crops under no optimal conditions [4].
For more specification case of drip irrigation system, crop evapotranspiration stated in Eq. (1) can be given by [5]:
3.2 Water application net depth
Water should be delivered at a certain depth during irrigation to make up for what the crop loses
Moisture in the ground (Field capacity predicted wetness)
Permissible loss of soil moisture (P).
The RZD is the effective depth of the crop’s root zone.
It is important to survey and test the soil to learn its field capacity (FC) and permanent wilting point (PWP). When the soil texture is understood, it is possible to make estimations without the equipment and time by looking up numbers in the literature, ideally from the area. However, there is a discrepancy between the reported data on the moisture content of various soil types.
The maximum net depth to be applied per irrigation can be calculated using the following equation [6]:
where:
To express the depth of water in terms of the volume, the area proposed for irrigation must be multiplied by the depth |6]:
where:
A: Proposed area for irrigation (ha).
dnet: Depth of water application (mm).
3.3 Irrigation efficiency
How these functions (I
There are some factors that affect irrigation efficiency which are as follows:
System design : Along with maintenance requirements and site conditions, these are fundamental factors that influence the overall efficiency of irrigation systems.Soils : High irrigation efficiencies are easier to achieve on heavier and deeper soils, while low efficiencies are more common for sites on shallow and free-draining soils.Sprinkler packages : The right sprinkler package that is well maintained can reduce losses to evaporation and improve the distribution uniformity and application efficiency.Pump flow rate : High flow rates for flood irrigation systems can reduce the time required to water each bay and hence use less water per irrigation event.Irrigation scheduling : Applying the right amount at the right time to match crop water requirements and soil moisture holding capacity can cause less deep drainage and improved efficiency.Application depth : If the average application depth is greater than the soil moisture holding capacity, it will cause excessive deep drainage per irrigation event and, therefore, contribute to low overall system efficiency [8].
Water losses can be decreased to increase irrigation effectiveness. The following three key areas could use improvement.
Transmission system: Alternatives for channel lining or treatment can lower channel system losses. To prevent excessive losses, piped systems need to be properly maintained.
Application system: Achieving high irrigation efficiency requires effective irrigation system design and maintenance.
In managing irrigation systems, deep drainage losses are reduced when the amount of water is applied at the time [8].
3.4 Irrigation requirement
FAO 1984 defines the net irrigation requirements (
Gross irrigation need is the term used to describe the total amount of water applied through irrigation. The net irrigation requirement plus water application losses and other losses make up this amount. Depending on the requirements, the gross irrigation need can be calculated for a field, a farm, an outlet command area, or an irrigation project by considering crop losses at different phases of growth [10].
where:
According to Rain Bird International (1980), the following efficiencies should be used when the surface area wetted by one emitter does not exceed 60 cm in diameter [9]: Hot dry climate: 0.85, Moderate climate: 0.90, Humid climate: 0.95.
3.5 Emitter sizing
The number of emitters per plant is established as follows [9]:
The diameter of the wetted area can be calculated using this equation:
The percentage of wetted area
where:
The relation between
The duration of irrigation or length of operation time (Ta) at peak demand can be established by the equation below [9]:
3.6 Sprinkler sizing
3.6.1 Set time
Set time is the time each set of sprinklers should operate at the same position to deliver the gross irrigation depth, which can be calculated by [11]:
where:
The net depth of irrigation, divided by the agricultural irrigation efficiency, yields the gross depth of water application (E). It should be emphasized that possible water losses from pipe leaks are factored into the effectiveness of farm irrigation. The gross depth of water can be calculated using the equation shown below [11]:
3.6.2 Sprinkler system capacity
Sprinkler system capacity is one of the predetermining parameters in the evaluation of a sprinkler irrigation system. It depends on the system application rate. The sprinkler discharge test is carried out and compared with the calculated value using equation [11]:
The actual selection of the sprinkler is based on design information furnished by the manufacturers of the equipment. The choice depends mainly on the diameter of coverage required, pressure available, and sprinkler discharge. The sprinkler discharge may be determined by the following formula [11]:
The number of sprinklers calculated by [12]:
The goal of irrigation is to supply enough water to keep the crop’s root zone at the optimal level of soil moisture. Irrigation work must be completed at a fair labor, power, and material cost.
Below, I summarize the benefits of sprinkler irrigation over surface irrigation:
Most soils with an infiltration rate under 4 cm/h can use it.
Appropriate for practically all crops.
It is appropriate to use uneven ground.
Irrigation water is a cost-effective way to apply fertilizer, herbicides, and fungicides.
Can be used to cool crops in the summer and protect against winter frost.
Bunds and supply channels are not necessary.
Saving money on labor and water.
Enables the transportation of farm equipment.
Increased crop yields and healthy growth.
Less disease and pest infestation.
Sprinkler irrigation restrictions.
Sprinkler patterns become distorted by wind, leading to uneven distribution.
Soft fruit that is ripening has to be shielded from spray damage.
Higher upfront costs.
High power needs because it operates at 5 to 100 m of water head.
Not appropriate for fine-textured, slow-infiltrating soil.
After irrigation, the movement of portable pipes in some soils could be problematic.
3.7 Pipes sizing
After computing the friction losses in the supply line, mainline, manifold, and laterals for a more in-depth check reference [13, 14], it is important to first calculate the permissible pressure fluctuation that will offer emission uniformity close to the required value.
3.8 Total dynamic head
The total dynamic head (TDH) of a pump is the sum of the total static head, pressure head, friction head, and velocity head. An explanation of these terms follows and is shown graphically in Figure 4 [15].
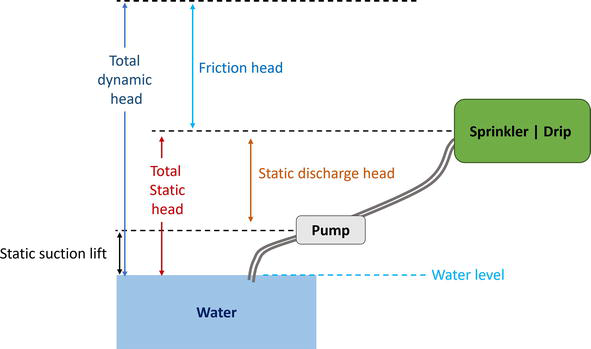
Figure 4.
Total dynamic head [
3.8.1 Total static head
The vertical distance that the pump must raise the water is known as the total static head. When pumping from a well, the vertical lift of the water from the ground surface to the discharge point is added to the distance from the well’s pumping water level to the ground surface. It would be the total vertical distance from the water surface to the discharge point when pumping from an open water surface [15].
3.8.2 Pressure head
Pressure is necessary for sprinkler and drip irrigation systems to function. To distribute the water effectively, center pivot systems require a specific pressure at the pivot point. By multiplying by 2.31, the pressure head at every location, where a pressure gauge is installed, can be translated from PSI to feet of head.
3.8.3 Friction head
The energy or pressure reduction brought on by friction when water moves through pipe networks is known as the friction head. The amount of friction loss is significantly influenced by the water’s velocity. When water flows through straight pipe sections, fittings, or valves, around corners, or where pipes expand or contract in size, frictional head loss occurs. These losses’ values can be computed or got from tables of friction loss. The total of all friction losses determines the friction head of a piping system [15].
3.8.4 Velocity head
The energy of the water is known as velocity head because of its velocity. When calculating irrigation system losses, this smaller amount of energy is typically negligible [15].
3.9 Pumping power requirement
The choice of the pump and power plant is the next matter to be addressed in a design. A pump that should deliver the head and flow at the best efficiency, as well as an electric motor to drive the pump, should be chosen from the manufacturer’s charts. The criterion for choosing a pump is whether its Net Positive Suction Head Required (NPSHR) is greater than it’s Net Positive Suction Head Available (NPSHA). The basic formula for calculating power requirements is given below [6]:
where:
KW or BHP: Energy transferred from the pump to the water
Q: Discharge
TDH: Total dynamic head
It should be noted that this formula expresses the actual power required at the pump
4. Results and discussion
First, the climatic data collection for Bechar-Algeria semiarid region during the corn period, which takes place in the middle of July as; the minimum and maximum temperature (
| Crop | RDZ (mm) | ETP (mm/day) | Efficiency (%) | FC-PWP (mm/m) |
|---|---|---|---|---|
| Palm tree | 0.7 | 7.4 | 55 | 90 |
| Grass | 0.5 | 8 | 55 | 90 |
Table 1.
The characteristics of the irrigation system can be simply determined if adequate parameter values have been estimated for each type of crop and area. Each palm will have two emitters in the drip irrigation network, spaced 1.5 m apart. About 4 m2 is wetted by one emitter, with 60% of that area being wet. It is crucial to compare several dripper laws in order to select the best dripper flow. The results of sizing for variations in dripper flow from 4 to 23 l/h are shown in Table 2.
| Dripper flow (l/h) | 4 | 8 | 15 | 23 |
|---|---|---|---|---|
| Irrigation frequency (day) | 1 | 1 | 1 | 1 |
| Irrigation hours (h) | 8 | 4 | 2 | 1.44 |
| Total lost friction in pipes (m) | 0.35 | 0.5 | 0.9 | 2.03 |
| Pump flow (m3/h) | 0.16 | 0.32 | 0.60 | 0.92 |
| Total dynamic head (m) | 12.50 | 17.50 | 18.93 | 19.02 |
| Power requirement (w) | 15 | 30 | 57 | 88 |
Table 2.
Results of sizing drip irrigation network with different dripper flow.
Table 2 shows that when pipe flow and diameters increase, irrigation hours drop and pipe friction loss (at laterals and manifolds) increases. The total dynamic head rises because of friction loss. As a result, the energy needed to run the solar pump increased from 15 to 88 W. Because irrigation frequency depends on how much water the crop needs, it was constant across many drippers. The dripper of 15 l/h for pump debit is approximately 0.6 m−3./h is the best option in terms of operation times and power requirements.
Two sprinkler types have been employed in the sprinkler irrigation system: the IPN-5-F, which has a radius of 1.5 m, a flow of 0.09 m3/h, and an arc of 360°, and the IPN-12H, which has a radius of 3 m, a flow of 0.1 m3/h, and an arc of 180°. Table 3 compiles the findings from sizing.
| Sprinkler code | IPN-5-F | IPN-12H |
|---|---|---|
| Precipitation (mm/h) | 33.5 | 22 |
| Number of sprinklers | 17 | 7 |
| Pump flow (m3/h) | 3 | 1.5 |
| Power requirement (w) | 263 | 124 |
| Irrigation hours | 1 | 1.5 |
| Irrigation frequency (day) | 2 | 2 |
Table 3.
Results of sizing irrigation network with two models of sprinkler.
In terms of the number of sprinklers, pump flow, and power needed, the sprinkler IPN-12H is a better option than the sprinkler IPN-5F. For the best design, we installed sprinklers IPN-12Q with a 90° arc in the corners. For additional information on these sprinkler types, check the reference [9]. The sprinkler spacing is around 4.2 m because of the sprinkler head spacing percentage, which is approximately 60% (for the desert region) [17, 18].
For the two types of irrigation systems—drippers and sprinklers—the irrigation frequency values range from 1 to 2 days, respectively. The pump debit in the drip irrigation system (0.6 m3/h) is minimal compared to the pump debit in the sprinkler irrigation system (1.5 m3/h). In addition, the irrigation hours in the two networks are different: the drip irrigation network is closed for two hours, while the sprinkler irrigation network is closed for 1.5 hours. These factors make it appropriate to install only one pump, which has the greater debit for the two networks and the drip irrigation system; manifold pipes must use decreased pressure.
There are some situations that could influence and interpret how much power is needed to run the pump and the entire dynamic head. Three situations are examined here, and Figure 5 shows the outcomes:
Case 1 : Variation of distance between the water source and the green space from 10 to 100 m, see Figure 5(a).Case 2 : Variation of difference in elevation between the water level and the highest point on the land from 1 to 10 m, see Figure 5(b).Case 3 : Variation of suction lift from 1 to 5 m, see Figure 5(c).
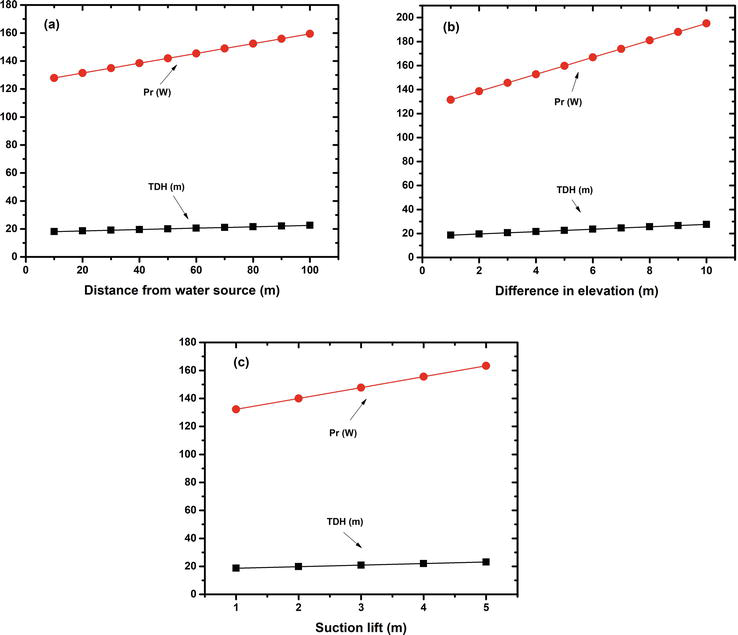
Figure 5.
Different variations of (a) distance between the water source and the green space, (b) difference in elevation between the water level and the highest point on the land, and (c) suction lift.
In Figure 5(a)–(c), the power requirement
The third scenario (Figure 5(c)) shows a slight increase in TDH and Pr that only slightly affects the suction lift, which for a surface pump does not exceed 5 m.
The performance of seasonal crop water needs, ETc, I-f, and T at peak demand for the two types of irrigation networks should be studied, it is concluded. Table 4 presents the outcomes.
| Month | |||||
|---|---|---|---|---|---|
| Drip ( | Sprinkler ( | Drip ( | Sprinkler ( | ||
| Winter | 4 | 3 | 5 | 1 | 0.5 h |
| Spring | 6 | 2 | 4 | 2 | 0.7 h |
| Summer | 8 | 1 | 2 | 3 | 01 h |
| Fall | 5 | 2 | 4 | 2 | 0.7 h |
Table 4.
Performance of seasonal crop water needs for irrigation system.
The findings are shown in Table 4, which includes the variation in irrigation time (T) and frequency (I-f) for the crop evapotranspiration (ET-C) values for the season. The minimum and maximum values were attained during the corn period (period of summer), and then in the fall, as shown in the graph below. The changing of seasons is caused by I-f. and T. Irrigation becomes rarer during winter, then rises again in summer. Longer irrigation times and fewer cycles are caused by increased crop water demand in summer because of higher temperature. Both drip and sprinkler irrigation networks are linked to the same irrigation system. It is suggested to adjust the irrigation value duration. This investigation will be released later.
5. Conclusion
The application, effectiveness, and financial return of irrigation in the industrial process can all be improved by improving the design of irrigation systems. Design requirements should be based on an understanding of irrigation, hydraulics, economics, energy, and environmental factors. The principal goal of this study is to arm the general people with the information and resources required to achieve the effective use of water for outdoor irrigation, as well as those who are to water public green spaces. A network of permanent pipes joined to emitters and sprinklers that are installed and planned to use the water from a particular natural area is an irrigation system. Tools installed on a tube and used under pressure to drain water as a drip or nozzle are emitters and sprinklers, respectively. A system that is established and intended to lower the capacity for producing water is an efficient irrigation system.
Acknowledgments
This work is supported by the General Direction of Scientific Research and Technology (DGRSDT) of the Algerian Ministry of Higher Education and Research (social-economical project 2021).
Nomenclature
Crop evapotranspiration (mm/day)
Reference evapotranspiration (mm/day)
Crop evapotranspiration for drip irrigation (mm/day)
Crop factor (0.9)
Ground cover reduction factor (0.8)
Net depth (m)
Moisture (90 mm/m)
0.5m | 0.7m
Allowable portion of moisture for drip | sprinkler (20% | 50%)
Irrigation area (ha)
Water application depth (mm)
Net irrigation requirement (mm)
Gross irrigation requirement (mm)
Water received by plants from sources other than irrigation (mm/day)
Amount of water required for leaching of salts (mm/day)
Field application efficiency of drip irrigation system (0.85)
Gross depth
Farm irrigation efficiency of sprinkler irrigation system (0.65)
Dripper discharge (l/h)
Number of drippers per plant (‐‐‐)
Percentage of wetted area (60%)
Area wetted by one emitter (m2)
Drippers’ spacing (m)
Plant spacing (m)
Emitter discharge (l/h)
Set time (h)
Sprinkler precipitation rate (mm/h)
Gross depth of water (mm)
Duration of irrigation per day (h)
Number of sprinklers (‐‐‐)
The system capacity (m3/h)
Number of laterals operating per shift while (‐‐‐)
Number of sprinklers per lateral (‐‐‐)
Sprinkler discharge (‐‐‐)
Spacing of sprinklers along the laterals (m)
Spacing of laterals along the main (m)
Optimum application rate (cm/h)
Pump efficiency performance chart (%)
Total dynamic head (m)
Energy transferred from the pump to the water (W)
Discharge (m3/h)
References
- 1.
World Health Organization. Urban Green Space Intervention and Health. European Environment and Health Process; 2017 - 2.
Chancelier L, Laurent E. l’électricité photovoltaïque. Cooperation Francaise, Ademe; 1995 - 3.
Available from: https://www.aps.dz/ar/regions/109002-2021-06-26-12-18-25 - 4.
Available from: https://www.dpgpolytechnic.com/downloads/files/n5acb055ce5b1c.pdf - 5.
Doorenbos J, Pritt WO. Crop water requirements crop water requirements, no. 24. 1977 - 6.
Sprinkler Irrigation System Planning, Design, Operation and Maintenance Volume III Module8. Harare: FAO, Sub-Regional Office for East and Southern Africa (SAFR); 2001 - 7.
United States Department of Agriculture. Chapter 2 irrigation water requirements (210-vi-NEH, September 1993) 2-1. In: Irrigation Water Use Bookmarks and Buttons to Navigate. Issued September 1993 - 8.
Harvey A, Palamountain R, Zerk M, Heffernan J, Newson D, Powell T, “Irrigation glove boxguide”. 2016 - 9.
D. Monitoring, I. Agriculture, F. Participation, and V.Iv. Irrigation Manual Module 9 Lpcalized Irrigation Systems Planning, Design, Operation and Maintenance. Vol. IV. 2022 - 10.
Available from: https://ebrary.net/121143/environment/gross_irrigation_requirement - 11.
Suray A. Rasheed, Aqeel Al-Adil, Sprinkler Irrigation Systems and Water Saving, a Case Study from South of Iraq, 2nd Conference on Environment and Sustainable Development 28–29-Oct-2015, Water Resource Ministary, Baghdad - 12.
Shiva Shankar M, Ramanjaneyulu AV, Neelima TL, Das A. In: Rajkhowa DJ, Das A, Ngachan SV, Sikka AK, Lyngdoh M, editors. Sprinkler Irrigation – An Asset in Water Scarce and Undulating Areas. Integrated Soil and Water Resource Management for Livelihood and Environmental Security. Meghalaya, India: ICAR Research Complex for NEH Region; 2015. pp. 259-283 - 13.
Proceedings of Drip and Sprinkler Workshop. Jalgaon (M.S.), India; 1994 - 14.
Jack K, Ron B. Sprinkler and Trickle Irrigation. Caldwell, New Jersey: The Blackburn Press; 2000. ISBN: 1-930665-19-9 - 15.
Scherer TF. Irrigation Water Pumps-Publication. Vol. 1057. NDSUF; August 2017. pp. 1-12 - 16.
Sudarshan S. Affordable Micro Irrigation Technology. Delhi, India: International Development Enterprises; 2000 - 17.
Mthieu C, Audoye P, Chossat J. Bases techniques de l’irrigation par aspersion. LAVOISIER; 2007 - 18.
Hadja Guedaouria et al. 2022 IOP Conf. Ser.: Earth Environ. Sci. 973 012013