Open Access is an initiative that aims to make scientific research freely available to all. To date our community has made over 100 million downloads. It’s based on principles of collaboration, unobstructed discovery, and, most importantly, scientific progression. As PhD students, we found it difficult to access the research we needed, so we decided to create a new Open Access publisher that levels the playing field for scientists across the world. How? By making research easy to access, and puts the academic needs of the researchers before the business interests of publishers.
We are a community of more than 103,000 authors and editors from 3,291 institutions spanning 160 countries, including Nobel Prize winners and some of the world’s most-cited researchers. Publishing on IntechOpen allows authors to earn citations and find new collaborators, meaning more people see your work not only from your own field of study, but from other related fields too.
To purchase hard copies of this book, please contact the representative in India:
CBS Publishers & Distributors Pvt. Ltd.
www.cbspd.com
|
customercare@cbspd.com
This study examined forecasting techniques and accuracy of sales performance of a grocery store. The survey and ex-post facto research designs were employed. The study employed Naive, exponential smoothing, least square, moving average, multiplicative decomposition and additive decomposition methods to forecast sales using sales data generated from January, 2017 to August, 2018 while the forecast accuracy was evaluated. The outputs of the methods were compared to determine the optimal forecasts and the demand for the next 14 months using the multiplicative and additive methods. The MAPE for Naïve, Exponential smoothing, Least square, Moving average, Multiplicative and Additive decomposition are 10.9, 10.2, 8.6, 11.9, 7.64, and 7.66%. By comparison, it was observed that multiplicative decomposition is the best technique because it generates the optimal forecast accuracy of 7.64%. Thus, the study recommends that the grocery outlet should maintain effective and reliable sales records for accurate forecasts.
Faculty of Management Sciences, Department of Business Administration, Lagos State University, Nigeria
Wasiu Oluwasegun Kehinde
Faculty of Management Sciences, Department of Business Administration, Lagos State University, Nigeria
Jonathan Ehimen Ekpudu
Department of Business Administration, Federal University of Agriculture Abeokuta, College of Management Sciences, Nigeria
Oluwasegun David
Department of Business Administration, Bowen University, College of Management Sciences, Nigeria
*Address all correspondence to: johnobamiro@gmail.com
1. Introduction
One of the major functions of management is to make decisions that will bring about a brighter future for the organization. The future can be predicted using past data or the formation of opinion [1]. Chao et al., [2] assert that an important role in the business planning process has led to extensive research as far as forecasting is concerned. Forecasting is defined as the art and science of predicting future events. It may involve the use of hard data (historical or past data) and/or soft data (experience, intuition, personal value, and judgment) in projecting into the future with some sort of mathematical model [3]. Ayers and Odegaard [4] posit forecasts play a crucial role in business management and strategic planning. The management decisions taken at every level of a business are either directly or indirectly related to the forecasts it has made. Without useful predictions, planning and control activities cannot be accomplished effectively. Forecasting is of great significance for organizations including grocery/retail companies because all firms will want to minimize the capital tied in their stocks [5], and meet customers’ demands, hence, profitability.
In the present turbulent market environment, forecasting the right volume of demand and the future development has an irreplaceable role in the management of every retail business [6]. The objective of groceries/retailers worldwide is to provide the right products at the right time and maintaining a healthy stock [7]. Retailers considering investing in advanced solutions should get acquainted with forecast accuracy [8]. Kumar and Dalgobind [9], viewed forecasting as an important part of retail decision-making. Forecasting helps to improve the customer experience through shorter delivery times, and it also allows the company to find better ways to use inventory-bound funds [10]. Paták et al. [11] posit that accurate demand forecasting is a prerequisite for efficient and effective customer satisfaction. It makes it possible to efficiently use resources and reduce costs associated with excess, or lack of goods within the supply chain. Accurate forecasting of future retail sales can contribute to gains in the efficiency and efficacy of operations carried out in retail businesses and supply chains [4].
Groceries have been confronting high customers’ demands, overstock, and stock out of inventory for years. This is getting worst with newer non-traditional channels like phoning and online purchase and delivery apps fueling the growth of grocery retailers, traditional stores must adapt or be left behind [12]. Due to the hyper-competitive industry of grocery, customer loyalty is dying, so experiencing stock-outs might lead to losing customers. Corsten and Gruen, [13] found that customers whom we once believed to either purchase substitutes or delay purchases when their preferred products are out of stock are more likely to switch stores and never come back. Stock-outs cause a direct loss of potential sales and lead to dissatisfied customers. The stock-out of individual items not only has a negative impact on its sales but also on the sales of the whole product category. In preventing stock-outs, retailers often have large safety stocks [14] which substantially increases costs and reduces profit. In some cases, despite the safety stocks, the chance of a stock-out is huge, with potentially a big impact on customer satisfaction and sales [15, 16]. The best preparation for the dilemma is to emphasize accurate demand forecast so they can carry the right supply for each product. Accurate forecast helps the Grocers to resolve the cost and service trade-off by balancing the loss due to stock-outs and the cost of safety stocks. Despite the importance of accurate demand forecasts compare to demand forecasts which are mostly wrong and misleading, forecast accuracy in the retail sector has not been adequately covered in the literature and by practitioners which is the basis behind this study. Also, the study used real and accurate sales data (sales history) against randomly generated demand data [17]. The more real and valid the data to be used for forecast, the more accurate is the outcome (demand forecast) [18].
Another issue confronting the practitioners or management is which forecasting techniques can generate reliable sale forecasts. Most grocery retailers in Nigeria hardly do forecast and the few ones use qualitative techniques; where experiences, opinions, and judgments of sales are largely used to determine a sales forecast. Even when quantitative forecasting was employed, the Naïve forecasting method is the most commonly used by grocery retailers. The reasons are that most managers are not conversant with quantitative forecasting techniques or do not want to put effort or do not see the benefits of quantitative techniques; using historical sales to determine sales forecasts. Moon et al. [19] cited by Orrebrant and Hill [20] mentions that it can be both costly and time-consuming to rely only on quantitative techniques when forecasting. He further advised that companies should therefore evaluate how to adopt different forecasting techniques to increase the sales forecast accuracy. Based on these premises and given the essential role of grocery retailing and the relevance of accurate demand forecast, this study adopted quantitative forecasting methods such as Naive, Exponential Smoothing, Least Square, Moving Average, Multiplicative, Decomposition, and Additive Decomposition Methods to determine demand forecast from actual sales history for a given period. Also, the demand forecast accuracy was determined using Mean Absolute Deviation (MAD), Mean Squared Error (MSE), and Mean Absolute Percentage Error (MAPE).
Forecasting is a tool that helps decision-makers to cope with the uncertainties of the future through prediction. Forecasting techniques can be divided into qualitative and quantitative. The qualitative forecasting technique uses soft information such as personal experience, value, intuition, and judgment to predict future sales. This technique is assumed to be subjective and biased owing to a lack of scientific proof. Some commonly used qualitative forecasting methods are; Delphi, jury of executives, consumers’ survey, and sales force opinions. Kumar and Dalgobind [9] gave the account of the circumstances where qualitative forecasting methods are preferable to quantitative ones as when data are not available or insufficient or are known to be unreliable, when it is not possible to construct a suitable numerical model and when the time is insufficient to initiate and operate a quantitative analysis.
The quantitative forecasting model uses hard data (historical data) to estimate future demands with some sort of mathematical model [21]. Quantitative forecasting method is appropriate when past data are available, sufficient, reliable and when it is possible to use mathematical models. This forecasting method involves trend projection using naïve method, sales trend analysis, causal, time series, moving average, exponential smoothing, and least square method. Generally, the forecast is usually classified by the time duration and uses. Short-term forecast which is the responsibility of first-level managers covers a period of up to one year involving daily operating activities. A medium-term forecast addresses cash budgeting, production and aggregate demand planning aggregate which is carried out by middle level manager for a period of one to three years. Long-run forecast involves taking strategic decisions that affect organizational strategic objectives, strategies, and policies. This is mostly the responsibility of top management.
2.2 Empirical studies
Some studies addressed the grocery retailing and maintaining healthy inventory through accurate demand forecasting involving different products in several countries [4, 10, 11, 12, 14, 20] using different simple and advanced forecasting methods (either qualitative, quantitative and hybrid) to model sales data in order to predict the future demand which is essential for the planning process. Aras et al. [22] used state space models, ARIMA and ARFIMA models, neural networks, and Adaptive Network-based Fuzzy Inference System (ANFIS) to determine sales forecasts for a global furniture retailer operating. The findings revealed that the single model in isolation did not outperform all the others across all the time series investigated. However, most of the combined forecasts examined could achieve statistically significant increases in forecasting accuracy compared with individual models and with the forecasts generated by the company’s current system. Chu and Peter [23] compared linear and nonlinear models for retail sales forecasting and established that nonlinear models are able to outperform their linear counterparts. Sapirstein [24] adopted Brown’s exponential smoothing method to improve the sale of pharmaceutical products, taking into account the fact that Romania is and will continue to be a market of high potential in selling pharmaceutical goods. The study advised that the managers of health care institutions should use the new information and communication technologies in order to plan the activities that will contribute to reaching their proposed objectives, based on accurate forecasting patterns. Lee et al., [17] concluded that the overall best model in their study was the neural network built on deseasonalized time series data. Sahu and Kumar [25] study on forecasting models and their applications for sales forecasting of sterilized flavored milk in Chhattisgarh. The study adopted naϊve model, moving average, double moving average, simple exponential smoothing; and semi average method to analyze weekly data spreading over October 2011 to October 2012, on the sales of sterilized milk, and the accuracy of the forecasting method was measured using mean Forecast Error (MFE), Mean Absolute Deviation (MAD), Mean Square Error (MSE), root mean square error (RMSE).
This study used a survey and ex-post facto research design. The Secondary data of sales history from the Grocery Bazaar Akesan branch for 20 months was used. Various quantitative forecasting techniques such as Naive, Exponential Smoothing, Least Square, Moving Average, Multiplicative Decomposition, and Additive Decomposition Method were employed to analyze twenty months of data (from January 2017 to August 2018) collected to predict the demand forecasts for 14 months from September 2018 to October 2019. The demand forecasts were subjected to accuracy tests to identify errors made. This study compares the Mean Absolute Deviation (MAD), the mean absolute percentage error (MAPE), and the mean square error (MSE) to evaluate the performance of the forecasting methods and identify the least error among the methods. The data generated were analyzed using operations research software (POM QM).
3.1 Data presentation
Data used in this study consist of actual sales and product details from the chosen company (Grocery, Bazaar). The company has more than 80 brands. Sales data for twenty months (20) from 1st January, 2017 to 31st August 2018 were collected. Raw sales data of different brands (such as bakery, baking supplies, beverages, cosmetics, cleaning supplies, dairy, frozen food, meat and fish, ready-made meals, sweets, snacks, and so on), were computed (see Table 1) and subjected to various forecasting techniques.
S/N
Year
Quarter
Months (x)
Actual Sales (y) (N)
1
2017
1st
January
90,513,640
2
February
85,809,019
3
March
91,651,973
4
2nd
April
104,616,584
5
May
92,348,534
6
June
89,874,755
7
3rd
July
86,988,783
8
August
82,364,715
9
September
82,067,415
10
4th
October
74,056,416
11
November
71,515,133
12
December
119,649,394
13
2018
1st
January
78,872,065
14
February
70,656,413
15
March
84,965,677
16
2nd
April
84,404,820
17
May
82,307,423
18
June
80,003,438
19
3rd
July
75,715,781
20
August
85,783,239
Table 1.
20 months sales’ figure for the retail outlet.
Source: Company’s sales, January 2017–August 2018.
The six (6) forecasting methods (Naive, exponential smoothing, least square, moving average, multiplicative decomposition, and additive decomposition method) were used to determine sales forecasts from September 2018 to October 2019. The performance of the forecasting methods was evaluated with forecast accuracy measures (MAD, MAPE, and MSE). This study dwelled more on forecasting using six techniques and 20 Months sales history. This research is an extension of studies conducted by Sahu and Kumar [25] and Obamiro [26]. Obamiro’s [26] study predicted and evaluated demand forecast accuracy for twelve months using three quantitative forecasting methods (see Table 2).
Naive Method
Exponential Smoothing
Least Square
Moving Average
Measure
Value
Error Measures
Bias (Mean Error)
−248968.4
−878145.3
−10.8
−412484.4
MAD (Mean Absolute Deviation)
9,861,447
9,042,428
7586159.0
10,519,060
MSE (Mean Squared Error)
255,953,800,000,000
173,845,100,000,000
120,610,000,000,000
227,368,300,000,000
Standard Error (denom = n−2 = 17)
16,913,490
13,939,060
11,576,320
15,993,410
MAPE (Mean Absolute Percent Error)
10.939%
10.17%
8.633%
11.914%
Forecast
next period
85,783,240
82,171,270
85,708,270
80,749,510
Table 2.
Result for naive method, exponential smoothing, Least Square, and moving average.
Source: Field work, 2018.
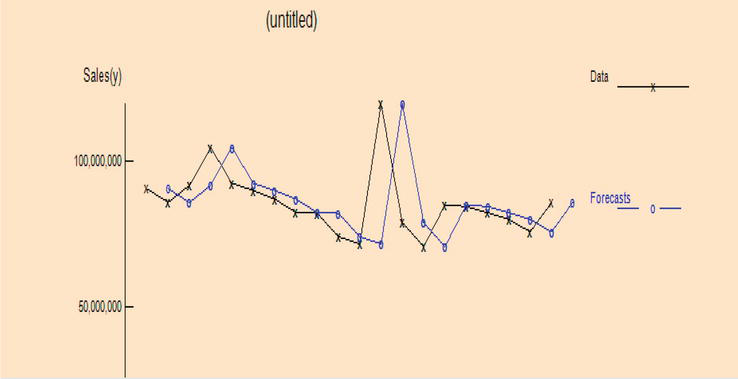
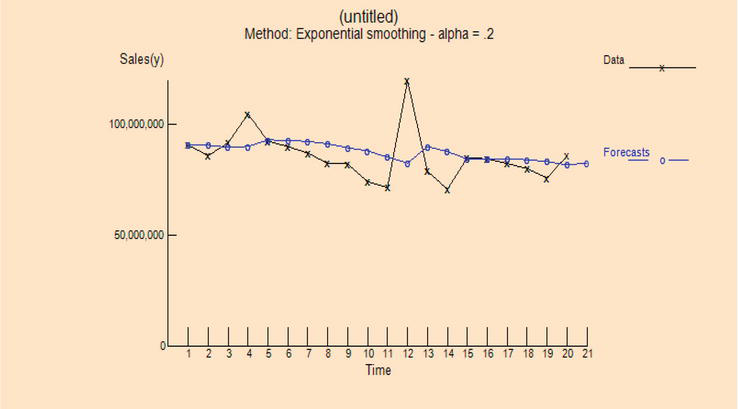
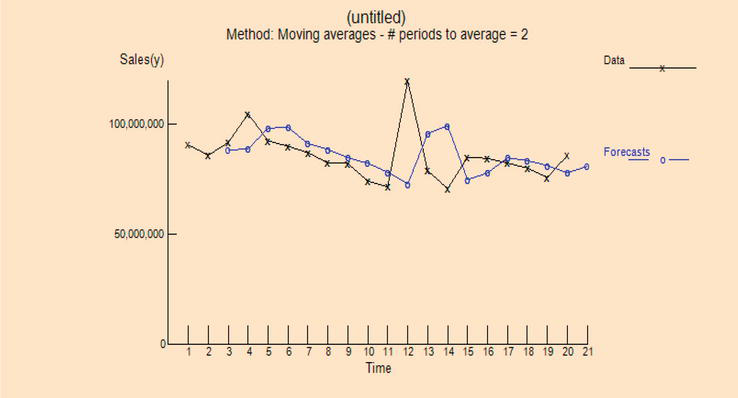
Figures 1–3 depict the results obtained from the use of naive, exponential smoothing, and moving average methods of the forecast models. The MAPE for the three methods are 10.93%, 10.7%, and 11.91% respectively and this makes exponential smoothing the best method with minimum sales of N82, 171,270 (see Tables 3 and 4).
Figure 1.
Graph of naive method. Source: Field work, 2018.
Figure 2.
Graph of exponential smoothing. Source: Field work, 2018.
Figure 3.
Graph of moving average method. Source: Field work, 2018.
The analysis reveals the MAD, MSE, and MAPE of the six methods employed. MAPE for Naïve, Exponential Smoothing, Least Square, Moving Average, Multiplicative and Additive Decomposition is 10.9%, 10.2%, 8.6%, 11.9%, 7.64%, and 7.66% respectively. By comparison, it was observed that multiplicative decomposition seems to be preferable among the six techniques. This is because it generates the optimal forecast accuracy of 7.64%. This is contrary to the works of Sahu and Kumar [25] and Obamiro, [26] which recommended exponential smoothing as the best forecasting technique. Forecasts for the next period which is September 2018 sales, Naïve shows 85,783,240, Exponential Smoothing gave 82,171,270, Least Square has 85,708,270, Moving Average shows 80,749,510, and Multiplicative has 76,533,570, while Additive Decomposition is 76,109,460. This shows that additive decomposition is optimal in terms of forecast accuracy.
Kumar and Dalgobind [9] gave situations where qualitative methods are preferable to quantitative ones and they are when data are insufficient or are known to be unreliable, when it is not possible to construct a suitable numerical model and when the time is insufficient to initiate and operate a quantitative analysis. In groceries, comprehensive historical data (past sales) can be obtained by proper documentation of daily sales and this makes quantitative techniques more appropriate. Data used for this study were obtained from the grocery on the assumption that the sale figures were properly recorded. The performance of the forecasting methods (Naïve, exponential smoothing, least square, moving average, multiplicative, and additive decomposition method) in terms of accuracy of sales forecasts using MAD, MSE, and MAPE were determined. The findings reveal that the multiplicative method has the least forecast error and is hence more accurate. One of the limitations of this study is that the analysis was limited to chosen forecasting methods ignoring the complex and sophistication methods. This limitation has no effect on the reliability and validity of the demand forecast and its accuracy. Therefore, it is recommended that retail outlets should maintain regular sales and inventory records. This becomes easier if the operating system can be computerized but it could be expensive to operate. Also, the operators should determine demand forecast scientifically with multiplicative decomposition method (quantitative) forecasting techniques with past data instead of guessing estimates from using qualitative forecasting techniques which rely on soft information such as personal experience, intuition, values, and opinions.
References
1.Chindia EW, Wainaina G, Kibera FN, NF and GP Pokhariyal, PG Forecasting techniques, operating environment and accuracy of performance forecasting for large manufacturing firms in Kenya. International Journal of Managerial Studies and Research. 2014;2(7):83-100
2.Chao Y, Jimei Y, Brian P, Scott C, Jia D. Forecasting human dynamics from static images. In: Proceedings of the IEEE Conference on Computer Vision and Pattern Recognition. 2017. pp. 548-556
3.Türkşen O, Tez M. An application of nelder-mead heuristic-based hybrid algorithms: Estimation of compartment model parameters. International Journal of Artificial Intelligence. 2016;14(1):112-129
5.Levy M, Weitz B. Retailing management. McGraw-Hill Education; 2011
6.Jain A, Menon MN, Chandra S. Sales forecasting for retail chains. San Diego, CA: UC San Diego Jacobs School of Engineering; 2015
7.Gemmink M. A model to prevent stockouts in retail using time series sales forecasting. In: A Paper Presented at 27th Twente Student Conference on IT, Faculty of Electrical Engineering, Mathematics and Computer Science. University of Twente; 2017
8.Belt T. When is forecast accuracy important in the retail industry? Effect of key product parameters. In: Master’s Thesis Submitted to the Department of Industrial Engineering and Management. Aalto University School of Sciences; 2017
9.Kumar R, Dalgobind M. Application of proper forecasting technique in juice production: A case study. Global Journal of Researches in Engineering. 2014;13(4):42-47
10.Järvinen S. Improving 3-month sales forecasting for the sales unit. In: Being a master’s Thesis Submitted to the Department of Industrial Management. Helsinki Metropolia University of Applied Sciences; 2017
11.Paták M, Branska L, Pecinova Z. Demand forecasting in retail grocery stores in the Czech Republic. In: 2nd International Multidisciplinary Scientific Conference on Social Sciences and Arts SGEM. 2015. pp. 693-700
12.Kini D, Mathur U, Viswanathan M. Dynamic race prediction in linear time. ACM SIGPLAN Notices. 2017;52(6):157-170
13.Corsten D, Gruen T. Stock-outs cause walkouts. Harvard Business Review. 2001;82(5):26-28
14.Xia M, Zhang Y, Weng L, Ye X. Fashion retailing forecasting based on extreme learning machine with adaptive metrics of inputs. Knowledge-Based Systems. 2012;36:253-259
15.Ehrenthal JC, Stolzle W. An examination of the causes for retail stockouts. International Journal of Physical Distribution & Logistics Management. 2013;43(1):54-69
16.Helm R, Hegenbart T, Endres H. Explaining costumer reactions to real stockouts. Review of Managerial Science. 2013;7(3):223-246
17.Lee HS, Kim H, Park H, Kang P. Pre-launch new product demand forecasting using the bass model: A statistical and machine learning-based approach. Technological Forecasting and Social Change. 2014;86:49-64
18.Lawrence M, O’Connor M, Edmundson B. A field study of sales forecasting accuracy and processes. European Journal of Operational Research. 2000;122(1):151-160
19.Moon S, Simpson A, Hicks C. The development of a classification model for predicting the performance of forecasting methods for naval spare parts demand. International Journal of Production Economics. 2013;143(2):449-454
20.Orrebrant R, Hill A. Increasing sales forecast accuracy with technique adoption in the forecasting process. 2014
21.Özlem AKAY. A computational method based on interval length for fuzzy time series forecasting. NATURENGS. 2016;2(1):22-33
22.Aras S, Deveci Kocakoç I, Polat C. Comparative study on retail sales forecasting between single and combination methods. Journal of Business Economics and Management. 2017;18(5): 803-832
23.Chu CW, Peter G. A comparative study of linear and nonlinear models for aggregate retail sales forecasting. International Journal of Production Economics. 2003;86:217-231
24.Sapirstein P. Accurate measurement with photogrammetry at large sites. Journal of Archaeological Science. 2016;66:137-145
25.Sahu PK, Kumar R. Demand forecasting for sales of milk product (Paneer) in Chhattisgarh. International Journal of Inventive Engineering and Sciences. 2013;1(9):10-13
26.Obamiro JK. Demand Forecasting and Measuring Forecast Accuracy in a Pharmacy. Unpublished manuscript. 2018
Written By
John Kolade Obamiro, Wasiu Oluwasegun Kehinde, Jonathan Ehimen Ekpudu and Oluwasegun David
Submitted: 21 March 2022Reviewed: 23 March 2022Published: 23 August 2022
 Open access peer-reviewed chapter