Open Access is an initiative that aims to make scientific research freely available to all. To date our community has made over 100 million downloads. It’s based on principles of collaboration, unobstructed discovery, and, most importantly, scientific progression. As PhD students, we found it difficult to access the research we needed, so we decided to create a new Open Access publisher that levels the playing field for scientists across the world. How? By making research easy to access, and puts the academic needs of the researchers before the business interests of publishers.
We are a community of more than 103,000 authors and editors from 3,291 institutions spanning 160 countries, including Nobel Prize winners and some of the world’s most-cited researchers. Publishing on IntechOpen allows authors to earn citations and find new collaborators, meaning more people see your work not only from your own field of study, but from other related fields too.
To purchase hard copies of this book, please contact the representative in India:
CBS Publishers & Distributors Pvt. Ltd.
www.cbspd.com
|
customercare@cbspd.com
Large dams are grand structures with a complex nonlinear dynamic behavior. These nonlinear effects, though relatively small, can be very important for the analysis of dam mesoscopic damage accumulation using available monitoring data, namely, the time series of strains/tilts of the dam structure in response to the periodic filling/draining process of the reservoir. The authors derive the characteristics of the unknown dynamics using the time series of tilts and strains of a structure by means of recurrence plots (RPs), recurrence quantification analysis (RQA), Lempel-Ziv complexity (LZC), mutual information (MI), detrended fluctuation analysis (DFA), and singular spectrum analysis (SSA) for studying dam dynamics. Anomalies in the nonlinear dynamics characteristics of the measured time series of the tilts/strains of dam during the reservoir regular filling/discharge process may signal the abnormal behavior of the object. These methods were used for the analysis of the monitoring data of the 271-m-high Enguri arch dam, still one of the highest (in its class) dams in the world, which was built in the canyon of Enguri river (West Georgia) in the 1970s. Since 1996, the European Centre “Geodynamical Hazards of High Dams” of the Council of Europe has been operating on Enguri dam. Since 2020, the International Project DAMAST: Dams and Seismicity has been going on in the Enguri dam area.
M. Nodia Institute of Geophysics, Tbilisi State University, Georgia
European Centre “Geodynamical Hazards of High Dams” of the Council of Europe, Georgia
Teimuraz Matcharashvili
M. Nodia Institute of Geophysics, Tbilisi State University, Georgia
Ekaterine Mepharidze
M. Nodia Institute of Geophysics, Tbilisi State University, Georgia
Levan Mebonia
LLC “Engurhesi”, Georgia
Mirian Kalabegashvili
LLC “Engurhesi”, Georgia
Nadezhda Dovgal
M. Nodia Institute of Geophysics, Tbilisi State University, Georgia
*Address all correspondence to: tamaz.chelidze@gmail.com
1. Introduction
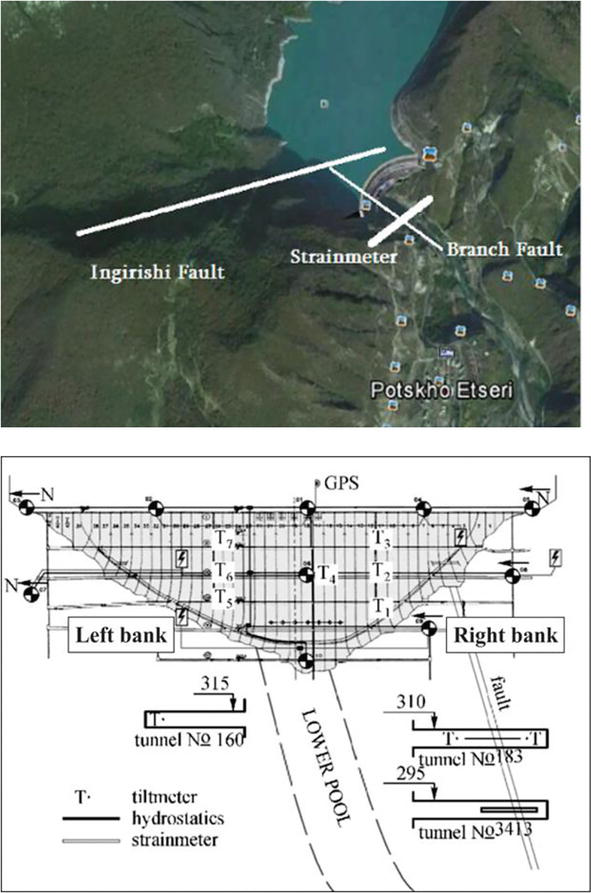
The high Enguri arch dam (271 m) was erected in the 1970s in the canyon of the river Enguri. The dam area is a zone of high seismicity with the moment magnitude Mw = 8. It is close (several hundred meters) to the large Ingirishi active fault (Figure 1).
Figure 1.
Space image of Enguri dam area (upper) and the cross-section of Enguri dam with a monitoring system, a view from the upper pool (lower): T—Tiltmeters; S—Laser strainmeter.
The high seismic and geodynamical activities together with the dense population downstream of the dam made the Enguri dam with its one billion cubic meters water reservoir a potential source of a major catastrophe in Georgia. In turn, this means that the dam should be under permanent monitoring. The first geological/geophysical prospecting of the Enguri Dam area began in 1956 by the Moscow Institute “Hydroproekt” and its branch in Tbilisi. Since 1970, the M. Nodia Institute of Geophysics (MNIG) has been actively participating in the solution of problems related to dam planning and monitoring.
In 1996, the European Centre “Geodynamical Hazards of High Dams” (GHHD) with the International Test Area (EDITA) was organized in Georgia by the Council of Europe (www.coe.int/t/dg4/majorhazards/centres). Since 2020, Georgia has been participating in the International Project DAMAST: Dams and Seismicity—Technologies for safe and efficient management of hydropower reservoirs (http://ig-geophysics.ge/IG/wp-content/uploads/2017/08/). Partners plan to investigate the impact of tectonic, seismic, and technological processes on the Enguri dam and its environment in order to assess the possible sources of hazard to the structure and elaborate the modern safety concepts of large engineering constructions in the regions of high seismicity. The project provides for the implementation of the innovative methods: satellite-based global navigation satellite system (GNSS) and interferometric synthetic aperture radar (InSAR) systems, microseismic observations for monitoring tectonic, and man-made deformations of the Enguri dam and surrounding area as well as detail study of the reservoir induced microseismicity.
For the practical use of the monitoring data, we designed the program DAMWATCH [1] for highlighting the anomalies in the dynamic characteristics of the measured time series of the tilts/strains of dam during the reservoir regular filling/discharge process, which may signal the abnormal behavior of the object. To detect false anomalies caused by the regular technological (repair, planned water discharge, etc.) and weather factors (waves generated in the reservoir by seiches) and to separate them from the signals of possible dangerous processes in the dam and its foundation (anomalous local deformations, etc.), it is necessary to keep the detailed chronological list of technological and weather impacts.
Finally, the authors would like to note that the Enguri dam area is an amazing natural laboratory, where one can investigate in detail the dam response to both the natural (tectonic, meteorological) and geotechnical (lake load-unload) impacts, i.e., the structural, geodynamical, and seismic reaction to a controllable loading of the Earth crust.
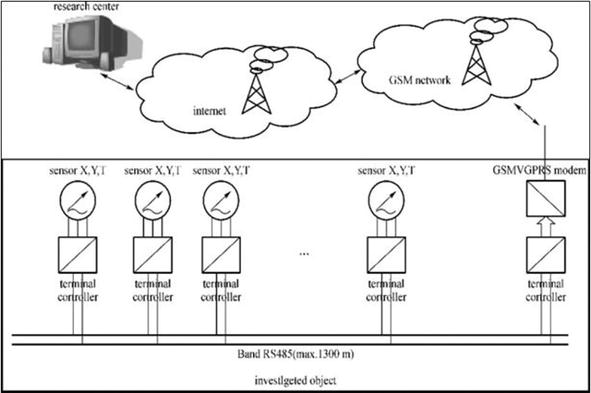
The creation of an effective monitoring/early warning system (EWS) is a necessary component for providing a secure exploitation of the large dams [2, 3]. The M. Nodia Institute of Geophysics (MNIG) and Georgian-European Centre GHHD, operating in the frame of Open Partial Agreement on Major Disasters at the Council of Europe (EUR-OPA) developed the permanent multi-disciplinary geodynamical-geophysical telemetric monitoring network (Figure 2). This cost-effective early warning system (EWS) consists of sensors (tiltmeters, APPLIED GEOMECHANICS Model 701-2, laser strainmeters), terminal and central controllers and GSM/GPRS Modem—for sending information to the diagnostic center (Figure 2).
Figure 2.
The monitoring system of Enguri dam consists of sensors (tiltmeters, APPLIED GEOMECHANICS model 701-2) and strainmeters, which are connected to terminals and central controllers. GSM/GPRS modem transmits the data to the diagnostic center.
The Enguri dam area is located in the continent–continent collision zone of the eastern segment of the Mediterranean Alpine Belt, between the converging Africa-Arabian and Eurasian lithosphere plates [3]. The branch fault (Figure 1a, b) of the main east-northeast (ENE), west-southwest (WSW) oriented Ingirishi fault crosses the foundation of Enguri dam and threatens the dam safety seriously. In order to monitor permanently the fault behavior, a quartz strain-meter crossing the fault zone (FZ) was installed 100 m downstream of the dam foundation in December 1974. The fixed and free parts of the strainmeter are located on the opposite sides of the FZ in the intact massive; it records fault zone extension (FZE). After 2000 the free end of the tube is equipped with the laser system (Laser model R-39568, Green HeNe Laser, 633 nm and Laser Position Sensor OBP-A-9 L) instead of old-capacity sensors.
The displacements’ sensitivity of the strainmeter system is of the order of 1 μm/mm. The monitoring system of the Enguri dam and its foundation includes also, besides tiltmeters and strainmeters, a network of piezometers and reverse plumblines [4], weather station, and water-level (WL) gauges for monitoring water level in the lake.
Engineering studies of the dam and its foundation. To study the current state of the rock mass in the right bank of the dam foundation, several wells have been drilled, and engineering-geological and geophysical analyses of cores were carried out in 2019. After filling the reservoir and the emergence of a new aquifer under the dam the pressure variation at drawdowns and fillings of the lake cause not only the compaction/extension of the massive, but also the partial dissolution of the crack calcite filler in the mass. According to the results of wells’ video-logging in the right bank, it should be noted that the rocks in the upper part of the wells look, for the most part, very strongly destroyed and cavernous. Probably, during dam operation, many calcite veinlets were eroded, and their filler turned into a powder and partially dissolved: as a result, a large number of small voids appeared, which are visually traced on the surface of the well. The presence of the right-bank fault led to the superposition of the influence of two natural factors (fault, veinlets of quartz in limestones) and a series of artificial ones (the load-unload cycles, accompanied by the filtration of water) that arose due to the impact of the system operation. According to the completed documentation of the drilled wells, the supposed most vulnerable near-contact part of the dam base is in a satisfactory condition. The results of ultrasonic logging confirm the indications of video logging and geological documentation data.
To assess the deformation processes of the foundation, a numerical analysis was carried out using a three-dimensional model of the “dam-foundation” system, taking into account operational loads and the relative degradation of the deformation and elasticity modulus in the “load-unload” cycles. The considered factors affect the rotation of the deformation vector of the left dam abutment toward the riverbed and the right-bank abutment—to the depths of the massif.
The residual displacements of the dam and foundation during filling and drawdown of the reservoir after 40 years of operation exceed the displacements obtained by the “dam-foundation” system during the first filling of the reservoir to the design level. At the same time, the graphs of the calculated displacements of the characteristic points on the crest of the dam indicate the damping nature of the growth of deformations last years, approximately from 2011.
Thus, the features of the canyon shape, the geological properties of the foundation, the geometry of the arch dam and deformations accumulated during many years of dam operation contribute to the formation of an inhomogeneous stress field in the rock mass of the left-bank abutment and a less favorable development of deformation processes compared to the right bank.
Traditional approach. The standard dam diagnostics based on the linear elasticity model as a rule ignore the microscopic inhomogeneity of the dam material. Elastic properties of such inhomogeneous materials at small concentration of defects are described by the theory of effective media [5] and at the high density of defects - by percolation elasticity theory [6]. The standard static analysis of monitoring data was performed using a 3D finite-element model (FEM) for the dam-foundation system. The correlation between natural observations and theoretical calculation at lower levels of the dam is acceptable, but there are significant deviations from the calculated values in the upper dam levels (Table 1). The displacement observations’ data obtained by two different methods (tiltmeters and plumblines) are in satisfactory agreement (Table 1). The diagnostics of dam safety according to [7] considers three stages: 1—the normal state (N); 2—the strain is maximal allowable (MAS); 3—the strain corresponds to a pre-failure stage (PFS). The most grave diagnose PFS mean that after repeated investigation the exploitation regime should be changed up to the 0full shutoff.
Dam Level Observation Level, m
Section 12
Section 18
Section 26
Observed plumbline data, mm
Observed tiltmeter Data, mm, sec
CAV mm, sec
Observed plumbline data, mm
Observed tiltmeter Data, mm,sec
CAV, mm
Observed plumbline data, mm
Observed tiltmeter Data, mm. sec
CAV, mm
360
20
11 (38 ± 5.1)”
89 (122)”
35
15
14 (46 ± 5.6)”
88
402
40
32 (63 ± 4.5)”
59 (112)”
60
55 (70 ± 3.9)”
55
30
37 (74 ± 4.1)”
58
475
60
48 (56 ± 8.7)”
31 (182)”
65
55
42 (55 ± 5.5)”
26
Table 1.
Comparison of observed plumbline horizontal displacements and tiltmeters data at the maximal water level (WL) in the lake (510 m) for three sections of Enguri dam with theoretical critical admissible values (CAV) of plumblines (2008).
The analysis of the table leads to the following conclusions: a. at the WL 360 m, all the displacements are less than critical values (class N); b. at the level 402 m, only in the central 18-th section, the displacements are close to critical ones (class MAS); 3. at the highest level (475 m), displacements of the side sections are larger than critical by 8–13 mm, i.e., at this level, the state should be considered as class MAS or “faulty.” At the same time, the dam performs normally, and there are no signs of significant damage, which mean that the theoretical model should be updated.
The most important drawback of this approach is that the static design model does not predict nonlinear effects, i.e., the existence of hysteresis phenomenon and the possible impact of dam material aging.
3.2 Long- and short-term diagnostic tools
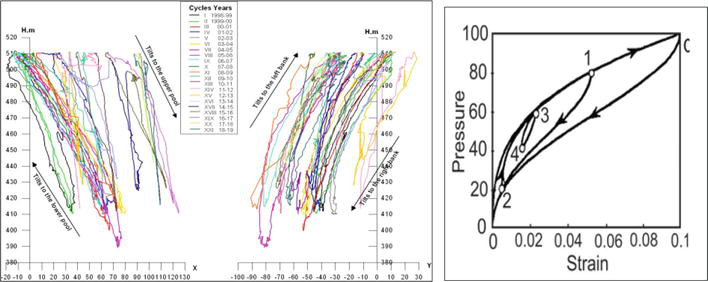
Long-term diagnostic tools. In the standard approach to dam safety assessment the response of real strain/tilt data of construction is compared to the design values based on Hooke’s linear-elastic constitutive model. If the stress–strain response during load-unload cycle follows the hysteretic cycle that signals on the significant deviations of observed data from the static elasticity model (Figure 3, Table 1). The generally accepted explanation of hysteresis is thermo-elasticity, though the mesoelasticity theory (see below) can be more appropriate [8].
Figure 3.
Left—Horizontal axis—tilts, registered in the section 12, mark 402 of Enguri arch dam (in sec), along (X) and normal (Y) to the dam crest; vertical axis—water level in the lake H in meters, during 21 seasonal cycles (1998–2019); Right—the history of strain during the pressure cycle applied to a system, containing many hysterons. Note the similarity of the real and theoretical hysteresis curve structures.
Other peculiarities of the load-unload process (time lag between water load and strains in the dam, details of strain build up and relaxation)can also be used for long-term diagnostics.
Short-middle-term diagnostic tools. Besides above indicators, there are some short-term features in the low-frequency (LF) part of the spectrum of natural frequencies of dam vibration (dam tremble), which reflect the response of dam structure to various impacts such as water discharge, wind and waves, turbine rotation or ambient seismic noise. This can be used for the operative/express dam state diagnostics, namely, LF dam vibration spectrum (amplitudes) should respond to the change of the state of dam damage (some frequencies disappear; new harmonics appear, etc.).
3.3 Nonlinear Response—Hysteresis
Figure 3 presents the tilts, registered in the body of Enguri Dam, (Section 12, mark 402) in two directions, along (X) and normal (Y) to the dam crest versus water level (WL) in the lake H in meters, during 20 seasonal cycles (1998–2018). The theoretical interpretation of experimental hysteretic tilt-stress dependences at present is mainly taking into account thermal effects, though, in our opinion, it can also be accomplished by the theory of the mesoelasticity (mesoscopic nonlinear elasticity) model. In the thermal theory of hysteresis, the dam material is considered as homogeneous media. In reality, the dam material is heterogeneous and contains an enormous number (109–1012) of the so-called mesoscopic structural features (mainly compliant microcracks) in a square centimeters, which means that macroscopic elastic properties of material depend strongly on the behavior of microcracks under varying stress. Such structures as a rule manifest nonlinear hysteretic elastic behavior, which is connected with a specific response of the microcrack system to stress variation, namely, asymmetric response to load and unload (Figure 3 right). The formal approximation of experimental annual hysteresis data can be accomplished using the Preisach-Mayergoyz (P-M) phenomenological model [8]. In the P-M model, the system is represented by the complex of hysteretic elastic units or hysterons.
The hysteresis in the stress–strain dependence stems from difference in the number of open/closed defects (hysterons) at increasing and decreasing pressure. Like in all hysteretic phenomena, this difference in load-unload response is due to irreversible energy losses during the process of crack growth (or generation) so that for restoring the population of closed cracks at unloading it is necessary to apply an additional pressure ΔP. As the value of ΔP depends on the concentration of hysterons, the opening of hysteresis loop reflects the level of material damage. One can use this parameter for diagnostics purposes [8]. The above P-M model corresponds to the reversible hysteresis process (Figure 3, right), which means that after the loading/unloading cycle, the system returns to the initial state. In the real systems, the process is not reversible as besides elastic strain, there is also residual deformation. Consequently, in repeating load-unload cycles the positions of hysteresis loops initial and final points shift along the strain axis, as it is evident in Figure 3. The shift of hysteresis loops can be used as a measure of residual strain (damage rate) in a given material.
The variation of the slip rate during load/unload of dam lake can also be related to the change of the state of fault filling material. During the operation of the dam, under the influence of loads and physical-chemical leaching processes, a partial transformation of the vein calcite into a powdered state occurred, which can increase strain rate (SR). On the other hand, the penetration of hydrothermal solute can lead to the formation of numerous solid veins and veinlets of quartz and calcite, increasing the fault stability (increasing friction of fault faces). Some of the observed secondary short-term hysteresis loops (Figure 3) occur too fast, which make the relatively slow physical–chemical mechanism less probable.
The decisive validity test of two models—thermoelasticity and hysteron (mesoscopic nonlinear elasticity)—would be finding hysteretic behavior at the almost constant temperature conditions: that should be connected mainly with the mesoelasticity effect due to the fast variation of WL in the reservoir, though we cannot exclude the contribution of thermoelastic component also during the long load-unload cycle.
3.4 Dam reactions—Monitoring data
Reactions of the dam structure to the natural and technogenic strains. As was mentioned, the generally accepted approach to the dam safety problem is to compare the observed strain, characteristic frequencies, etc., to the calculated critical values. The calculated dominant frequency (main mode) on the crest of the Enguri dam is around 2 Hz, which is in a good accordance with the results of analysis of accelerograms recorded during the last 2005 Racha earthquake (EQ). At the same time, our data obtained by 701 platform tiltmeters at the high sampling rate (1 per minute) show that EQs excite vibrations at the much lower frequencies also.
Technical (exploitation) impacts. The tiltmeter recordings show that some technical operations, including trivial energy cuts as well as scheduled water discharges for reducing WL at the intensive inflow may induce significant effects on the tilts/strains of the dam complex [4].
Earthquakes. The analysis of seismic record of the October 6, 2005 Racha event M = 6, occurred at the distance 100 km, shows that two mean frequencies can be identified ~1.6–1.7 and ~2.1–2.2 Hz, which mean that for relatively high frequencies, the dam response is elastic, unlike its hysteretic response to slow strains. At the same time, our data obtained by 701 platform tiltmeters at a high sampling rate (1 per minute) show that EQs excite dam vibrations at the much lower frequencies also. The analysis of low-frequency (LF) response spectra indicates that the network consisting of such tiltmeters extends significantly the frequency range of nonbroadband seismic devices from 100 Hz to a quasi-static range; this can give enormous additional information on the dam state.
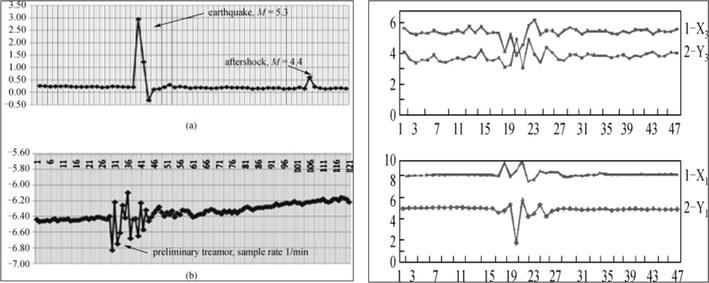
The distance from the great Tohoku EQ epicenter to Enguri dam is 7800 km. The Enguri dam responds to the event by appreciable vibrations (Figure 4, right). Only the trace of the long period seismic wave components (30 sec and more) was registered due to a low sampling rate.
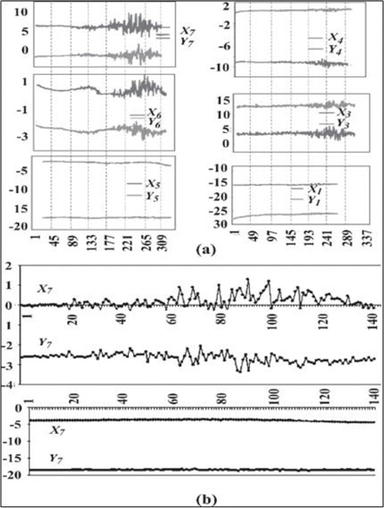
Figure 4.
Left, (a)—expanded recording of Enguri dam tilts due to the local Vani EQ: Main EQ—Vani, M = 5.3, 19.01.2011 (distance to dam 80 km) and aftershock M = 4.4; (b)—preliminary tremor 13 hours before main Vani event; sample rate - 1/minute. Right—Dam tilts at Tohoku (Japan) EQ , M = 8.9 march 11, 2011, at 05:46:23 UTC on the stations X1 Y1 and X2 Y2; sample rate 1/10 min.
Seisches. In the enclosed body of water, the disturbances of water body by wind, earthquakes, etc., generate a standing wave or seiches, which, in turn, excite the vibrations of the dam. The seiche-generated vibrations on the Enguri dam were recognized by their co-incidence with strong winds. The disturbance from seiches can be interpreted in the following way: the longest natural period T of seiches in an enclosed rectangular body of water is T=2L/√gh, where L is the length, h is the average depth of the body of water, and g is the acceleration due to gravity. Inserting corresponding values L= 25 km and h = 50 m for the Enguri lake, we get for the period of seiches T = 38 min, close to the observed values: 30–40 min (Figure 5).
Figure 5.
(a) Example of perturbations in the dam tilts due to strong wind (seiches): Readings from 1 to 171 correspond to a calm weather and readings from 171 to 292—To a stormy one. The sample rate—1/10 min.); (b) expanded record of tremor caused by lake water perturbations due to seiches—The mean period of perturbations is of order of 30–40 min.
Intensive water discharge. The discharge of excess water through a slide gate (dam outlet) also causes tremors in dam body: their signature is the maximal intensity in the middle level of dam and smaller intensity at both the upper and lower levels.
Fault strain change due to intensive precipitation. The strainmeter installed on the fault crossing the foundation of the dam registered abrupt strong deviations of the FZ strain rate from the regular background values during strong precipitation events. The observed strain rate exceeds the regular pattern connected with the lake load-unload by several orders of magnitude. The anomaly could cause serious alarm, if one does not know the nature of this transient [9].
A detailed study of long- and short-term anomalies is important, as they can be precursors of a serious trouble. At the same time, some anomalies are of trivial technical origin connected with dam exploitation, as it was shown above. Thus, it makes sense to keep a systematic record of anomalies and compare it to usual technical “noise”, as well as to the impacts of meteorological factors (strong winds, intensive precipitation, etc.) in order to single out the really dangerous precursors of construction damage.
3.5 Strains in the dam foundation
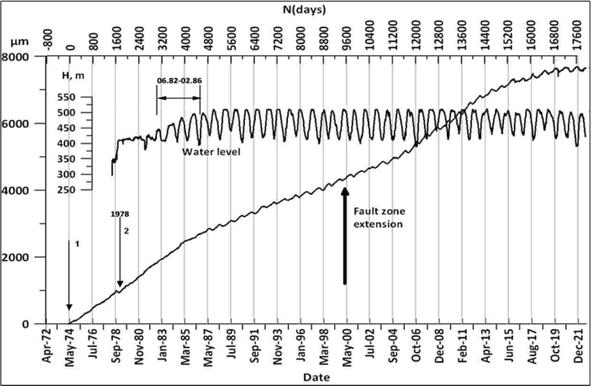
Figure 6 presents the strain (extension) history of the fault zone (FZE) under the dam during almost half-century, which demonstrates that dramatic changes can happen in its dynamics with time. The record of the fault extension rate shows that significant changes—namely, acceleration and deceleration—occur in 1984, 1987, 2004, 2013, and 2017. There are two main components of the strain rate curve—the piecewise-linear changing increment of the fault opening and superimposed on its quasi-periodic strain variation.
Figure 6.
WL in the Enguri lake (H, meters) from 1978 to 2021 (upper curve) and the data on the extension/compaction (in micrometers) of the branch of Ingirishi fault, crossing the foundation of the dam, from 1974 to 2021 (lower curve). Arrow 1 corresponds to the start of strainmeter monitoring.
Table 2 presents the time history of the fault zone extension (FZE) linear component, (defined as a straight line approximating the general trend) beginning from 1974, i.e. before the erection of the dam to 2021.
N
Periods, months–years
Number of days within the periods 1–7; in the brackets the same from the zero day (01.04.1964) to the end of a given period
Strain rate microns/year
1
May 1974– Sep 1984
1600 (3807)
250
2
Sep 1984–May 1987
973 (4780)
160
3
May 1987–Sep 2004
6332 (11,112)
147
4
Sep 2004–Apr 2013
3379 (14,400)
233
5
Apr 2013–June 2017
1551 (16,000)
147
6
June 2017-Dec 2021
1160 (17,600)
44
Table 2.
Periods with a different strain rates on the fault.
We discuss the possible explanations of the strain rate change we discuss later on.
Intermediate-term strains of the fault zone. Figure 6 shows the pattern of dependence of fault zone extension (FZE) on the water level H. We used the detrended from the linear part FZE trajectory (i.e., the quasi-periodic decoration of the FZE) during one year’s recharge period (30 Apr 2013-30 Sep 2013), which is more or less repeated from year to year to assess the reaction of fault strain to ΔWL variation. According to the data, WL rise in the lake by 80 m leads to the (almost reversible) change in an FZC equal to 70 μm. Accordingly, the fault sensitivity to WL variation is FZE/ΔWL ≈0.875μm/m. Note that, actually, the FZ displacement plot is hysteretic and the above approximation describes only the close to linear (longest) section of the hysteresis loop (excluding its short initial and final nonlinear sections).
To ensure the operative statistical and dynamical investigation of dam stability problem, the modern methods of nonlinear dynamics analysis of strain/tilt time series are appropriate to use [10, 11]. Contemporary methods of time-series analysis include detrended fluctuation analysis (DFA) [12], Recurrence Plots (RP) and Recurrence Quantitative Analysis (RQA) [13], algorithmic (Lempel-Ziv) complexity measure (LZC) [14, 15], mutual information (MI) [16, 17], singular spectrum analysis (SSA) [18], and Mahalanobis distance (MD) [19].
The suggested methods for dam safety analysis are informative because: i. the strains/tilts and other geotechnical parameters of the dam as well as dynamic characteristics of strains/seismic activity in the dam area manifest as a rule quasi-periodic variations in time due to seasonal cycles; ii. due to quasi-periodic dynamics of water load, the related strain/tilt time series should follow relatively stable orbits in the phase space; and iii. the strong decrease of time-series determinism or significant deviation from the stable orbits compared to long-term stable pattern of strains/tilts/seismic activity can signal on the beginning of instability. In the following, we present short descriptions of the used methods.
RP is based on the analysis of recurrences of the system to the certain state (or the state space location), reflected by appearance of diagonally and vertically oriented lines in the recurrence plot. This is a fundamental property of any dynamical system with quantifiable extent of determinism.
RQA enables to quantify the features of the diagonally and vertically oriented lines in the recurrence plot by means of several measures of their complexity. In this research, we calculated: i. determinism %DET—the fraction of recurrence points that form diagonal lines of recurrence plots (they show changes in the extent of determinism in the analyzed data sets); ii. laminarity %LAM, the number of recurrent points that form vertical lines: in other words, it represents the frequency of laminar states in the system; and iii. trapping time (TT)—the length and amount of the vertical structures in RP, which show how long the state of the system is trapped.
LZC calculation is used for assessing the extent of order in different data sets by transformation of a given data set to a new sequence of symbols. For this, the original data are compared to a certain threshold value (say, the median of the observed data set) and converted into a 0, 1 series. The obtained symbolic sequence is parsed to obtain distinct words, which are encoded by a specific rule.
MI—expressed in bits—measures the mutual dependence between two variables. High mutual information corresponds to the reduction of randomness—if the two data sets are independent, the MI is low. For fully independent variables, MI is zero, and for highly correlated variables, MI is of the order of one or larger.
SSA: singular spectrum analysis allows the decomposition of time series into a sum of independent components. According to [20], using SSA one can forecast new data points based on the existing information even if the time series are short and noisy. We use SSA to divide fault deformation monitoring data into two main components: long-term and short-term oscillations.
MD: Mahalanobis distance for the multivariate data measures a distance relative to the centroid—a central point of the scattered values. The farther is the given data point from the centroid the larger is MD. Usually, the MD is used to discover outliers in multivariate data (large values of MD). This points to the anomalous behavior of the system.
ML: machine learning in the past few years has been used extensively for the prediction of the evolution of nonlinear system learning from the existing past data. ML allows analyzing the behavior of a dynamic system even if it is impossible to solve the problem in a closed analytical form. At the same time, the application of data-driven ML can lead to unveiling of the associated nonlinear dynamics regime [21, 22].
We used most of the above-mentioned nonlinear dynamics methods for the analysis of Enguri dam temporal behavior [9, 23, 24, 25, 26, 27, 28, 29, 30].
4.2 Nonlinear dynamics of the dam structure tilts
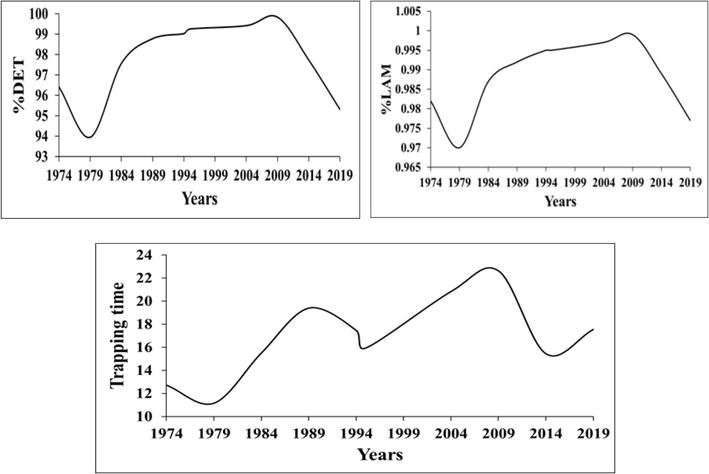
In order to test the sensitivity of selected methods and assess the effects of external influences on the strain dynamics of the dam foundation, strain data sets in the foundation of Enguri HPP in the period from 1974 to 2009 are considered. Figure 7 illustrates RQA determinism (RQA%DET), %LAM, and trapping times (TTs). It is evident that for the different stages of dam construction and reservoir filling, significant quantitative differences occur in the recurrence attributes of phase space structures reconstructed from the fault strain datasets. Note that nonlinear dynamics of strain time series demonstrate a decrease of initial high enough level of determinism, laminarity, and trapping time during initial filling of lake with a minimum around 1979. After this, all the three parameters increase to the maximal values around 1984 and stay high till 2012—in this period, WL variations became periodic. In the following years, the ordering decreases significantly (Figure 7).
Figure 7.
RQA characteristics of the displacement of Enguri Dam foundation in 1974-2013: 1. %DET; 2. %LAM; and 3. trapping times (TT).
4.3 Nonlinear dynamics of the fault strain
Global tectonic factor. The long-term piecewise-linear trend recorded by strainmeter (Figures 1–6) documents a persistent separation of fault faces, extending to 7500 μm (7.5 mm) during the observation period. The dynamics of fault reflects a joint influence of two main factors: one leads to a piecewise linear displacement (the trend component) and the other one—to quasiperiodic oscillations, decorating the main trend. The linear component of FZE rate (y) depends on the time (t) following a simple equation: y (t) = at—b, where the coefficient a, the slope of the linear component of the fault zone extension (FZE) differs from one period to another (Table 2). The first trend component (the strain rate 250 μm/m) is characteristic for 1974–1978, i.e. the period before dam construction and initial lake filling. It is natural to explain it by the action of existing natural regional tectonic stress. After this period, the fault zone extension rate (FZER) is varying significantly with time, due to the impact of some non-stationary factors (Table 2). Probably, the variation of the strain rate of the fault reflects the interplay between tectonic force, detail fault structure and water lake pressure. The several different epochs in the strain rate (SR) history (Table 2) can be explained by the interplay of some strain decelerating/accelerating factors. The 10-meter-wide fault zone is filled with strongly fractured rocks. Under stress, the extremely fractured/dense granular material exhibits mechanical properties that range from fluid to solid behavior. This complex behavior is due to the formation of the force chain networks (FCNs) (networks of force-accommodating chains) under applied stress. As a rule, such interconnected force chain networks form elastic structures, percolating through a compressed granular system. The force chain network (FCN) supports the applied stress and ensures the ability of a granular system to resist deformation. Thus, the macroscopic elastic properties of such systems are determined by the development of percolating force chains. Using the above model, the first SR deceleration in 1984 can be explained by the increase in the density of percolating force chain networks (increased elasticity) of the fault gouge due to increased load on the fault at rising the water level by 150 m. The following SR acceleration 2004–2013 can be caused by the damage of the existing dense FCN, possibly due to periodically varying water load cycles leading to the so-called reversed-stress fatigue of material. We explain the presence of several different epochs in the strain rate history (Table 2) we explain by the interplay of the above-mentioned accelerating/decelerating factors.
Technogenic impact. Applying singular spectrum analysis (SSA) to the residual component of detrended original displacement data in the first 4500-day interval (the summary time before impoundment, during first fillings and irregular load-unload regime), we found that the leading period in the power spectrum of FZE time series is about 1.5 years [9]. After this date began the period with quasiperiodic water level variation, when the clear leading cyclic component with the period close to 1 year appears in the SSA graph: this cycle was absent in FZE dynamics before a regular variation of WL [9].
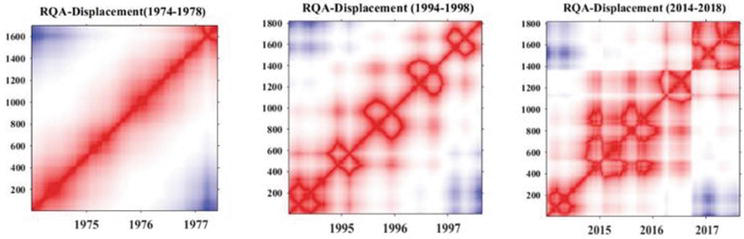
We obtain similar results using the recurrence plot analysis of the fault displacements’ 45-years history (Figure 8): i. before reservoir filling (1974–1978) and in the next 5 years, till 1982 in the RP plots there are no clear signs of periodicity; ii. only after the beginning of the regular exploitation of reservoir, the characteristic periodic recurrent structures—the identical 5 yearly cycles—appear in the RPs, which last in 1994—2013; and iii. the RP for the last years (2014–2018) differs from previous patterns—the recurrent structures are less regular due to some technical repair works on the dam.
Figure 8.
Recurrence plot analysis (RP) of fault displacements for the 5-year periods: Left—before reservoir filling (1974–1978); in the next 5 years the RP is the same; middle—during regular reservoir exploitation—the identical 5 yearly cycles are present in the RPs during 1994–2013 years; right—the RP for 2014–2018 differs from previous regular patterns—The pattern is less regular.
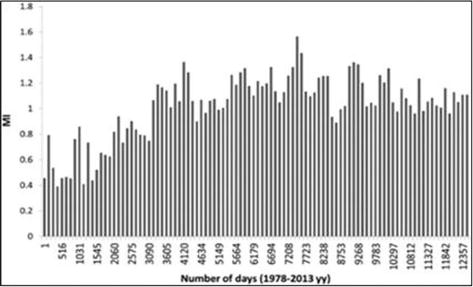
According to Figure 9, mutual dependence between WL and FZE variations increases from relatively low values—from MI=0.4 to MI=0.8—till the day mark 3090, which corresponds to the period of nonregular impoundment of the lake and to even greater values of the order of 1 or more after the start (in 1984) of the regular cyclic regime.
Figure 9.
Mutual information (MI) between WL and FZE variations (in bits) versus day number from the Jul-1978 to Sep-2013.
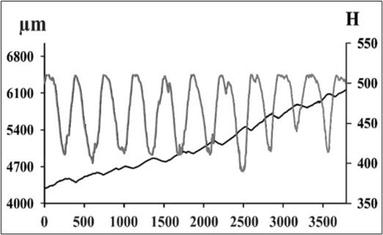
Note also that there is a phase lag between the maxima of WL and the maxima of FZE: the FZ displacement is retarded relative to WL maxima by several months (Figure 10). The delay can be explained by the fluid diffusion though the fault over the distance x from the lake to the strainmeter location (Figure 1). The response looks asymmetric during filling and discharge of the lake, but after subtracting the strain trend component the asymmetry disappears [9]. Using the Biot’s equation of poroelasticity in the low-frequency limit [31] allows us to understand the observed time lag between fault zone deformation and WL variation. According to it, the diffusion of fluid pressure perturbation P from a point source in a homogeneous hydraulically isotropic medium is described by the differential equation of fluid diffusion: dP/dt=D∇2P, where D is the hydraulic diffusivity coefficient. The solution of this equation is [32]: r=4πDt,where r—is the distance from the perturbation source (dam foundation) to a given point in the media and t is the time, needed for the pore pressure perturbation to reach a given point. Large phase lag between WL and FZE—200 days—points to the decisive role of poroelasticity in the fault zone dynamics [33].
Figure 10.
WL in meters (gray) and FZE (black) variations in microns versus the number of the readout’s day (the period January 1999–December 2009). Note that the maxima of the FZE are retarded relative to the maxima of water load by 200 days.
The distance between the Enguri dam upper pool (pressure perturbation source) and the strainmeter site r is 100 m (Figure 1) and the mean value of the phase lag between the maxima of WL and the maxima of FZE during the regular impoundment regime is of the order of 200 days. Substituting these data into the above diffusion equation, we obtain for the hydraulic diffusivity D of rocks in the fault zone approximately D≈ 5×10 m2/s, which is close to the typical D values in similar rocks [34].
4.4 The phenomenon of reservoir-induced seismicity (RIS) synchronization
The probabilistic seismic hazard (SH) analysis of the dam area was carried out using the Cornell approach and computer program SEISRISK III [35]. For calculation of the peak ground acceleration (PGA) attenuation model and spectral acceleration (SA) for Caucasus after was used [36]. The maps for PGA and SA for 50-year exposure time and 1%, 2%, 5%, and 10% probabilities of exceeding critical SA were compiled [37]. The SA maps were calculated for frequencies of 1.5 Hz and 2 Hz. These frequencies are close to the first modes of natural frequency of the construction, and therefore, they are the most hazardous for the dam. The above SH assessment may change after the implementation of the International Project DAMAST.
The EQs occurred close to the Enguri dam area (at the distance from 0 to 10 km) are dominated by events connected with the near zone seismicity [9]. They are linked to the reservoir water-level regime in both space and time. Almost simultaneously with the last operation of reservoir impoundment, in September 1978, an abrupt reversible compaction by approximately 90 μm (at attaining the critical water level 100 m) was registered by the strainmeter installed on the fault, crossing the foundation of the dam.
A strong seismic activity very close to the dam: the Rechkhi EQs swarm, with a four main events of MW 3.7-4.3, was observed in December 1979 (Δ = 0–10 km, hypocenter depth 3–10 km). It followed with a 14-month lag the fast initial recharge (September 1978) of the lake up to the critical water level (100 m) [9, 38]. According to the existing data [39, 40], such water load as a rule generates a reservoir-induced seismicity (RIS).
Reservoir-induced seismicity (RIS) may take place either due to the change of water load and corresponding change in the Earth’s crust stress or by the decrease in the effective strength of the rocks by the increase in the groundwater pore pressure. These additional strains can induce an increase in both the number and the magnitude of EQs in the area close enough to the reservoir. As a rule, RIS is a transient phenomenon, which is observed after filling the reservoir with a delay, which can last from days to years. After this, the period of seismic activity decreases to the prefilling values [9] with one important exception: the time intervals between seismic events became significantly much more ordered than before periodic load/unload of the reservoir and this regime is persistent even after initial transition period [9]. This effect can be coined as Reservoir-Induced Seismicity Synchronization (RISS) [26]. The effect seems to be impossible, as the stress invoked by regular water level variation is a small external force compared to the acting tectonic forces—the main factors leading to seismic activity.
Nevertheless, the modern theory of synchronization [41] predicts that even a weak external periodic force applied to an autonomous self-sustained oscillator can adjust its rhythm. In our case, the water level in the reservoir is the source of periodic force, and the tectonic fault under dam is the autonomous self-sustained quasi-periodic system with dynamics connected with other varying factors, such as seasonal snow load, etc.
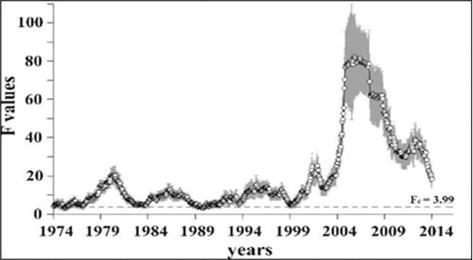
Next, the seismic process around the test area was investigated using Mahalanobis distance (MD) parameter based on the data sequences of its temporal, spatial, and energetic characteristics. The MD calculated for original data was combined with a surrogate data testing. It is useful to analyze the process based on unevenly sampled data sets used in this research, namely, sequences of increments of cumulative times of earthquake occurrences, cumulative distances, and cumulative seismic energies. After the computation of MD values, they were converted into F-values [19]. F-value is the confidence level estimate of the statistical difference between two types of data: here—between original seismic data and the set of randomized seismic catalogs around Enguri dam [23]. Then, calculated F-values were compared with the critical value for the randomized catalog, Fc. When F>Fc is calculated, then the null hypothesis that there is no separation between considered groups can be rejected, which means that there is a statistically significant difference between groups.
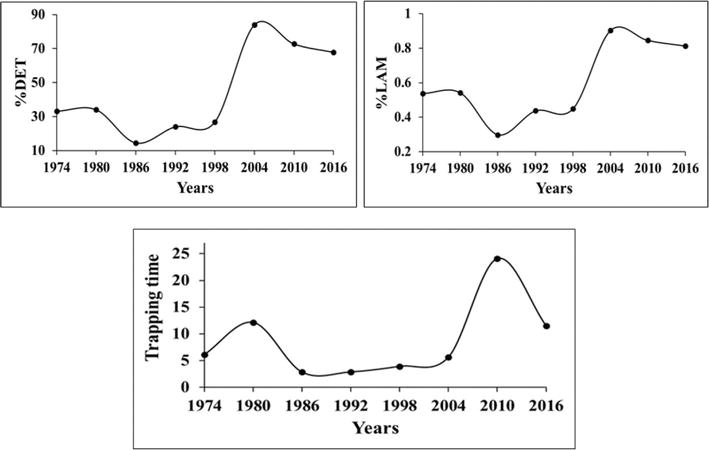
In Figures 11 and 12, the results of EQ waiting times’ analysis using RQA and LZ methods are presented. There are several intervals with significant changes in the EQ waiting times’ regime: 1974–1986—weak regularity in waiting times; 1986–2004—the interval of irregular seismicity; and 1998–2004—the period of increased regularity of waiting times with a maximum around 2010.
Figure 11.
RQA characteristics of earthquake waiting (interevent) times in 1974–2017 in the original seismic catalog in the Enguri dam area within 100-km radius: 1. %DET; 2. %LAM; and 3. trapping times (TT).
Figure 12.
Lempel-Ziv algorithmic complexity (LZC) analysis of waiting times between earthquakes for 1974–2017.
As is evident from Figure 13, according to MD-analysis, the seismic process becomes clearly different from a random one in the period, when the water level in the reservoir changed periodically, with a considerable delay. The ordering has become most obvious since the end of 2005. It is important that in the period prior to flooding (the end of 1977), the seismic process in the considered catalogue is indistinguishable from randomness (in all the windows, the calculated F-values are equal or below Fc). In the period of flooding and preliminary filling of the reservoir (after 1990), seismicity looks mostly different from randomness; after 2000 (i.e., several years after the beginning of the lake periodic loading), in all the windows, F is larger than Fc.
Figure 13.
F-values sequences from the original and the set of randomized seismic catalogs around Enguri dam: the gray bars show the scatted of F and circles are the mean values. The hatched line corresponds to a significant difference between original and randomized catalogs. F-values were assessed using MDs calculated in 50 data windows shifted by one data set.
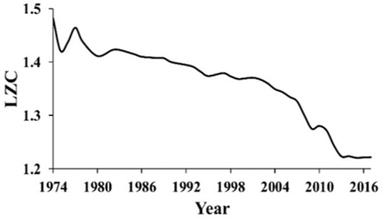
According to Figures 11 and 12 the most ordered period is 1999–2014, i.e., the MD fixes the synchronization of seismicity several years later than RQA and LZ—possibly, due to the difference in methodology: the MD is based on the synchronization analysis of all the three EQ parameters (cumulative times of earthquake occurrences, distances, and seismic energies). This is distinct from the above RQA and LZ analysis, which explore only EQ waiting times’ data, which seem to be synchronized with WL rhythm much easier than magnitudes and distances.
There is some connection between the EQ waiting times’ regime (Figures 11–13) and fault zone dynamics’ rate FZDR (Figure 7, Table 2). Generally, there are three main periods in both these data sets: initial (weak regularity in seismicity and constant velocity of the fault strain), intermediate (disordered seismic regime and the decoration of the linear FZDR by the irregular process of lake filling) and stable (ordered seismic regime and quasi-periodic WL variation). It seems that the ordering process of seismicity (1998–2004) lag behind the fault strain synchronization by water load (1980–1982), i.e. by approximately 20 years.
4.5 Module DAMTOOL
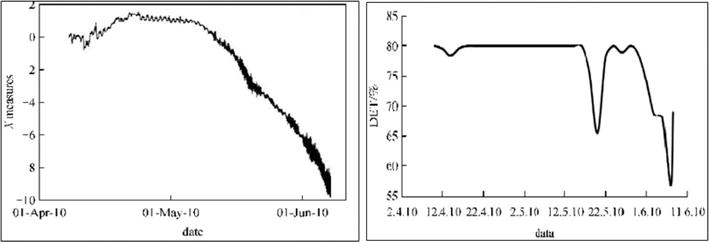
For the short-term visual control, processing and nonlinear analysis of monitoring data (say, tilt/strain time series) of engineering constructions the module DAMTOOL was developed. Figure 14 demonstrates the potential of the nonlinear dynamics approach to the analysis of tilt time series from April 2010 to June 2010. The figure shows the results of calculations by the DAMTOOL package of RQA percent of determinism or RQA %DET. Deviations from the normal behavior in the mid-May and June are evident. Note the high values of %DET during the regular regime in April and first decade of May (which points to the stability of monitoring data) and strong deviations due to geotechnical impacts at the time intervals: 12.05–22.05.2010 and 01.06–11.06.2010, connected with a discharge of water through the dam outlet. This means that construction damage as well as usual geotechnical procedures and geological processes in the dam neighborhood can induce anomalies in the monitoring results. Consequently, it is necessary to keep the minutes of routine geotechnical procedures in order to single out the signatures of hazardous construction damage.
Figure 14.
Results of calculations by DAMTOOL using recurrence quantification analysis (RQA %DET) for the tilt time series from April 2010 to June 2010. Left—original tilt time series; right: RQA%DET (% of determinism) for the same time series. Note high values of DET during a regular regime, which points to a highly correlated regime as well as strong deviations due to geotechnical impact—addition of high-frequency component due to the intensive discharge of water through the dam outlet in two time intervals (12.05–22.05.2010 and 01.06–11.06.2010).
The data obtained by the automatic real-time telemetric system of dam diagnostics at the Enguri dam show interesting long- and short-term patterns of tilts/strain dynamics in the dam body. For example, at the highest level (475 m), the maximal displacements of the side sections are larger than critical admissible values (CAVs) by 8–13 mm. This points to the necessity of a new analysis of CAV. Detail observations discover some new facts of dam behavior, including tilt hysteresis during annual loading-unloading cycle, low-frequency dam oscillations, etc., which can be used for dam diagnostics. The possible interpretation of hysteresis phenomena by mesoelasticity (nonlinear elasticity) and thermoelasticity models is considered.
The strain history of the fault zone under the dam during almost half-century documents a persistent extension of fault faces, up to 7500 μm during the observation period as well as dramatic changes in its dynamics with time from 250 to 44 μ/year in the past 20 years.
The nonlinear analysis of tilts/strains time-series data can be used to detect changes in the dam dynamics/stability. The strains of the fault under the dam (FZE) manifest relatively high level of determinism demonstrated by quasi-periodic variations in time due to seasonal load-unload cycle. The FZE is retarded relative to WL maxima by 200 days, which means that the hydraulic diffusivity D of rocks in the fault zone D≈ 5×10 m2/s.
The authors find three different stages in the nonlinear dynamics of both the strain and seismicity time series: i. before dam erection; ii. during dam construction; and iii. during regular exploitation with characteristic nonlinear dynamics. The start of the ordering process of seismicity (1998–2004) lags behind the fault strain synchronization by water load (1980–1982) by approximately 20 years.
The strains/tilts of the Enguri dam structure as well as that 0f the fault zone under dam reveal complicated dynamics on various time-space scales. Understanding the sources of changes in the FZ dynamics is important for decision makers, who should decide whether the observed data are normal for the routine dynamics of construction or they reveal anomalies, signaling on developing dangerous processes.
This work was supported by Shota Rustaveli National Science Foundation (SRNSF), grant FR-19-25231 “New fundamental approaches to assessment of geo-hazards of large hydropower dams/reservoirs: the case of Enguri High Arch Dam Area” and #216732, 2017, as well as by the Council of Europe grant Ref No: GN2019/10; FIMSPO No: 618410 2018-2019.
References
1.Chelidze T, Matcharashvili T, Abashidze V, Kalabegishvili M, Zhukova N, Meparidze E. Real telemetric monitoring system of large dams and methods for analysis of dam dynamics. Journal of Georgian Geophysical Society. 2011-2012;15A:49-66
2.Perner F, Obernhuber P. Analysis of arch dam deformations. Frontiers of Architecture and Civil Engineering in China. 2010;4(1):102-108. DOI: 10.1007/s11709-010-0012-7
3.Tibaldi A, Alania V, Bonali FL, et al. Active inversion tectonics, simple shear folding and back-thrusting at Rioni Basin. Georgia. Journal of Structural Geology. 2017;96:35-53
4.Chelidze T, Matcharashvili T, Abashidze V, Kalabegishvili M, Zhukova N. Real time monitoring for analysis of dam stability: Potential of nonlinear elasticity and nonlinear dynamics approaches. Frontiers of Structural and Civil Engineering. 2013;7(2):188-205. DOI: 10.1007/s11709-013-0199-5
5.Hill R. A self-consistent mechanics of composite materials. Journal of the Mechanics and Physics of Solids. 1965;13(4):213-222
6.Chelidze T, Yu K, Matcharashvili T. Seismological criticality concept and percolation model of fracture. Geophysical Journal International. 2006;164(1):125-136
7.Emukhvari N, Bronshtein V. Inguri HPP—System of Allowable and Limiting Parameters of Arch Dam State for Operative Control of its Safety During Exploitation. Moscow-Tbilisi: Ministry of Energy USSR; 1991
8.Guyer R, Johnson P. Nonlinear Mesoscopic Elasticity. Weinheim, Germany: Wiley-VCH; 2009
9.Chelidze T, Matcharashvili T, Abashidze V, Tsaguria T, Dovgal N, Zhukova N. Complex dynamics of fault zone deformation under large dam at various time scales. Geomechanics and Geophysics for Geo-Energy and Geo-Resources. 2019;5(4):437-455. DOI: 10.1007/s40948-019-00122-3
10.Sprott JS. Chaos and Time Series Analysis. Oxford: Oxford University Press; 2006
11.Strogatz S. Nonlinear Dynamics and Chaos. Boulder, Colorado, United States: Westreview Press; 2000
12.Chen Z, Ivanov P, Hu K, Stanley E. Effect of nonstationarities on detrended fluctuation analysis. Physical Review E. 2002;65:041107. DOI: 10.1103/PhysRevE.65.041107
13.Webber C, Marwan N. Recurrence Quantification Analysis. Heidelberg: Springer; 2015
14.Zbilut JP, Webber CL. Embeddings and delays as derived from quantification of recurrence plots. Physics Letters A. 1992;171:199-203
15.Hu J, Gao J. Analysis of biomedical signals by the Lempel-Ziv complexity: The effect of finite data size. IEEE Transactions on Biomedical Engineering. 2006;53:2606-2609
16.Li W. Mutual information functions versus correlation functions. Journal of Statistical Physics. 1990;60:823-837
17.Press W, Teukolsky S, Vetterling W, Flannery B. Numerical Recipes: The Art of Scientific Computing. 3-rd ed. New York: Cambridge University Press; 2007
18.Vautard R, Yiou P, Ghi M. Singular-spectrum analysis: A toolkit for short, noisy, chaotic signals. Physica D: Nonlinear Phenomena. 1992;58:95-126
20.Ishimura K, Sakurai S. Effects of window length when smoothing with singular spectrum analysis technique in running data. In: Proceedings of 30th Annual Conference of Biomechanics in Sports. Melbourne: ISBS; 2012
21.Roy S, Rana D. Machine Learning in Nonlinear Dynamical Systems. Berlin, Germany: Springer; 2021 arXiv: 2008.13496v2
22.Mata J et al. Validation of machine learning models for structural dam behaviour interpretation and prediction. Water. 2021;13:2717. DOI: 10.3390/w13192717
23.Matcharashvili T, Czechowski Z, Chelidze T, Zhukova N. Changes in the dynamics of seismic process observed in the fixed time windows; case study for southern California 1980-2020. Physics of the Earth and Planetary Interiors. 2021;319:45-65. DOI: 10.1016/j.pepi.2021. 106783
24.Chelidze T, Matcharashvili T. Dynamical patterns in seismology. In: Webber C, Marwan N, editors. Recurrence Quantification Analysis: Theory and Best Practices. Cham: Springer; 2015. pp. 291-335
25.Chelidze T, Matcharashvili T, Gogiashvili J, et al. Nonlinear analysis of magnitude and interevent time interval sequences for earthquakes of Caucasian region. Nonlinear Processes in Geophysics. 2005;7:9-19
26.Matcharashvili T, Chelidze T, Abashidze V, et al. Changes in dynamics of seismic processes around Enguri high dam reservoir induced by periodic variation of water level. In: Geoplanet: Earth and Planetary Sciences, Synchronization and Triggereing from Fracture to Earthquake Processes. V. de Rubeis et al. Berlin, Germany: Springer. 2010. pp. 273-286.
27.Peinke J, Matcharashvili T, Chelidze T. Influence of periodic variations in water level on regional seismic activity around a large reservoir. Physics of the Earth and Planetary Interiors. 2006;156(1-2):130-142
28.Matcharashvili T, Chelidze T, Peinke J. Increase of order in seismic processes around large reservoir induced by water level periodic variation. Nonlinear Dynamics. 2008;51:399-407
29.Telesca L, Matcharasvili T, Chelidze T, Zhukova N. Relationship between seismicity and water level in the Enguri high dam area (Georgia) using the singular spectrum analysis. Natural Hazards and Earth System Sciences. 2012;12:2479-2485
30.Telesca L, Chelidze T. Visibility graph analysis of seismicity around Enguri high arch dam, Caucasus. Bulletin of the Seismological Society of America. 2018;108(5B):3141-3147
31.Biot M. Mechanics of deformation and acoustic propagation in porous media. Journal of Applied Physics. 1962;33(4):1482-1498
32.Shapiro S et al. Characterization of fluid transport properties of reservoirs using induced microseismicity. Geophysics. 2002;67(1):212-220
33.Wang C-Y, Manga M. Earthquakes and Water. Heidelberg: Springer; 2010
34.Pacheco F. Hydraulic diffusivity and macrodispersivity calculations embedded in a geographic information system. Hydrological Sciences Journal. 2013;58:930-944
35.Bender B, Perkins D. A Seisrisk III: A computer program for seismic Hazard estimation. US Geological Survey Bulletin 1987; 1772. pp. 1-56
36.Smit P, Arzumanian V, Javakhishvili Z, Arefiev S, Mayer-Rosa D, Balassanian S, et al. The digital accelerograph network in the caucasus. In: The Earthquake Hazard and Seismic Risk Reduction. Netherlands: Kluwer AP; 2000. pp. 85-88
37.Javakhishvili Z. Seismic hazard and seismicity of Enguri Hydroelectric station area. In: Balavadze B, editor. Geodynamical Studies of Large Dams. Tbilisi, Georgia: Bakur Sulakauri PH; 2002. pp. 88-96
38.Chelidze T, Matcharashvili T, Abashidze V, Dovgal N, Mepharidze E, Chelidze L. Time series analysis of fault strain accumulation around large dams: The case of Enguri dam, greater Caucasus. In: Bonali FL et al., editors. Building Knowledge for Geohazard Assessment and Management in the Caucasus and Other Orogenic Regions. Berlin/Heidelberg, Germany: Springer; 2020. pp. 185-205
39.Foulger G, Miles P, Wilson M. Global review of human-induced earthquakes. Earth-Science Reviews. 2017;178:438-514. DOI: 10.1016/j.earscirev.2017.07.008
40.Gupta HK. Reservoir-Induced Earthquakes. Elsevier: Amsterdam, The Netherlands; 1992
41.Pikovsky A, Rosenblum M, Kurths J. Synchronization: Universal Concept in Nonlinear Science. Cambridge: Cambridge University Press; 2003
 Open access peer-reviewed chapter