Open Access is an initiative that aims to make scientific research freely available to all. To date our community has made over 100 million downloads. It’s based on principles of collaboration, unobstructed discovery, and, most importantly, scientific progression. As PhD students, we found it difficult to access the research we needed, so we decided to create a new Open Access publisher that levels the playing field for scientists across the world. How? By making research easy to access, and puts the academic needs of the researchers before the business interests of publishers.
We are a community of more than 103,000 authors and editors from 3,291 institutions spanning 160 countries, including Nobel Prize winners and some of the world’s most-cited researchers. Publishing on IntechOpen allows authors to earn citations and find new collaborators, meaning more people see your work not only from your own field of study, but from other related fields too.
Study of the Application of Terrestrial Laser Scanning for Identification of Pathologies in Concrete Structures
Written By
Sérgio Orlando Antoun Netto, Lucas Pires Chagas Ferreira de Carvalho, Ana Waldila de Queiroz Ramiro Reis, Leonardo Vieira Barbalho and Lucas de Campos Rodrigues
Submitted: 09 December 2022Reviewed: 19 December 2022Published: 17 March 2023
To purchase hard copies of this book, please contact the representative in India:
CBS Publishers & Distributors Pvt. Ltd.
www.cbspd.com
|
customercare@cbspd.com
Laser scanning enhances classic field surveys. It is a remote, active, noninvasive, nondestructive, and high-precision technique to capture reality that records from thousands to millions of points per second in a detailed representation of the situation called a point cloud. The surveys are performed along the object of interest in a process called scanning, which has as its gross product a dense cloud of three-dimensional points of the scanned object. This point cloud stores information about the object’s geometry, return pulse intensity, and point color data. As a way of extending the uses of terrestrial laser scanning, this work studies the application of this method in civil engineering, through the identification of pathologies in reinforced concrete structures, aiming to show how geoinformation can be employed in this area. To this end, a case study of the São Cristóvão Viaduct was conducted in the city of Rio de Janeiro. This study included a definition of the site of analysis; planning and execution of the field survey to collect raw data; processing of the point cloud; and generation of a three-dimensional surface for global visualization of the structure and identification of pathological manifestations and the regions where they were observed.
Engineering Faculty, Department of Cartography, State University of Rio de Janeiro, Rio de Janeiro, Brazil
Lucas Pires Chagas Ferreira de Carvalho
Engineering Faculty, Department of Cartography, State University of Rio de Janeiro, Rio de Janeiro, Brazil
Ana Waldila de Queiroz Ramiro Reis
Engineering Faculty, Department of Civil, State University of Rio de Janeiro, Rio de Janeiro, Brazil
Leonardo Vieira Barbalho
Engineering Faculty, Department of Cartography, State University of Rio de Janeiro, Rio de Janeiro, Brazil
Lucas de Campos Rodrigues
Engineering Faculty, Department of Cartography, State University of Rio de Janeiro, Rio de Janeiro, Brazil
*Address all correspondence to: sergioantoun@gmail.com
1. Introduction
The technology using laser scanners is an improvement for field surveys. In classical topography survey, using angles and displacements in three-dimensional surveys, the final objective is to determine coordinate points. Initially, terrestrial surveys used theodolites and the technique was efficient when introducing electronic measurements of displacement and directions. The integration between both techniques led to total stations, employing reflective prisms to determine three-dimensional coordinate points on terrestrial surfaces. Subsequently, the evolution of laser measurement allowed finding three-dimensional coordinate points without prisms. These points are calculated remotely, which is useful mainly in places with difficult access or risk to the operator’s safety. These factors led to the development of robotic total stations, where coordinates can be measured without operators [1].
In this context, terrestrial laser scanning (TLS) was developed for remote sensing to measure displacements and determine coordinate points without prisms or contact with the object of interest. These measurements are not made at a specific point, but over the entire object, in a process called scanning. The results are three-dimensional “point clouds” (x, y, z) of the object. Besides that, the devices can register the pulse’s intensity when it returns to the lens, and those with digital cameras integrated can register the color of points, which results in spectral information for each point [1, 2].
This characteristic makes TLS a versatile technique, with various applications, such as engineering, architecture, and geology. Besides that, the equipment has high data acquisition rates (thousands or millions of points per second), which can provide high agility at construction sites. This is a noninvasive and nondestructive technique, where there is no contact between the equipment and the object of analysis [2].
As a way of extending the use of terrestrial laser scanning, this work presents an application of TLS in civil engineering, specifically to identify pathologies in reinforced concrete structures. For this, we performed a study of the São Cristóvão Viaduct, in the north zone of the city of Rio de Janeiro.
The data gathered were transformed into a “point cloud,” for visualization of the structure and identification of pathologies.
Reinforced concrete structures in general develop pathologies due to external factors, such as weather and human actions. In Brazil, analysis of the structural integrity of concrete structures is deficient, leading to precarious conservation due to the failure to detect pathologies and avoiding disasters such as building collapses. In this context, the use of TLS for semi-automatic detection and classification of pathologies can be a relevant advance to prevent disasters.
So, the general objective of this work is to study the applicability of terrestrial laser scanning for identification of pathologies in reinforced concrete structures, to demonstrate how remote sensing can be used in civil engineering in complementation with visual inspection to improve detection of pathologies and thus conservation of structures.
This chapter is divided into five more sections. The second presents the theoretical grounds of terrestrial laser scanning, with a brief history of remote sensing and information about the devices, their manufacturers, and specifications, concluding with the main applications presented in the literature.
Section 3 provides theoretical aspects of reinforced concrete structures, a brief history of concrete materials and their composition, and main characteristics and their structural behavior. This is complemented by the main characteristics of steel and the relevant Brazilian standards, followed by introduction of the degradation process and pathologies found in concrete structures.
Section 4 presents a case study of São Cristóvão Viaduct in the city of Rio de Janeiro city. This includes the description of the main structural characteristics and the equipment employed, the data obtained, and their processing.
Section 5 presents the results obtained from processing the data gathered by the terrestrial laser scanner to identify pathologies.
Finally, the work concludes with discussion about laser scanning’s future applicability and suggestions for future research.
There are several ways to conceptualize remote sensing. This can be defined as a technique that uses sensors to capture and record at a distance, without direct contact between the sensor and the object, the energy reflected or absorbed by features of interest on the Earth’s surface [3]. Florenzano [4] defined remote sensing as the technology that allows acquisition of images and other types of data from a given surface by capturing and recording the energy reflected or emitted by it. This energy is electromagnetic radiation (REM), measured in frequency and wavelength.
In this work, the studied remote sensing technique is known as LIDAR (Light Detection and Ranging). This technique is similar to radar (Radio Detection and Ranging), the difference being that it uses laser beams instead of radio waves to detect and map objects [5]. LIDAR is a technology that uses active remote sensing equipment, which emits electromagnetic radiation to the object of interest and measures the radiation that is reflected to a receiver after interacting with the Earth’s atmosphere or objects [6]. This technology has been perfected from the fundamentals of remote sensing [7].
LIDAR sensors can operate in the visible and middle infrared ranges of the electromagnetic spectrum. For cartographic purposes, the technology can be used from the ground or airborne platforms [8]. According to Longley et al. [6], terrestrial laser scanners can also operate in the ultraviolet range.
2.2 Fundamentals of terrestrial laser scanning
As mentioned, laser scanning is a remote and active technique of high-precision reality capture that records multiple data simultaneously, in a detailed representation of the object of interest, called a point cloud. It is considered a remote method because there is no contact between the operator and the object of interest. The ability of the scanner to generate its own electromagnetic radiation makes it an active system. According to Bordin [9], the ground laser scanner is based on the stimulated emission of radiation, and its light beam is of the laser type.
Laser devices (from Light Amplification by Stimulated Emission of Radiation) were invented in 1960 by Theodore H. Maiman, from two events in the twentieth century. According to Brandalize [10], Albert Einstein, in an article published in 1917, suggested the stimulated emission of light radiation (atoms of light sources) for the emission of photons, which made possible the creation of amplifiers and oscillators. In 1954, MASER (Microwave Amplification by Stimulated Emission of Radiation) was invented as a result of research with radar during World War II. These events made possible the appearance, among other devices, of the laser scanner, with help from the development of computing.
Laser scanning has been applied in several areas of knowledge, especially in engineering, through geodetic and topographic sciences, among others [7]. In general, this term describes any type of technology that measures distances repeatedly and accurately (through time measurement). These measurements are grouped in a point cloud based on the calculated coordinates of each point.
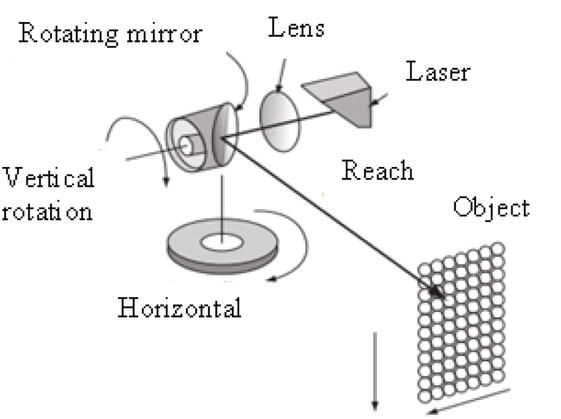
The laser scanner is a remote sensing device used to measure the distance between the sensor and the surface of objects. Its operation is based on the use of laser beams that are emitted toward the targets ([11] cited in [7]). These beams are directed to the environment with the aid of a mirror, or prism, and a motor that generates the horizontal rotation around the vertical axis of the instrument [12], as shown in Figure 1.
Figure 1.
Projection of laser beams to the object, from the mirror (adapted from [12]).
In addition to the vertical movement generated by mirrors or prisms, controlled horizontal movement is also required, usually implemented through the use of a motor, allowing a series of profiling around the vertical axis of the instrument [12], as illustrated in Figure 1.
During a scan, each laser pulse projects a circle (or an ellipse, depending on the beam’s angle of incidence) onto the target, called the instantaneous coverage area. The diameter of this circle, or the average of the minor and major axis of the ellipse, depends on the divergence of the emitted pulse. The divergence is the physical characteristic of the laser diffusion as it spreads. In the case of the laser, this diffusion is smaller than the case of a light beam or radio wave, so that it is a projection on the target has small dimensions, even at high distances between the sensor/emitter and the target, and can be adjusted by means of optical elements in the equipment. The return signal depends on the energy dispersion of the incident pulse within the area where the pulse projects onto the target [10].
The beams that reach the object of interest interact with their surfaces. This interaction varies according to the features of the object. Different features generate different returns, according to the shape, dimensions, and constituent material. In this way, each pulse can generate a return or multiple returns [8].
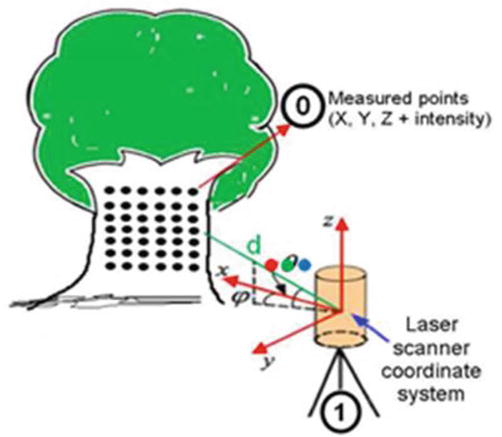
At the end of a scan, for each point collected, the laser scanner registers three-dimensional (X, Y, Z) coordinates, oriented to the phase center of the device (horizontal and vertical axis intersection). In addition, the return signal strength of each point on the surface scanned by the laser is also computed. This return pulse intensity indicates voltage peaks of the signals that are reflected by the objects, recorded by the equipment. In this way, the intensity is a measurement of the number of photons (energy) that is captured by the sensor. It depends on the type of material that composes the object and is affected by three parameters: the distance to the object, its reflectance, and the angle of incidence of the emitted pulse. Therefore, the quality of the reflected pulses depends directly on the range quality of the emitted pulses [8].
From the registered intensity information, the terrestrial laser scanner (TLS) is able to identify efflorescence, humidity, and biodeterioration of structures, among other pathologies. It is also possible to monitor the evolution of these pathological manifestations throughout the life of the structure [8]. Some devices also have an integrated digital camera. With the help of this, it is possible to associate color information, RGB, to each point of the cloud [9]. Figure 2 below illustrates data collection.
Figure 2.
Data collection with terrestrial laser scanning [9].
Thus, the point cloud is a dense representation of points in three space, forming a 3D image of the scanned structure [1, 13]. Laser scanner equipment is capable of capturing from hundreds of thousands to millions of points per second, with high accuracy and at a high acquisition rate [14]. The resolution of the point cloud, which defines the total amount and the distance between the points, i.e., the point density, can be configured by the operator before scanning. This parameter depends on the size of the smallest element to be lifted and the distance to the object [15].
Currently, some of the main manufacturers of ground laser scanners are Faro (United States), Leica (Switzerland), Riegl (Austria), Topcon (Japan), Trimble (United States), and Velodyne (United States). These companies, as well as others in the geotechnology and terrestrial survey sector, usually provide solution packages for scanning according to the buyer’s design. In addition to the TLS equipment, the necessary software for processing the data collected in the field is available, as well as technical support, as shown in Table 1.
Manufacturer
Model
Reach
Acquisition Rate (pps)
Accuracy
Field of View (h x v)
Camera (MP)
Faro
FocusS 350
350 m
976.000
1 mm
360° x 300°
165
Leica
RTC360
130 m
2.000.000
2.9 mm-20 m
360° x 300°
36/432
Riegl
VZ-6000
6000 m
222.000
3.5 mm-25 m
360° x 60°
5
Topcon
GLS-2000 L
500 m
120.000
4 mm-20 m
360° x 270°
5
Trimble
SX10
600 m
26.600
14 mm-100 m
360° x 300°
5
Velodyne
HDL-64E
120 m
2.200.000
2 cm
360° x 26.9°
—
Table 1.
Main features of some scanners.
In short, the main advantages of using terrestrial scanners are the speed of operation, the high precision of the generated point cloud, and the fact that the laser is not harmful to the health of the operator, especially skin and eyes. It is also possible to reach areas that are difficult to access, because it has a long range. Finally, there is the possibility of integration with GNSS systems, so that the points in the cloud can be georeferenced.
The main disadvantages are that the acquisition cost of equipment and software is still high, although the solutions currently in the market are robust and efficient. The cloud of points generated, given the high amount of information contained in it, demands high computational and graphical processing capacity, requiring the use of good processors and video cards. According to Ferraz et al. [8], external factors such as the temperature of the environment and the object to be scanned, pressure, and humidity can influence the measurements, since they affect the refraction index of the laser, changing its wavelength.
The main barriers this technology faces are the insecurity about the use of 3D environments and the insertion of this method in the traditional flow of data processing. There is still a feeling that because it is a three-dimensional cloud, the learning curve will be long. In some countries, there is little know-how of the applications and advantages of this technology.
2.3 Main applications
In recent years, several applications of Terrestrial Laser Scanning (TLS) and the point cloud generated from it have been studied by countless authors, aided in large part by the intense technological development of the last two decades. Among the application areas of TLS, they stand out in engineering and architecture, infrastructure, industry, mining and geology, archeology, ecology, and medicine and in the forensic and agricultural sectors. In engineering and architecture, the generation of as-built 2D plans, interior design, 3D modeling and integration with BIM (Building Information Modeling) technology [16], structure monitoring [17] and interventions in existing structures.
As mentioned in Refs. [2, 18], the laser scanner is used in the dimensional and structural analysis of a Spanish bridge. Pesci et al. [19] analyzed deformations and deviations of structures from TLS data. González-Jorge et al. [13] used the terrestrial laser scanning to detect the presence of biofilm and moss proliferation in reinforced concrete structures.
Teza et al. [20] developed a computational method to identify surface damage caused by loss of mass in reinforced concrete structures. Rabah et al. [21] used the TLS to detect and automatically map cracks in concrete surfaces. Brandão [22] studied its application to buildings.
In topography, it has great utility in planialtimetric topographic surveys, calculation of volumes, maps and generation of topographic profiles, and Digital Elevation Models—DEM [23].
In this case, the objective was to determine areas at risk of flooding in the urban zone. Wutke [1] mentions application in geotechnics and geophysical modeling and also mentions studies in reverse engineering, prototyping, aeronautical, vehicles, vessels, and large objects in general modeling. It is also used in the documentation of industrial plants, in mining, with calculation of ore volume, in studies of natural risks, and in verification of underbreak and overbreak during tunnel excavation [24]. Fekete et al. [25] used the TLS to scan tunnels in the process of excavation and drilling. There are also studies on the documentation and preservation of historical heritage [19, 26, 27]. In the forensic sector [28], it is used to reconstruct crime scenes.
According to Giongo et al. [5], the TLS can be used in coastal planning, flood risk assessment, telecommunications, and energy transmission networks. It is also possible to use it in agriculture [29], mining [30], mineralogy [31], and vegetation studies [32]. In medicine, Dalmolin and Santos [33] mentioned the design and manufacture of prostheses and comparative studies of volume and surface textures before and after surgeries.
Mugnai et al. [27] presented a research study designed to assess the health status of a medieval bridge built on 1500 under the Medici dynasty over the river Sieve, close to Florence, using TLS to identify anomalies and deformations. Marzouk et al. [26] proposed a framework with TLS data and BIM models in order to overcome the weaknesses of the traditional methods in Egyptian Heritage called Tosson Palace. Takhirov et al. [34] used the high-definition laser scanning technology in an extensive structural assessment of historic monuments in Uzbekistan.
Shafikani et al. [35] showed an application of TLS technology for assessing the performance of bridge infrastructures, including highway embankments, bridge decks, approach slabs, abutments, and columns supported on drilled shafts. This application also studied the ground movements. Cha et al. [36] introduced a practical feasibility study of a shape information model to monitor deformation or deflection of bridge structures using TLS. Finally, Carvalho et al. [37] presented a case study of the application of the terrestrial laser scanning in the identification of structural pathologies in a viaduct.
Armesto et al. [38] developed a methodology using TLS to estimate the deformation of arches or vaults based on the symmetry of sections obtained along the vault guideline. TLS technology applied to register as-built projects can be found in Refs. [39, 40, 41]. Armesto-González et al. [42] presented a methodology to combine the technology of the terrestrial laser scanner with the techniques of digital image processing in order to study damages on stony materials that constitute historical buildings.
In addition to the Civil Engineering field, there are several other applications of TLS technology as described below among others:
architectural restoration of iconic buildings, such as the Glass House, built in the 1950s, as well as the MASP Structure Conservation Plan, both in the city of São Paulo;
documentation and renovation of the Malé Hukuru Miskiy, located at Malé city in the Republic of Maldives;
based on the fire that almost destroyed Notre Dame Cathedral in Paris a lot of other Museums, Heritages, Opera Houses, and other iconic buildings are investing in this scope of work.
volumetric measurement of chemicals products in storage sheds;
elaboration of three-dimensional electronic model and architectural plans on a large-scale map;
planialtimetric mine survey for mining planning and track of tunnels; and
new experiences and services for the real estate market: accurate floorplans for customers to know exactly what they are paying for.
3.1 Composition and characteristics of reinforced concrete
A mixture of cement and water is called a paste, while mortar is a mixture of paste with a fine aggregates. Simple concrete is defined as mortar to which a large number of aggregates have been added, i.e., fine and coarse aggregates [43]. When mixed, the constituent elements of the concrete, still fresh, form an alloy of plastic consistency that can be molded into various forms, serving various purposes. This explains its wide dissemination and use as construction material. The forms that ensure its final shape after hardening can be of wood or steel, with the latter being much more common nowadays [44].
The initial plasticity of the concrete is of fundamental importance for the handling, transport, and pouring in the forms. After curing, it acquires consistency and cohesion, due to the chemical reactions between the components mentioned above [43].
Simple concrete is an element formed by agglomerate (cement, composed of a mixture of limestone and clay, called clinker), water, small aggregate (sand), and large aggregate (gravel or stone). Additionally, additives can be used, among them accelerators and hardening retarders, plasticizers and superplasticizers, viscosity modifiers, air incorporators, and colorants, which aim to change the concrete’s characteristics according to the use and purpose foreseen in the project [45]. Cement, the main material used in the mixture, can also contain additions to it is basic composition, such as fly ash, pozzolan, and active silica. Poor quality of the materials that make up the concrete can negatively influence its properties [2].
The main advantages of the use of concrete are that the constituent materials are economically accessible and abundant, especially in Brazil, and the facility of molding and assembly. In addition, it has high resistance to fire, stability under the action of weather, and resistance to shocks and vibrations. However, some of the main disadvantages are the high weight (approximately 2.5 metric tons per cubic meter), the low thermal and sound protection, the development of cracks, and the requirement for constructive rigor and support apparatus, such as shoring, thickening, and curing processes [46].
The association of simple concrete with steel bars, forming reinforced concrete, occurs because while concrete presents high compression resistance, steel has high tensile resistance [2]. According to Gonçalves [47], reinforced concrete is composed of simple concrete, steel reinforcement, and a component to assure good adhesion between these two materials.
The use of concrete with steel is only possible due to the joint work between these two materials, given by the adherence between them. Additionally, its dilation coefficients are similar, so the behavior of concrete under temperature variations is compatible with that of steel. In addition, concrete acts as a double barrier for steel, physically and chemically. On the one hand, the concrete separates and protects the steel from the external environment through the covering layer. On the other hand, the concrete protects the steel against oxidation, through an alkaline environment formed during the handling period of the concrete. This chemically inhibiting layer is called a passive film. The aqueous solution consists mainly of hydroxyl ions (OH-), which causes the high alkalinity of concrete [48, 49].
The Brazilian Standard (NBR) 6118, the main Brazilian reference for the design of concrete structures, defines reinforced concrete structures as those whose structural behavior is conditioned by the adherence between concrete and reinforcement. In this type of structure, initial elongations of reinforcement are not applied before the materialization of this adherence [50, 51, 52].
3.2 Pathologies in concrete structures
The fast development of civil construction to meet a growing demand for buildings of various types has promoted a great scientific and technological leap. But many structures show unsatisfactory performance due to aspects such as involuntary failures, imperfections, misuse of materials, natural aging and errors in designs, and execution [53].
The study of pathologies of concrete structures and construction in general has been growing in recent years. Many people believed that concrete structures would be eternal, requiring no maintenance or intervention, even when built without specific care and exposed to aggressive environments. However, several cases of degradation and collapse, sometimes early, occurred from the 1980s on, which exposed the risks to safety and caused high maintenance costs, promoted a change in this perspective, with an understanding of the importance of preventing degradation and performing preventive and corrective maintenance [54, 55, 56].
Materials for construction are subject to natural wear and aging processes, usually accelerated by environmental factors. Several agents are responsible for the uninterrupted degradation of concrete structures [57]. Ideally, this happens at a predictable rate, so that the structure maintains its functional capacity during its useful life. In cases where deterioration occurs at higher rates than predicted, intervention in the structure may be necessary [58].
Thus, the action of the environment together with failures of design, execution, and/or maintenance leads to the appearance of pathological manifestations in structures. The pathologies are the main problems that compromise the useful life of concrete structures [53].
In this work, with the objective of better presenting and conceptualizing the various types of structural pathologies, the classification defined by Pase [45] is used. According to this author, mechanical processes are related to pathologies caused by accidents, overloads, or impacts. Physical processes are freeze-thaw cycles, thermal stresses, deformations due to shrinkage, or creep and surface wear due to abrasion, erosion, and cavitation. Chemical processes are attacked by acids, sulfates, chlorides, alkali-aggregate reaction, and leaching. Electrochemical processes are carbonation and corrosion of steel. Finally, biological processes are those caused by vegetation growing on structures and within their cracks.
The process of treating pathological manifestations in concrete structures can be divided into three distinct phases. Initially, the pathologies that act on the structure are identified through visual inspections and tests on-site or in the laboratory (through the extraction of specimens). Then, a diagnosis of these pathologies is made, with the objective of determining their causes and mechanisms of action. Finally, from the information of the first two steps, an intervention program is defined, whose function is to specify the actions that must be taken to mitigate such pathologies. These actions include the choice of methods and materials to be used in the recovery of the structure. In some cases, depending on the type and degree of progress of the deterioration, it may also be necessary to perform structural reinforcement in order to reestablish the cross-sectional and resistance capacity.
This section presents and comments on the results of the evaluations of the normalized point cloud of the São Cristóvão Viaduct, as well as the three-dimensional model prepared from it and the classification made. Thus, the objective was to determine the possibility of identifying these pathologies through the point cloud and these products, shown below.
4.1 General characteristics of the structure studied
The structure chosen for analysis was the “Old” São Cristóvão Viaduct, located in the district of the same name in the northern zone of the city of Rio de Janeiro. The viaduct overpasses train and metro lines and is located next to the Oduvaldo Cozzi Viaduct.
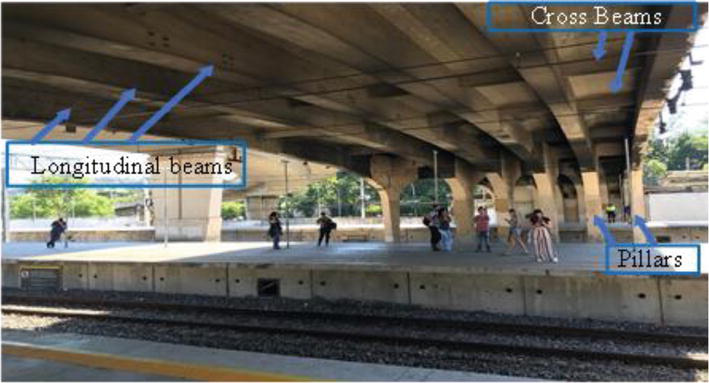
The viaduct is made of reinforced concrete. Its structural arrangement comprises a total of six longitudinal beams along its length. These beams receive the forces coming from the slab over which vehicles circulate. The structure is segmented into six spans, one on the side of the Maracanã district (access), one above the Rio Metro railway line (aboveground extension of the subway system), two above the Supervia railway line (metropolitan commuter trains), one above General Herculano Gomes Street, and one on the way down the viaduct, next to Quinta da Boa Vista Park. Each span is separated from the adjacent one by a transversal line of six pillars each, which bear the forces from the six longitudinal beams. Additionally, each span has five transversal beams (perpendicular to the longitudinal beams), which also receives loads from the slabs, as shown in Figure 3.
Figure 3.
Structural arrangement of São Cristóvão viaduct.
4.2 Field survey
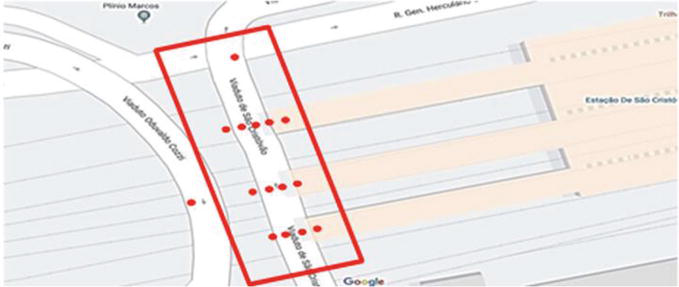
The survey took place on May 27, 2019, and lasted approximately 2 hours. According to the geometry of the viaduct structure, the positioning of the station platforms in relation to it, the fact that the station is extremely busy and the staff team of the concessionaire did not allow us to set up the equipment over the train lines for mapping, 14 equipment position points (setup points) were determined. Additionally, a fifteenth point was defined outside the station, on the sidewalk of General Herculano Gomes Street, in order to generate a point cloud in this region of the viaduct. Thus, the survey generated 15 scenes, as shown in Figure 4, that is, 15 different point clouds, one for each point where the device was positioned.
Figure 4.
Schematic representation of the 15 position points of the equipment (Google maps, 2019).
In this work, we chose to use the device with a medium acquisition rate. In this way, the taking of photographs in each scene lasted approximately 3 minutes. The scanning of each scene lasted approximately 4 minutes, totaling approximately 7 minutes for each position point. This configuration took place in this matter in order to acquire data from the segments between adjacent longitudinal beams, given that they were too close to each other.
4.3 Data processing
At the end of the first scan, the device was taken to the second position point. The scanning process was then repeated for all 15 points where the device was positioned.
Finally, with all the clouds generated, the raw data were processed in the university office. This can be done by any computer that has the minimum computational requirements defined by the equipment manufacturer. In this work, we used a computer with a 6-core processor, 12 MB cache, and maximum frequency of 3.8 GHz, along with a graphics card (GPU) of 1GB and 32 GB RAM.
The Leica Cyclone Register 360 software was used for the refinement and completion of the scenes. When the program was opened, a new project was created, and then, the 15 cloud files were imported. These files are native to the BLK 360 terrestrial laser scanner and have *.blk extension. This way, it was only possible to open them with the Leica proprietary software, from which they are exported to other formats. In this work, each cloud file had approximately 354 MB, totaling approximately 5.31 GB for the 15 files.
In this work, the results of the Register were an error of 0.006 meters, overlap of 44% between “clouds”, force of 67%. In this case, “cloud” by “cloud” was employed as the registration method.
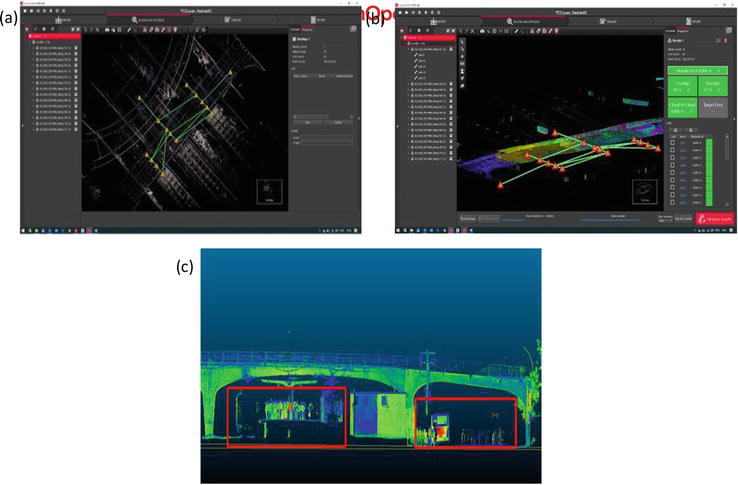
The scenes were then recorded between pairs of point clouds, as shown in Figure 3(a), where each green line indicates a connected and recorded pair. Each of these connections was called a link. For the 15 clouds in this project, 26 links were established.
After creating the 26 links, the process of recording point clouds was completed. From this, the software displayed the recording quality parameters: accuracy (bundle error), overlap, and strength, according to Figure 3(b), and issued a report of the process. At the end of the recording, the consolidated cloud was exported to the open format *.pts. The file was approximately 5.76 GB.
Thus, after all the scenes were recorded, the cloud was reduced so that it only contained points relative to the São Cristóvão Viaduct. This procedure was performed in the CloudCompare program (version 2.10.3 Zephyrus). This is free software for processing three-dimensional point clouds under the GNU General Public License. This reduction consisted of selecting the regions that did not correspond to the studied structure and eliminating them from the cloud, as can be seen in Figure 5(c), in red.
Figure 5.
Legend: (a) scene registration, (b) conclusion of the cloud recording process, (c) elimination of features in CloudCompare software.
4.4 Consolidated point cloud
After recording the clouds, a single consolidated cloud was obtained, which presented all the elements in the environment around the viaduct, captured by the terrestrial laser scanner during field work.
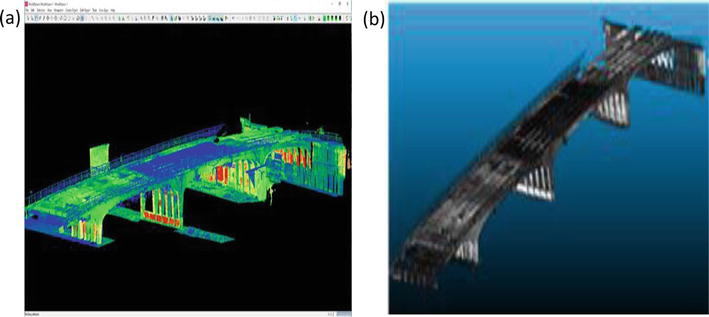
The consolidated cloud, as can be seen in Figure 6, although visually attractive, detailed, and rich in elements, presented a number of features far superior to the object of study. In this figure, it is possible to see that, besides the structure of the viaduct, data from the station platforms, the nearby Oduvaldo Cozzi Viaduct, as well as the nearby vegetation, passengers and the Supervia train cars themselves were also captured.
Figure 6.
Legend: (a) point cloud after recording and cleaning. (b) Normalized point cloud, in grayscale.
This section presents in greater detail the normalized point cloud and the three-dimensional surface generated for the São Cristóvão Viaduct, in order to identify structural pathologies. For this purpose, the viaduct was segmented into four sections defined according to the position of the pillar lines. For each section, the point cloud, the three-dimensional surface and photos of the corresponding region are shown, in order to establish a parallel between the visually identified pathologies and their representations in the products generated from the terrestrial laser scanner survey. This comparison aims to study the applicability of this technique for the identification and cataloging of pathological manifestations.
The pathologies identified in sections 1, 3, and 4 during this study are available from the corresponding author upon request. We present below the pathologies identified in Section 2.
Both the point cloud and three-dimensional surface present continuous behavior, mainly in relation to Section 1. This continuity can be explained by the location of more points for the survey of this section. It is possible to notice a lower occurrence of shadow regions, which stand out near the pillars. Shadows, although less frequent, were caused by the passage and constant stopping of trains during scans, also acting as a physical barrier to the integral capture of the structure of this stretch.
Failures can also be noticed in the external regions of the viaduct, notably at the edges and in the upper portion, near the slab. This behavior is explained by the positioning of the scanner during the scans. As the survey was done from the station platforms, and since the coverage of these platforms extended to the vicinity of the viaduct along the platforms, the field of view to the top of the viaduct was restricted. Also contributing to this failure is the fact that the coverage of the upper part of the viaduct slab was not part of the survey.
The pillars show good representation in the point cloud, given the fact they are located in a region closer to the scanner, thus being hit by the beams orthogonally. The bottom of the slab as well as the sides and bottom of the beams also have good representation in the cloud.
The three-dimensional surface is consistent with the point cloud, showing discontinuities in regions with less point density. Slight presence of noise also can be observed, more frequent in the upper part of the slab, where the open surface and the scarcity of points made the creation of triangular surfaces difficult.
The texture of the surface is uniform and consistent with the structure it represents, with good coverage of the slab and beams. The pillars have accurate representation, consistent with their geometry, including the application of colors to their surface. However, atypical roughness is observed in the external pillars of this section.
Some critical regions can be observed in this section, as seen in the details of the point cloud, Figure 7(a), (c), and (e), and the three-dimensional surface, Figure 5(b), (d), and (f). There are moisture stains along the edges of the slab, at the end of the viaduct, which is also explained by the fact that it is a region more subject to infiltration and percolation of water. These can be better observed in the normalized point cloud than in the three-dimensional surface, which can be explained by the difficulty in creating them. Moisture is also observed in some internal regions of the viaduct slab.
Figure 7.
Pathologies presents in the viaduct. (a), (c), and (e) Gray scalar; (b), (d), and (f) real color.
Analysis of the point cloud also shows the existence of slabs and beams in the regions of the structure with exposure of shallow reinforcement (rebar’s) on the concrete surface. With the gray scale coloration of the cloud, these regions can be more easily discerned.
Through analysis of the three-dimensional surface, although it is possible to verify the presence of moisture stains and rebar exposure, its identification cannot be done easily and in isolation. However, it is possible to identify the regions where biodeterioration has occurred.
In this section, the slab and beams of the viaduct are more affected, with greater presence of pathological manifestations than the pillars, which in general do not show structural deterioration.
Additionally, besides the analysis of the standardized point cloud and the three-dimensional surface generated from it, we also did a point cloud classification based on the intensity of the laser return combined with the shape of the structure surface. These classes were defined by using the plugin/algorithm “qCANUPO” from the CloudCompare software and selecting samples from the cloud itself and then applying them to the points in their entirety.
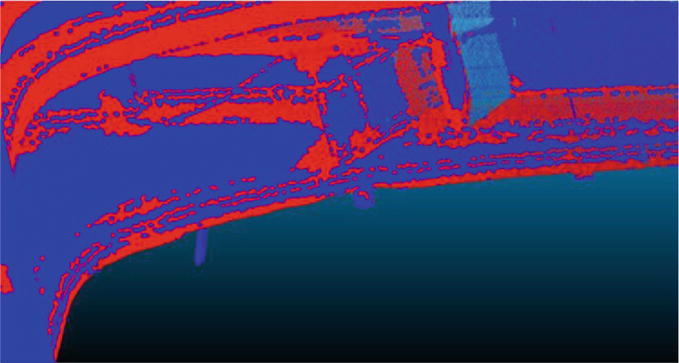
This classification aimed to propose a semi-automatic method for identifying structural pathologies from the point cloud. This method allows quicker field work, and it is especially helpful in situations where people cannot get access to the structure entirely. Since this is an initial study, for the cloud generated in this work, two classes were defined so it would be possible to differentiate parts of a viaduct, one for healthy regions, identified by the color red, and another for deteriorated regions, identified by blue, according to Figure 8.
Figure 8.
Classification of the cloud for part of section 2. Legend: healthy regions (color red) and deteriorated regions (color blue).
In future studies, it is recommended that the unhealthy class be split into more sub-categories, according to the pathologies found in the structure. This will allow a more assertive global analysis, enabling actions more targeted to each pathology to be taken. In addition, this more segmented analysis can also allow the correct quantification of the areas affected by each pathology.
Nowadays, bridge and viaduct inspections are performed visually using a camera. Thus, the presence of damage is not an accurate quantitative evaluation, depending exclusively on the inspector’s qualitative criteria, as well as productivity is low. The use of the TLS technique in the identification of pathological manifestations in bridges and viaducts can be incorporated into that inspection activity to complement the existing methodology.
The TLS is capable of detecting biodeterioration, humidity, cracks, and efflorescence, as well as allowing the viewing of dimensional changes and deformations in the order of centimeters. By enabling the visualization and scanning of a structure without direct contact with it, TLS would be an option for inspections of bridges and viaducts whose pillars, beams, and board were inaccessible to the inspector’s contact.
Terrestrial laser scanning (TLS) has application in several areas of knowledge, notably in engineering. Given the characteristics of the data that this equipment generates, forming a point cloud, it is possible to formulate several spatial products and perform qualitative and quantitative analysis. One application still relatively little explored is its use to identify pathologies in reinforced concrete structures. This is done by scanning the structure of interest and using the intensity and color data of the return pulse collected by the scanner to identify healthy and deteriorated regions. Thus, this work aimed to study the applicability of this equipment in civil engineering, to support maintenance programs of buildings and other structures.
Based on the bibliographic research of the theoretical bases that underpin TLS, its operating principles, characteristics, and application present in the literature, as well as concrete structures, their types, composition, and main degradation processes, it was possible to confirm the theoretical relation between the two themes. In order to deepen the study of this relation, we presented a case study of a viaduct made of reinforced concrete.
By analyzing each point cloud after the elimination of features, it was possible to observe good general representation of the viaduct structure and critical areas to be used for structural analysis. In some regions, however, especially in sections 1 and 4, significant discontinuities in the cloud and shadow regions, caused by the presence of physical barriers at the time of the survey, were noted. These barriers consisted of partition walls and the presence of moving trains, people, and vehicles during the scanning. Although this did not make the work impossible, such barriers and impediments resulted in areas with sparse data, so the overall analysis of the structure was impaired.
The use of the terrestrial laser scanning for the identification of structural pathologies is a clean alternative for monitoring and inspection of concrete structures. Compared to other existing approaches, it is a nondestructive and noninvasive method that where, besides not generating damage to the evaluated structure, does not produce any waste to be discarded in the environment and can guarantee a trustworthy result of the collected and processed data. Moreover, the most relevant characteristic of the technology is the great speed and quality in data collection. In general, this technique enables the evaluation of pathologies in the structure to be improved quantitatively and qualitatively. Thus, better evaluations result in more corrective maintenance and major repairs, with the benefit of an extended lifetime and greater safety.
All the authors are acknowledging to Rio de Janeiro Municipal Government, through its General Project Coordination Office (CGP), part of Municipal Department of Infrastructure and Housing (SMIH), to authorize the use of the viaduct for an object of analysis. Also, the authors acknowledge the Rio Metro railway line and Supervia railway line, to use the platform to install the terrestrial laser scanning.
This chapter has previously been published as a preprint: Netto SOA, de Carvalho LPCF, Reis AW de QR, Barbalho LV, Rodrigues L de C. Study of the Application of Terrestrial Laser Scanning for Identification of Pathologies in Concrete Structures [Internet]. Research Square Platform LLC; 2021. Available from: http://dx.doi.org/10.21203/rs.3.rs-1001215/v1
References
1.Wutke JD. Métodos para avaliação de um Sistema laser scanner terrestre. Curitiba: 86 f. Dissertação (Mestrado) - Curso de Pós-Graduação em Ciências Geodésicas, Departamento de Geomática, Universidade Federal do Paraná; 2006
2.Pavi S, Bordin F, Veronéz MR. O potencial do uso do laser scanner terrestre para a identificação de manifestações patológicas em obras de arte especiais: uma revisão bibliográfica. X Congreso Internacional sobre Patologia y Recuperación de Estruturas - CINPAR, Santiago de Chile, Anais…Santiago de Chile; 2014. pp. 1-15
3.Fitz PR. Cartografia básica. 2nd ed. São Paulo: Oficina de Textos; 2008. p. 144
4.Florenzano TG. Imagens de satélite para estudos ambientais. 1st ed. São Paulo: Oficina de Textos; 2002. p. 97
5.Giongo M et al. Lidar: princípios e aplicações florestais. Pesquisa Florestal Brasileira. 2010;30(63):231-244
6.Longley PA et al. Sistemas e ciência da informação geográfica. 3rd ed. Porto Alegre: Bookman; 2013. p. 529
7.Nascimento Júnior JO do. Schuler CA, Cavalcante RB, Anais de S. III Simpósio Regional de Geoprocessamento e Sensoriamento Remoto Aracaju/SE, 25 a 27 de outubro de. 2006
8.Ferraz R da S, Souza SF de, Reis MLL. Laser Scanner Terrestre: teoria, aplicações e prática. Revista Brasileira de Geomática, Pato Branco. 2016;4(2):99-109
9.Bordin F. Laser scanner terrestre na caracterização de alvos florestais. In: Tese (Doutorado) – Programa de Pós-Graduação em Sensoriamento Remoto. Porto Alegre: Universidade Federal do Rio Grande do Sul; 2015. p. 89 f
10.Brandalize AA. Perfilamento a LASER: comparação com métodos fotogramétricos. Curitiba: Esteio Engenharia e Aerolevantamentos S.A; 2001
11.Wehr A, Lohr U. Airborne laser scanning – An introduction and overview. ISPRS Journal of Photogrammetric and Remote Sensing. 1999;54:68-82
12.Lenartovicz IR. Avaliação da potencialidade do laser scanner terrestre no monitoramento de estruturas: estudo de caso UHE Mauá. 121 f. Dissertação (Mestrado) - Programa de Pós-Graduação em Ciências Geodésicas. Curitiba: Departamento de Geomática, Universidade Federal do Paraná; 2013
13.González-Jorge H et al. Monitoring biological crusts in civil engineering structures using intensity data from terrestrial laser scanners. Construction and Building Materials. 2012;31:119-128
14.Bellian JA, Kerans C, Jennette DC. Digital outcrop models: Applications of terrestrial scanning lidar technology in stratigraphic modeling. Journal of Sedimentary Research. 2005;75(2):166-176
15.Tommaselli AMG. Um Estudo sobre as Técnicas de Varredura a Laser e Fotogrametria para Levantamentos 3D a Curta Distância. São Paulo, UNESP Presidente Prudente: Geodésia Online; 2003
16.Pu S, Vosselman G. Knowledge based reconstruction of building models from terrestrial laser scanning data. ISPRS Journal Photogrammetry and Remote Sensing. 2009;64(6):575-584
17.Godycka KN, Szulwic J, Ziółkowski P. The Method of Analysis of Damage in Reinforced Concrete Beams Using Terrestrial Laser Scanning. Poland: Faculty of Civil and Environmental Engineering, Gdansk University of Technology; 2014 14th International Multidisciplinary Scientific GeoConference SGEM
18.Lubowiecka I. Historic bridge modelling using laser scanning, ground penetrating radar and finite element methods in the context of structural dynamics. Engineering Structures. 2009;31(11):2667-2676
19.Pesci A, Casula G, Boschi E. Laser scanning the Garisenda and Asinelli towers in Bologna (Italy): Detailed deformation patterns of two ancient leaning buildings. Journal of Cultural Heritage. 2011;12(2):117-127
20.Teza G, Galgaro A, Moro F. Contactless recognition of concrete surface damage from laser scanning and curvature computation. NDT&E International. 2009;42(4):240-249
21.Rabah M, Elhattab A, Fayad A. Automatic concrete cracks detection and mapping of terrestrial laser scan data. NRIAG Journal of Astronomy and Geophysics. 2013;2:6. Available from: http://www.riegl.com/nc/products/terrestrialscanning/produktdetail/product/scanner/33 [Accessed: September 14, 2019]
22.Brandão AM da S. Qualidade e durabilidade das estruturas de concreto armado. 137 f. Dissertação (Mestrado) - Curso de Engenharia de Estruturas. São Carlos: Universidade de São Paulo; 1998
23.Meouche RE et al. Using a laser scanning to construct a 3D numerical model to study the flooding risk in urban area. IACSIT International Journal of Engineering and Technology. 2013;5(3):7
24.Gonçales R. Dispositivo de varredura laser 3D terrestre e suas aplicações na engenharia, com ênfase em túneis,103 f. Dissertação (Mestrado) - Programa de Pós-graduação em Engenharia de Transportes. São Paulo: Departamento de Engenharia de Transportes, Universidade de São Paulo; 2007
25.Fekete S, Diederichs M, Lato M. Geotechnical and operational application for 3-dimensional laser scanning in drill and blast tunnels. Tunnelling and Underground Space Technology. 2010;25(5):614-628
26.Marzouk M, Metawie M, ElSharkawy M, Eid A, Hawas S. Application of laser scanning technology in energy analysis and structural health monitoring of heritage buildings. In: CSCE Annual Conference Growing with Youth – Croître avec les jeunes At: Laval (Greater Montreal) Project: Framework for Restoration of Heritage Using Building Information Modeling (FresHBIM) June 12-15, 2019
27.Mugnai F, Lombardi L, Tucci G, Nocentini M, Gigli G, Fanti R. Geomatics in bridge structural health monitoring, integrating terrestrial laser scanning techniques and geotechnical inspections on a high value cultural heritage. International Archives of the Photogrammetry, Remote Sensing & Spatial Information Sciences. 2019;XLII-2/W11:895-900
28.Sansoni G, Cattaneo C, Trebeschi M, Gibelli D, Poppa P, Porta D, et al. Scene of-crime analysis by a 3-dimensional optical digitizer: A useful perspective for forensic science. The American journal of forensic medicine and pathology. 2011;5(2):280-286
29.Lumme J, Karjalainen M, Kaartinen H, Kukko A, Hyyppä J, Hyyppä H, et al. Terrestrial laser scanning of agricultural crops. The International Archives of the Photogrammetry, Remote Sensing and Spatial Information Sciences. 2008;XXXVII(Part B5):563-566
30.Barchik EAL, Moser I, Santos DS, Martins BD. Aplicação do scanner terrestre ILRIS-3D no ramo da mineração. In: Simpósio Brasileiro de Sensoriamento Remoto, 13. (SBSR). Florianópolis. Anais... São José dos Campos: INPE; 2007. pp. 3631-3635
31.Kurz TH, Buckley SJ, Howell JA. Close range hyperspectral imaging integrated with terrestrial lidar scanning applied to rock characterization at centimetre scale. International Archives of the Photogrammetry, Remote Sensing and Spatial Information Sciences. 2012;XXXIX-B5:417-422. DOI: 10.5194/isprsarchives-XXXIX-B5-417-2012
32.Lingnau C, Silva M, Santos D, Machado LJ. Mensuração de alturas de árvores individuais a partir de dados laser terrestre. Revista Ambiência, Guarapuava. 2008;4(1):85-96
33.Dalmolin Q , Santos DR dos. Sistema Laser Scanner: Conceitos e princípios de funcionamento. 3rd ed. Curitiba: UFPR; 2004. p. 97
34.Takhirov S, Gilani A, Quigley B, Myagkova L. Structural health monitoring and assessment of seismic vulnerability of historic monuments on the Great Silk Road based on laser scanning. Em: Aguilar R, Torrealva D, Moreira S, Pando MA, Ramos LF, editors. Structural Analysis of Historical Constructions. RILEM Bookseries, Vol. 18. Cham: Springer; 2019
35.Shafikani A, Bheemasetti T, Puppala A. Performance evaluation of a bridge infrastructure using terrestrial laser scanning technology. Geotechnical Testing Journal. 2019;42(6):1587-1605. DOI: 10.1520/GTJ20170325
36.Cha G, Park S, Oh T. A terrestrial LiDAR-based detection of shape deformation for maintenance of bridge structures. Journal of Construction Engineering and Management. 2019;145:04019075. DOI: 10.1061/(ASCE)CO.1943-7862.0001701
37.Carvalho LPCF de. Estudo da aplicação do laser scanner terrestre na identificação de patologias em estruturas de concreto. 153 f. Projeto final (Graduação em Engenharia Cartográfica) – Faculdade de Engenharia. Rio de Janeiro: Universidade do Estado do Rio de Janeiro; 2019
38.Armesto J, Roca-Pardiñas J, Lorenzo H, Arias P. Modelling masonry arches shape using terrestrial laser scanning data and nonparametric methods. Engineering Structures. 2010;32(2):607-615
39.Tang P, Huber D, Akinci B, Lipman R, Lytle A. Automatic reconstruction of as-built building information models from laser-scanned point clouds: A review of related techniques. Automation in Construction. 2010;19(7):829-843
40.Brilakis I, Lourakis M, Sacks R, Savarese S, Christodoulou S, Teizer J, et al. Toward automated generation of parametric BIMs based on hybrid video and laser scanning data. Advanced Engineering Informatics. 2010;24(4):456-465
41.Bosché F. Automated recognition of 3D CAD model objects in laser scans and calculation of as-built dimensions for dimensional compliance control in construction. Advanced Engineering Informatics. 2010;24(1):107-118
42.Armesto-González J, Riveiro-Rodrigues B, González-Aguilera D, Rivas-Brea T. Terrestrial laser scanning intensity data applied to damage detection for historical buildings. Journal of Archaeologic Armesto-González al Science. 2010;37(12):3037-3047
43.Almeida LC de. Notas de aula da disciplina Estruturas IV – Concreto armado. Departamento de Estruturas, Faculdade de Engenharia Civil (FEC) da Universidade Estadual de Campinas (UNICAMP). 2002
44.Andolfato RP. Controle tecnológico básico do concreto. Núcleo de Ensino e Pesquisa da Alvenaria Estrutural (NEPAE) da Universidade Estadual Paulista (UNESP), Ilha Solteira. 2002
45.Pase MC. Manifestações patológicas em estruturas de concreto armado (2017). 57 f. TCC (Graduação) - Curso de Engenharia Civil. Santa Maria: Universidade Federal de Santa Maria; 2017
46.Couto JAS et al. O concreto como material de construção. Caderno de Graduação - Ciências Exatas e Tecnológicas. Sergipe. 2013;1(17):49-58
47.Gonçalves EAB. Estudo de Patologias e suas Causas nas Estruturas de Concreto Armado de Obras de Edificações. 174 f. In: Monografia (Graduação em Engenharia Civil). UFRJ – Universidade Federal do Rio de Janeiro. Escola Politécnica. Rio de Janeiro: UFRJ; 2015
48.Rincón IT et al. Manual de inspeccion, evaluacion y diagnostico de corrosion en estructuras de hormigon armado. 1997
49.Souza Júnior TF de. Tecnologia e qualidade do material concreto nas construções agroindustriais. 2004. 215 f. Dissertação (Mestrado) - Curso de Engenharia Agrícola. Minas Gerais: Universidade Federal de Lavras. p. 2004
51.Associação Brasileira de Normas Técnicas (ABNT). NBR 6118: Projeto de estruturas de concreto - Procedimento. Rio de Janeiro; 2014
52.Associação Brasileira de Normas Técnicas (ABNT). NBR 7480: Aço destinado a armaduras para estruturas de concreto armado - Especificações. Rio de Janeiro; 2007
53.Ambrósio T da SP. Tratamento e Reforço de Estruturas de Concreto no Metrô de São Paulo. 2004. 130 f. São Paulo: TCC (Graduação) - Curso de Engenharia Civil, Universidade Anhembi Morumbi; 2004
54.Bastos HC do N, Miranda MZ. Principais patologias em estruturas de concreto de pontes e viadutos: manuseio e manutenção de obras em arte especial. Revista Construindo, Belo Horizonte. 2017;9:93-101
55.Bertolini L. Materiais de construção – patologia, reabilitação, prevenção. 1st ed. São Paulo: Oficina de Textos; 2010. p. 414
56.Cavalcante FSS. Generalidades sobre a corrosão em estruturas de concreto armado. 2009. 57 f. Trabalho de Conclusão de Curso (Graduação) – Curso de Engenharia Civil. Sobral: Universidade Estadual Vale do Acaraú; 2009
57.Santos BO de C, Interlandi C. Estruturas de Concreto Armado: Patologias e suas Consequências Estudo de Caso. Engenharia Estudo e Pesquisa, São Paulo. 2016;16(2):4047
58.Castro EK de. Desenvolvimento de Metodologia para Manutenção de Estruturas de Concreto Armado. 1994. 129 f. Dissertação (Mestrado) - Curso de Engenharia Civil. Brasília: Universidade de Brasília; 1994
Written By
Sérgio Orlando Antoun Netto, Lucas Pires Chagas Ferreira de Carvalho, Ana Waldila de Queiroz Ramiro Reis, Leonardo Vieira Barbalho and Lucas de Campos Rodrigues
Submitted: 09 December 2022Reviewed: 19 December 2022Published: 17 March 2023
 Open access peer-reviewed chapter