Open Access is an initiative that aims to make scientific research freely available to all. To date our community has made over 100 million downloads. It’s based on principles of collaboration, unobstructed discovery, and, most importantly, scientific progression. As PhD students, we found it difficult to access the research we needed, so we decided to create a new Open Access publisher that levels the playing field for scientists across the world. How? By making research easy to access, and puts the academic needs of the researchers before the business interests of publishers.
We are a community of more than 103,000 authors and editors from 3,291 institutions spanning 160 countries, including Nobel Prize winners and some of the world’s most-cited researchers. Publishing on IntechOpen allows authors to earn citations and find new collaborators, meaning more people see your work not only from your own field of study, but from other related fields too.
To purchase hard copies of this book, please contact the representative in India:
CBS Publishers & Distributors Pvt. Ltd.
www.cbspd.com
|
customercare@cbspd.com
Interhemispheric inhibition is an inhibitory function of the brain that enables complex human locomotion and plays an important role in motor control. Traditionally, interhemispheric inhibition has been assessed using transcranial magnetic stimulation, functional magnetic resonance imaging, and electroencephalography. However, motor overflow and bimanual coordinated movements have recently attracted attention as behavioral indices involving interhemispheric inhibition. Motor overflow is defined as the presence of involuntary movements or weak muscle activity that appears with voluntary movements and has been found to occur mainly in the elderly, children, and those with central nervous system diseases. In addition, interhemispheric inhibition is involved in bimanual coordinated movements associated with interhemispheric motor control and information processing. This chapter outlines motor overflow and bimanual coordinated movements as new behavioral indices of interhemispheric inhibition and proposes assessment methods that can be performed in physiotherapy clinics.
Neurorehabilitation Laboratory, Graduate School of Health Sciences, Kyoto Tachibana University, Kyoto, Japan
Department of Rehabilitation, Kyoto Kuno Hospital, Kyoto, Japan
Shun Sawai
Neurorehabilitation Laboratory, Graduate School of Health Sciences, Kyoto Tachibana University, Kyoto, Japan
Department of Rehabilitation, Kyoto Kuno Hospital, Kyoto, Japan
Ryosuke Yamamoto
Neurorehabilitation Laboratory, Graduate School of Health Sciences, Kyoto Tachibana University, Kyoto, Japan
Department of Rehabilitation, Tesseikai Neurosurgical Hospital, Osaka, Japan
Hideki Nakano*
Neurorehabilitation Laboratory, Graduate School of Health Sciences, Kyoto Tachibana University, Kyoto, Japan
*Address all correspondence to: nakano-h@tachibana-u.ac.jp
1. Introduction
Interhemispheric inhibition is the mechanism by which the left and right cerebral hemispheres inhibit the activity of the other hemisphere and is believed to occur during voluntary one-handed movements [1]. Interhemispheric inhibition has also been shown to be associated with motor control in humans [2]. In 1956, Creutzfeldt et al. first reported the presence of inhibition in the cerebral cortex of cats [3]. Subsequently, in 1993, experimental evidence of inhibitory effects on the cerebral cortex in humans was demonstrated using transcranial magnetic stimulation (TMS), which non-invasively modulates brain activity [4]. Since the 1980s, several studies have provided supportive evidence for the existence of interhemispheric inhibition [5, 6, 7]. However, using two TMS devices, Ferbert et al. reported particularly reliable evidence for the presence of interhemispheric inhibition in healthy adults [8]; in this study, the effects of conditioning magnetic stimulation applied to the hand area of one primary motor cortex and test magnetic stimulation applied to the hand area of the contralateral primary motor cortex on electromyographic (EMG) responses evoked in the first dorsal interosseous muscle were examined. The results showed that the test response elicited in the contralateral hemisphere was suppressed when the interval between the application of conditioning stimuli to one hemisphere, and the next test stimulus was more than 5–6 ms. The researchers termed this suppression “interhemispheric inhibition” and hypothesized that it was induced via the corpus callosum.
The measurement of interhemispheric inhibition has also been used to elucidate the pathophysiology of movement disorders from a central nervous system perspective [5]. However, recent studies have demonstrated a link between age-related alterations and interhemispheric inhibition [9]. Therefore, in the context of an increasingly elderly population worldwide, interhemispheric inhibition may serve as a predictive indicator of motor and cognitive decline in the elderly [9, 10, 11]. In this chapter, we review the latest assessment indices for interhemispheric inhibition and assessment methods for potential application in the clinical physiotherapy setting.
2. Interhemispheric suppression and conventional measurement methods
The presence of interhemispheric inhibition has been known since the 1990s, and many studies have elucidated its mechanism as a cortical inhibitory function necessary for motor control. Notably, studies on interhemispheric inhibition in humans have employed functional magnetic resonance imaging (fMRI) and electroencephalography (brain) when evaluating unilateral upper limb movements. In addition, some studies have used noninvasive modulation of the brain activity using TMS to evaluate interhemispheric inhibition instead of unilateral upper limb motor tasks. This section reviews the traditional methods used to evaluate interhemispheric inhibition, differences between the measurement methods, and the results of the associated studies.
2.1 Interhemispheric suppression and TMS
TMS is a noninvasive tool that modulates the excitability of the motor cortex by generating a magnetic field that passes through the scalp using a wire coil [12]. It has been used as a rehabilitation treatment for stroke, spinal cord injury, traumatic brain injury, and multiple sclerosis, as well as for neurophysiological diagnoses [13]. TMS interventions for assessing interhemispheric inhibition have been reported since the 1990s. In 1998, Mayer et al. investigated the mechanisms underlying the development of interhemispheric inhibition and tested whether a TMS-based approach could be used to diagnose interhemispheric inhibition [14]. Fourteen patients with lesions in the corpus callosum were included in this study. Of all the participants, four had lesions in the cerebral corpus callosum, two in the anterior trunk, six in the middle trunk, and two in the vastus callosum. TMS was applied to the hand regions of the primary motor cortex at an intensity of 80% of the maximum voluntary contraction (MVC) force. Surface electrodes were placed on the bilateral first dorsal interosseous muscles, and EMG activity was measured. The results showed that interhemispheric inhibition did not occur in one participant with a lesion in the corpus callosum nor in six participants with a lesion in the corpus callosum trunk. The other participants showed interhemispheric inhibition, leading to the conclusion that the majority of fibers mediating interhemispheric inhibition passed through the corpus callosum. Other studies have provided evidence corroborating the notion that interhemispheric inhibition occurs via the corpus callosum [15, 16]. Therefore, TMS can modulate brain activity to induce interhemispheric inhibition. The corpus callosum has also been suggested as a useful neurophysiological target for assessing interhemispheric inhibition.
2.2 Interhemispheric inhibition and fMRI
fMRI, based on MRI, is used to evaluate dynamic changes in the brain tissue resulting from variations in neurometabolism [17]. In 2000, Allison et al. used fMRI to examine interhemispheric interactions during a unilateral motor task compared to during a resting state [18]; in this study, 13 healthy participants with a mean age of 36 years performed one-handed tapping exercises of the thumb and fingers from the index to the little finger, in turn, for four sets of 30 s each. The tapping speed advised to participants was to tap each of the four fingers and thumb, approximately every 2 s. During the tapping task, brain activity was captured every 3 s using MRI, and 128 sets of brain images were acquired in total. Data on regional changes in blood oxygenation were extracted from the acquired brain images. The results revealed activation of the sensorimotor cortex and subcortical regions contralateral to the hand movements, as well as the ipsilateral cerebellum. In contrast, finger movements were shown to cause significant inactivation (reduced blood oxygenation) in the ipsilateral sensorimotor cortex, subcortical areas, and contralateral cerebellum. Thus, this study suggests that the ipsilateral cerebral hemisphere and contralateral cerebellar hemisphere are inactivated due to interhemispheric inhibition mediated via the corpus callosum.
Interhemispheric inhibition has also been shown to be related to aging. Gröschel et al. examined age-related differences in the interhemispheric inhibition process, with negative changes in the blood oxygenation level-dependent (BOLD) signal [19]. In this study, 14 individuals from the younger group (mean age 23.3 years) and 13 from the older group (mean age 73.2 years) were included. Peripheral electrical stimulation was applied to the right median nerve in all participants, and the BOLD signal of the somatosensory system was measured during stimulation. Peripheral electrical stimulation was delivered at 40 Hz, a level that produces effective fMRI responses, and two sets of stimulation for 30 seconds each were applied. The results showed negative changes in BOLD signals across all participants in the right primary somatosensory cortex, primary motor cortex, thalamus, and basal ganglia. When comparing the two age groups, a significant difference in the inactivation of the right primary somatosensory cortex was identified in the one set, indicating that the elderly group had significantly less cortical inactivation during endogenous electrical stimulation. Thus, this suggests that the inhibitory function in the brains of elderly individuals is reduced compared to that in the young. In addition, a previous study reporting age-related changes in brain structure using fMRI reported that the corpus callosum degenerates and interhemispheric inhibition is reduced in the elderly [20]. This indicates that the measurement of interhemispheric inhibition using fMRI mainly assesses regional changes in cerebral blood oxygenation and morphological changes in the corpus callosum in response to hand motor tasks and TMS. It has also been suggested that interhemispheric inhibition is reduced in the elderly owing to age-related degeneration of the corpus callosum.
2.3 Interhemispheric inhibition and electroencephalogram (EEG)
EEG is a reliable, inexpensive, and useful tool for investigating electrophysiological brain activity [21]. EEG measurements of motor tasks typically involve temporally aligning repetitive motor events and averaging motor/event-related potentials that indicate cortical activity. Studies on interhemispheric inhibition have shown that cortical activity is often narrowed to the beta frequency band (14–30 Hz) [22], which is involved in the execution of movement, and to the alpha frequency band (8–13 Hz) [23], which is involved in inhibitory processes within the brain [24]. The association between the alpha frequency band and age-related decline in motor performance control was examined in a previous study by Bönstrup et al. using EEG signal measurement during hand motor tasks [25]. The participants included 15 young individuals with an average age of 25.0 years and 15 elderly individuals with an average age of 70.0 years. The specific fingermovement task consisted of ten consecutive tapping movements with four fingers of the right hand. Tapping movements were performed at 1 Hz intervals in a randomized, complex sequence. Based on the fact that inhibitory control over motor performance depends on motor memory formation, EEG was measured 1 h and 24 h after the task. The results, shown in Figure 1, revealed that 1 h after the task, there was an increase in the alpha frequency band in the younger group; however, this was not statistically significant. A significant decrease was observed in the alpha frequency band in the older group. However, 24 h after the task, there was a significant increase in the alpha frequency band in the younger group but not in the older group. This study suggests that the age-related impairment of inhibitory neurotransmission may explain the reduced alpha frequency band activity observed in the elderly group. It has also been suggested that corticocortical interactions in the motor control networks may be reduced in the aging brain.
Figure 1.
(A) task-related spectral power (TR-Pow) topography diagram of the alpha frequency band of the sensorimotor cortex in the young and elderly groups at 1 and 24 h post-task [25]. Only the TR-Pow located on the central coordinates of the bilateral sensorimotor cortex is shown. In the right-hand diagram, the difference between the two measurements (24 h and 1 h later) is plotted, and (B) bar chart showing the relative change in TR-Pow for the alpha frequency band of both the groups. Error bars = 1 SEM (*p < 0.05; and **p < 0.01).
In a combined EEG and TMS study, Ishibashi et al. [26] assessed interhemispheric coupling during a motor task in 11 healthy male individuals (mean age, 24.9 years) using interhemispheric signal propagation (ISP), recognized as a reliable method for assessing interhemispheric coupling. The participants performed an experimental task consisting of visual stimulation and TMS with simultaneous measurement of motor-evoked potentials (MEPs) and EEG. In the experimental task, 100 trials were performed for each of the four conditions in a randomized sequence: (1) TMS was administered in the left primary motor cortex at rest, (2) TMS was administered in the left primary motor cortex at rest during a rapid abduction movement of the right index finger, (3) TMS was administered in the right primary motor cortex at rest, and (4) TMS was administered in the right primary motor cortex at rest during a rapid abduction movement of the left index finger. The occurrence of EMG activity was defined as the point at which the rectified EMG response in the first dorsal interosseous muscle exceeded 100 μV. A 19-channel recording electrode was used for EEG measurements, and a reference electrode was placed at the earlobe. The sampling frequency was recorded at 5 kHz. The results showed that the ISP from the left to the right hemisphere during right-handed fast movements was higher than that from the right to the left hemisphere. The results of this study suggest that the left primary motor cortex strongly inhibits the right primary motor cortex. Thus, EEG-based methods assess the functional connectivity between hemispheres, suggesting that interhemispheric inhibition is involved in motor control.
Recently, motor overflow has attracted attention as a new index for evaluating interhemispheric inhibition. Motor overflow is said to be the spread of motor system output, causing muscular activity in muscles that are supposed to be at rest, as well as in target muscles [27] and an umbrella term used to describe the involuntary movements that sometimes accompany the generation of voluntary movements [28]. This refers to the involuntary movements or weak muscle activities that appear in conjunction with voluntary movements. When motor overflow occurs on the contralateral side in target muscles of the same group, it is referred to as a mirror movement [28, 29]. Regarding the relationship between interhemispheric interactions and mirror movements, it has been reported that the connectivity of the corpus callosum fibers connecting the bilateral primary motor cortices is directly involved in the mirror movement that occurs during dominant hand movements [30].
In humans, motor overflow is caused by abnormal corticospinal tracts [31]. Both transcallosal and ipsilateral corticospinal tract hypotheses have been proposed to explain the abnormal induction of corticospinal tracts. The ipsilateral corticospinal tract hypothesis states that motor overflow is caused by the functional activation of ipsilateral corticospinal projections due to the appearance of independent corticospinal neurons and the abnormal branching of crossing corticospinal fibers [32]. Hence, motor overflow is believed to occur in the ipsilateral hemisphere. In contrast, the transcallosal hypothesis states that inhibition via the corpus callosum is reduced and motor overflow is facilitated in the contralateral hemisphere [33]. Thus, motor overflow is believed to occur in the contralateral hemisphere. Previous studies have not yet determined which hypothesis is applicable, and both theories have been treated independently [32]. Further investigations are required to elucidate the mechanisms underlying motor overflow. Motor overflow occurs mainly in the elderly, children, and in central nervous system diseases. This section reviews the relationship between motor overflow and diseases of the elderly, children, and the central nervous system, as well as the evaluation methods and clinical significance of motor overflow.
3.1 Motor overflow in the elderly
Motor overflow in elderly individuals is primarily treated as an index reflecting motor characteristics associated with age-related alterations in interhemispheric inhibition. In 2003, Bodwell et al. evaluated the magnitude and incidence of motor overflow in the contralateral finger using a finger movement task in elderly individuals [27]. The participants of this study were 20 healthy adults aged 18–25 years and 20 healthy older adults aged 65–85 years. The finger movement task was a finger-tapping task performed in response to auditory stimuli, and measurement parameters comprised the EMG of the first dorsal interosseous muscle and the extensor and flexor muscles of the wrist during the finger movement task. The results revealed that elderly participants with greater manual dexterity exhibited greater motor overflow in the right hand. These results suggest that motor overflow is not a sign of a decline in the systems that control movement but instead reflects events that compensate for compensatory brain activity. Similarly, motor overflow observed during finger movement tasks has been reported to be caused by the increased activation of bilateral cerebral hemispheres with advancing age [34, 35]. Recently, Morisita et al. reported a relationship between interhemispheric inhibition and motor overflow using TMS [11]. In this study, 22 individuals were included in a group of young individuals with a mean age of 26.1 years and a group of elderly individuals with a mean age of 65.0 years. TMS was applied to induce isometric abduction of the right index finger at 15% MVC. The magnitude of the interhemispheric inhibition was assessed based on the MEPs produced in the primary motor cortex contralateral to the primary motor cortex to which TMS was applied, based on the dual-site paired-pulse TMS paradigm. In addition, the participants performed an anti-phase tapping task in which they alternated between synchronized tapping of the left index finger and right middle finger and synchronized tapping of the left middle finger and right index finger. The magnitude of motor overflow was assessed using the EMG waveform of the left first dorsal interosseous muscle. The results showed that older adults performed better in antiphase tapping as interhemispheric inhibition decreased due to higher motor overflow. Additionally, the lower the interhemispheric inhibition, the higher the incidence of motor overflow. Thus, it has been suggested that older adults may mobilize extensive bilateral regions of the brain to improve or maintain performance. Therefore, the prevalent theory is that motor overflow in older adults appears as a result of decreased interhemispheric inhibition to compensate for the loss of motor capacity associated with age-related changes.
3.2 Motor overflow in children
Children experience motor overflow in the same manner as older adults. However, the factors contributing to motor overflow in children have been shown to be different from those in older adults, who have reduced interhemispheric inhibition to compensate for their reduced motor skills. Specifically, Adamo P K et al. examined this factor by comparing children and adults [36]. The study included 17 children aged 8–11 years and 17 adults aged 18–35 years. The participants performed flexion exercises of the index finger at 33 and 66% MVC. The results showed that children had significantly greater motor overflow than adults, especially in the dominant hand, when exercising with the nondominant hand. These results suggest that motor overflow in children may serve as a stabilization strategy for movement, especially when exercising with the nondominant hand. A follow-on study comparing three generations, comprising 17 children aged 8–11 years, 17 adults aged 18–35 years, and 16 elderly individuals aged 60–80 years was performed [37]. The participants performed the same flexion exercises as the prior study [36]. The results revealed that motor overflow occurs to a greater extent in children and the elderly than in adults and that the neurological processes generated are age-dependent. These results suggest that children have immature motor systems and therefore, mobilize a wider network of regions when exerting maximum force. Simon-Martinez et al. reported a relationship between interhemispheric inhibition and motor overflow in children with unilateral cerebral palsy (uCP) [38]. Children are known to be able to reorganize the corticospinal tracts projecting to the paralyzed side from the contralateral, ipsilateral, or bilateral cerebral cortices. The reorganization of these three pathways varies between individuals; in this study, of the 49 individuals included 17 individuals were recruited with the contralateral pattern, 16 with the ipsilateral pattern, and 16 with the bilateral pattern. Of all the participants, 30 uCP children had periventricular leukomalacia, and nine had cortical-subcortical lesions. The participants performed 10 grip exercises on the non-paralyzed side of the cylindrical transducer. Motor overflow was measured in the paralyzed hand opposite to the moving side. Hand movements were performed bilaterally. The results indicated that motor overflow appeared more frequently on the paralyzed side of children with uCP and an ipsilateral pattern than in those with a contralateral pattern. These results suggest that the primary motor cortex contralateral to the working hand activates the ipsilateral corticospinal tracts innervating the nonworking hand, indicating that unilateral finger movements in children are executed or maintained through bilateral cerebral cortex mobilization. Therefore, it is highly likely that motor overflow appears due to bilateral cerebral hemispheric mobilization in children because their motor systems remain underdeveloped. It suggests that interhemispheric inhibition emerges with the development of the motor system.
3.3 Central nervous disorders and motor overflow
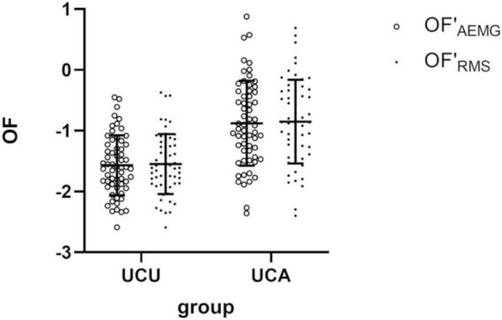
In central nervous system diseases, motor overflow is believed to be an indicator of the recovery process in patients following stroke [39]. In 1998, Nelles et al. examined the association between motor disability severity and motor overflow after stroke in 23 stroke patients and nine healthy elderly individuals [39]. The participants performed a series of exercises in which they held a grip-type dynamometer strongly and rapidly for 10 s. All participants performed this exercise on both the left and right sides, and motor overflow was measured on the nonmoving side. The results showed that motor overflow on the non-paralyzed side of the left hemiplegic patients was significantly greater than that on the paralyzed side in the healthy elderly group. Therefore, this study suggests that motor overflow, which occurs in healthy elderly individuals, may be enhanced after stroke. In addition, it has been suggested that motor overflow may be a clinical indicator of the recovery process of motor function after stroke. In addition, a correlation between motor overflow occurring on the nonoperating side and muscle activity on the operating side has been reported for unilateral upper limb movements after stroke [40]; in this study, EMG was used to assess motor overflow in 60 patients with stroke. The participants performed unilateral elbow flexion exercises for 5 seconds on both sides. EMG was performed on the biceps brachii bilaterally, and a reference electrode was placed on the left humeral lateral epicondyle. In addition, the participants underwent Fugl-Meyer assessment (FMA) for the assessment of proximal and distal upper and lower limb motor function. The results showed that motor overflow occurred significantly on the non-paralyzed side when the motor task was performed on the paralyzed side, as shown in Figure 2. The FMA results also showed that motor overflow in the biceps brachii not only negatively correlated with motor function in the proximal upper limb but also with motor function in the distal upper limb or lower limb. Thus, the results of this study suggest that the proximal muscles of the upper limbs can be used to measure motor overflow and largely reflect interhemispheric interactions.
Figure 2.
Comparison between OF′AEMG and OF′RMS of bilateral biceps brachii during a unilateral contraction task [40]. AEMG represents the mean amplitude of the electromyography waveform. OF’AEMG indicates the overflow rate calculated by dividing the AEMG value of the nonoperating side by the AEMG value of the operating side. RMS is the root mean square. OF’RMS indicates the overflow rate calculated by dividing the RMS value of the nonoperating side by the RMS value of the operating side. On the vertical axis, OF indicates the overflow rate. On the horizontal axis, UCU represents the group performing the behavioral task on the non-paralyzed side, and UCA is the group performing the behavioral task on the paralyzed side. When the motor task was performed on the paralyzed side (UCA), motor overflow significantly increased on the non-paralyzed side.
The developmental mechanisms by which motor overflow occurs after stroke and whether cortical or subcortical triggers are responsible were examined in a study of 53 patients with stroke and 14 healthy elderly individuals [41]. In this study, participants performed 40 exercise trials in which each of the 10 fingers was flexed with four patterns of force: 20, 40, 60, and 80% MVC. Measurements were performed at 2, 4, 12, 24, and 52 weeks after stroke onset. In this study, motor overflow was defined as the difference between the force generated by the nonmoving and resting finger forces. Brain activity during motor tasks was measured using fMRI. The results showed that the pattern of motor overflow in stroke survivors was similar to that in healthy elderly individuals and was enhanced. Therefore, this study indicated that motor overflow may occur because of increased activity in the ciliary spinal system after stroke. This suggests that motor overflow is induced subcortically after stroke. In conclusion, motor overflow after stroke is often observed on the non-paralyzed side when the paralyzed upper limb is moved, suggesting that motor overflow occurring in the elderly may be amplified. Recent studies have also highlighted that poststroke manifestations are of subcortical origin, which could help elucidate the recovery mechanisms of motor function after stroke.
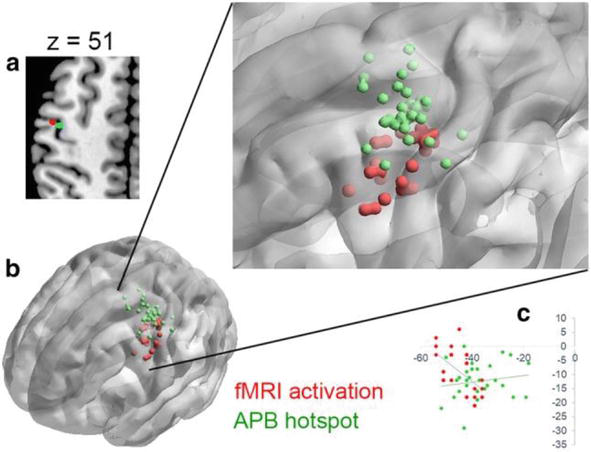
Fingers are a body part responsible for essential movements in daily life that require highly coordinated movements. It has been shown that motor control by interhemispheric inhibition is involved in the execution of hand movements [4]. Furthermore, it has been reported that, during the preparatory phase, hand movements in the elderly are more dependent on the premotor cortex than those in the adults [42]. In addition, a study examining interhemispheric inhibition in the elderly showed that the quality of finger movement performance was lower than that in adults with bilateral primary motor areas activated, while premotor areas tended to be inactive [43]. As discussed in Section 2, modulating brain activity by applying TMS to the hand regions of the primary motor cortex is commonly used to assess interhemispheric inhibition. However, it has recently been reported that the hotspot of TMS in the hand region of the primary motor cortex is different from the fMRI activation area generated during finger-tapping movements [44]. Figure 3 shows that the TMS hotspot assigned to the hand region differed from the activation area corresponding to the premotor cortex measured using fMRI during hand-tapping exercises. Hence, finger movements may be the best way to induce interhemispheric inhibition. In other words, hand-tapping exercise may be optimal for inducing and evaluating interhemispheric inhibition. Thus, the optimal evaluation method for interhemispheric inhibition is still in the process of establishment, and future research is expected. This section reviews the current methods used for assessing hand-tapping movements that reflect interhemispheric inhibition.
Figure 3.
Functional magnetic resonance imaging (fMRI) activation of premotor cortex and localization by transcranial magnetic stimulation (TMS) hotspots [44]. (a) red ellipses represent mean Montreal neurological institute (MNI) coordinates (± standard deviation [SD]) of the fMRI activation peak voxels. Green ellipses represent mean MNI coordinates (± SD) of the TMS hotspots. All coordinates are located in the left hemisphere, (b) individual locations are projected onto the three-dimensional brain template, and (c) scatterplot showing individual locations. It can be seen that the TMS hotspot differs from the fMRI activation area in the premotor cortex.
4.1 Measurement of bimanual coordinated movements
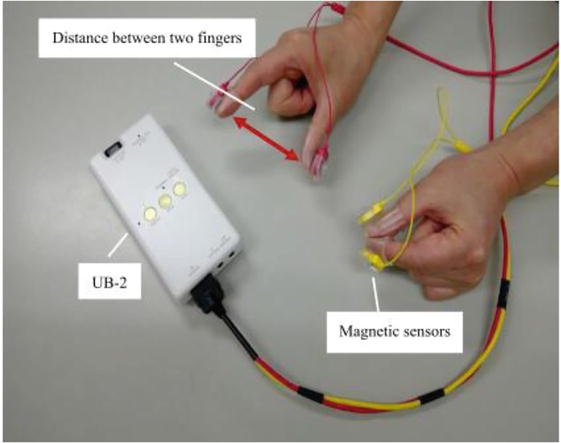
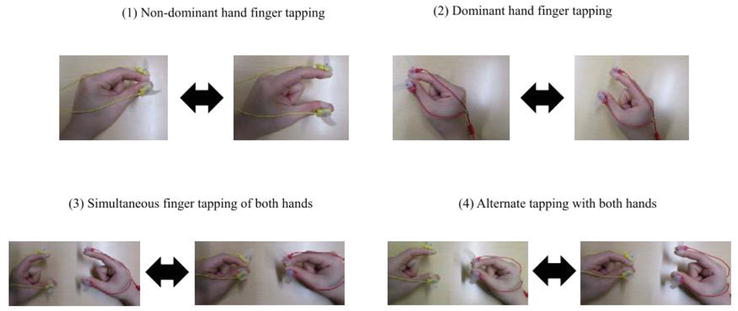
Recently, magnetic sensor finger-tapping devices have gained attention as a new method for measuring bimanual coordinated movements (Figure 4) [45]. These devices consist of a magnetic induction coil, sensing coil, and circuit unit [46]. To obtain measurements, a coil voltage is induced between the two coils based on the law of electromagnetic induction. The induced voltage has a nonlinear modeling relationship with the distance between the coils; therefore, the distance between the fingertip and attached coil can be estimated based on the voltage [47]. The finger movement tasks using the magnetic sensor finger-tapping device include a unilateral finger-tapping task (left and right), an in-phase task in which both fingers are tapped simultaneously, and an antiphase task in which both fingers are tapped alternately (Figure 5) [45]. From the above four types of finger-tapping tasks, 44 measurement parameters can be extracted using a measuring instrument [48]. The 44 measurement parameters can be classified into five categories (Table 1): (1) distance, to evaluate the distance and magnitude of hand movements (n = 7), (2) velocity, to evaluate the velocity of hand movements and the speed of hand flexion/extension movements (n = 15), (3) acceleration, to evaluate the momentum of hand movements and the differences between hand flexion and extension movements (n = 10), (4) tap interval, to evaluate the average speed of hand movements and variations in tapping (n = 8), and (5) phase difference, to evaluate the difference in timing of tapping between the two hands (n = 4). Many recent studies using magnetic sensor finger-tapping devices have been performed on elderly people and children. However, of the 44 parameters measured, those that differed significantly in interhemispheric inhibition varied widely from study to study. Table 2 presents the conditions of the hand-tapping task, measured parameters, individuals compared with the measured parameters, method of comparison, and parameters for which significant differences were found and reported in the studies from the PubMed database [45, 49, 50, 51, 52, 53, 54], in which elderly individuals and children were the participants and a magnetic sensor-type finger-tapping device was used. Future studies identifying at least one promising measurement parameter from the aforementioned 44 parameters for evaluating interhemispheric inhibition using the magnetic sensor finger-tapping device are warranted.
Figure 4.
Magnetic sensor finger-tapping device (UB-2, Maxell Ltd. Tokyo, Japan) [45]. A yellow cable is attached to the left thumb and index finger and a red cable to the right thumb and index finger. Magnetic sensors are attached to each fingertip, and the waveform of finger tapping can be determined using a personal computer.
Figure 5.
Movement tasks using a magnetic sensor finger-tapping device [45]. (1) unilateral finger-tapping task performed with the nondominant hand, (2) unilateral finger-tapping task performed with the dominant hand, (3) In-phase task with simultaneous bilateral finger tapping, and (4) antiphase task with alternating bilateral finger tapping.
Distance
No. 1
Max of distance amplitude
No. 2
Total traveling distance
No. 3
Avg. of local max. distance
No. 4
SD of local max. distance
No. 5
Slope of approximate line of local max. points
No. 6
CV of local max. distance
No. 7
SD of local max. distance in three adjacent taps
Velocity
No. 8
Max. of velocity amplitude
No. 9
Avg. of local max. velocity
No. 10
Avg. of local min. velocity
No. 11
SD of local max. velocity
No. 12
SD of local min. velocity
No. 13
Energy balance
No. 14
Total energy
No. 15
CV of local max. velocity
No. 16
CV of local min. velocity
No. 17
Number of freezing calculated from velocity
No. 18
Avg. of distance rate of velocity peak in extending movement
No. 19
Avg. of distance rate of velocity peak in flexing movement
No. 20
Ratio of distance rates of velocity peak in extending and flexing movements
No. 21
SD of distance rate of velocity peak in extending movement
No. 22
SD of distance rate of velocity peak in flexing movement
Acceleration
No. 23
Max of acceleration amplitude
No. 24
Avg. of local max. acceleration in extending movement
No. 25
Avg. of local min. acceleration in extending movement
No. 26
Avg. of local max. acceleration in flexing movement
No. 27
Avg. of local min. acceleration in flexing movement
No. 28
Avg. of contact duration
No. 29
SD of contact duration
No. 30
CV of contact duration
No. 31
Number of zero crossover points of acceleration
No. 32
Number of freezing calculated from acceleration
Taping interval
No. 33
Number of taps
No. 34
Avg. of intervals
No. 35
Frequency of taps
No. 36
SD of inter-tapping interval
No. 37
CV of inter-tapping interval
No. 38
Inter-tapping interval variability
No. 39
Skewness of inter-tapping interval distribution
No. 40
SD of inter-tapping interval in three adjacent taps
Phase difference between the left hand and right hand tapping
No. 41
Avg. of phase difference between the left hand and right hand tapping
No. 42
Standard deviation of phase difference between the left hand and right hand tapping
No. 43
Similarity of hands
No. 44
Time lag of similarity of hands
Table 1.
Forty-four measurement parameters were obtained from four different finger-tapping tasks [48].
Abbreviations: Max: maximum; Min: minimum; Ave: average; SD: standard deviation; and CV: coefficient of variation.
Dominant hand task Non-dominant hand tasks In-phase tasks Anti-phase tasks
fastest
15
Total traveling distance Energy balance SD of inter-tapping interval SD of phase difference between the left hand and right hand tapping
Between-group comparison
Multiple comparisons Tukey-Kramer test
AD x healthy elderly Dominant hand task, non-dominant hand task, in-phase task (left/right): Total traveling distance, SD of inter-tapping interval In-phase task (left/right): SD of inter-tapping interval In-phase task: Standard deviation of phase difference between the left hand and right hand tapping MCI x healthy elderly Dominant hand task, In-phase task (left): Avg. of contact duration
Dominant hand task, non-dominant hand task, in-phase task (right): Avg. of local max. acceleration in flexing movement Non-dominant hand task, in-phase (left): SD of inter-tapping interval In-phase task (left): Slope of approximate line of local max. points
Independent variables: age Total traveling distance, SD of local max. distance, Avg. of local max. velocity, Total energy, Max of acceleration amplitude, Avg. of local max. acceleration in extending movement, Avg. of local min. acceleration in extending movement, Avg. of local min. acceleration in flexing movement. Number of taps, Avg. of intervals, Frequency of taps, Avg. of phase difference between the left hand and right hand tapping Independent variable: gender Slope of approximate line of local max. points, Max. of velocity amplitude, SD of local min. velocity, Max of acceleration amplitude, Avg. of local max. acceleration in flexing movement, Avg. of local min. acceleration in flexing movement
ADHD children: 14 (Ave 9 years 8 months ± 1 year 4 months)
In-phase tasks Anti-phase tasks
fastest
10
21 parameters measurable from the task.
children with stereotyped developmental characteristics
two-way ANOVA
In-fase task (dominant hand). Anti-phase task (left / right): Max of distance amplitude, Avg. of local max. distance, Number of taps, Avg. of intervals, Frequency of taps In-fase task (dominant hand): Avg. of local min. velocity, Avg. of local max. acceleration in flexing movement In-fase (dominant hand), Anti-phase (non-dominant hand): Energy balance
Dominant hand task Non-dominant hand tasks In-phase tasks Anti-phase tasks
fastest
15
44 parameters measurable from the task.
between-group comparison
unpaired t-test
Anti-phase task (left): Number of taps, Avg. of intervals, SD of inter-tapping interval Number of freezing calculated from acceleration
Table 2.
Comparison of studies in which magnetic sensor finger-tapping devices were used.
Abbreviations: AD: Alzheimer’s disease; MCI: Mild cognitive impairment; ADHD: attention deficit hyperactivity disorder; MMSE: mini-mental state examination; SD: standard deviation; Avg: average; CV: coefficient of variation; Max: maximum; Min: minimum; ANOVA: analysis of variance; and VSRAS: voxel-based regional analysis system for Alzheimer’s disease.
4.2 Bimanual coordinated movements and aging
Bimanual coordinated movements are controlled by interhemispheric inhibition, and many studies have reported the effects of age-related changes on these movements. In particular, improved finger movement ability leads to improved activities of daily living in older adults with dementia [55], and studies investigating the relationship between bimanual coordination movements and cognitive function have gained attention in recent years. Several studies have compared individuals with Alzheimer’s disease (AD) or mild cognitive impairment (MCI) with healthy elderly individuals [49, 50, 54]. In one such study, Suzumura et al. compared and verified the motion characteristics of bimanual coordinated movement in 173 MCI patients and 173 healthy elderly subjects using a magnetic sensor finger-tapping device [54]. In this study, four tasks comprise the motor tasks: unilateral finger tapping, in-phase, and antiphase (Figure 5). In the flow of the study, each task was practiced for 5 seconds as a pre-practice. The subject performed only one pre-practice and was instructed to “go as fast as possible.” After that, only one 15-second measurement was performed. The outcome was 44 measurement parameters (Table 1) that indicate the kinematic characteristics of bimanual coordinated movement. The results showed that MCI patients had a significantly higher number of hand freezes calculated from acceleration than healthy elderly subjects. This study excluded subjects with tremors or Parkinsonian symptoms. Thus, since atrophy of the corpus callosum seems to be an early change in dementia, it is suggested that MCI patients show decreased in movements requiring bimanual coordination and rhythm-related parameters. Whereas, Sugioka et al. reported a relationship between atrophy of the medial temporal region of the brain and finger-tapping movements [53]; medial temporal atrophy was assessed using a voxel-based specific region analysis system, which is a well-known early diagnostic tool for AD. The results showed a significant correlation between the standard deviation of the distance rate of the velocity peak in extending movements in the left hand during a nondominant hand task, as well as the in-phase task and the degree of medial temporal atrophy. Therefore, the standard deviation of the distance rate of the velocity peak in extending movements from finger-tapping movements may be a useful parameter for the early detection of AD and for grading its severity.
In addition, bimanual coordinated finger movements in the elderly have been evaluated not only as a measure of interhemispheric inhibition but also as an initial treatment for MCI and for training to improve hand dexterity [56, 57]. Naito et al. performed a study on 48 right-handed elderly individuals (65–78 years) with bimanual finger training or right-hand training for 2 months [57]. In this study, interhemispheric inhibition was assessed through fMRI acquired pre-and post-training. The results revealed that individuals who underwent bimanual finger movement training exhibited improved hand dexterity, which correlated with reduced ipsilateral motor cortical activity. Therefore, bimanually coordinated hand movements appear to activate interhemispheric inhibition and could be used in training paradigms to improve hand dexterity in the elderly.
This chapter reviews conventional assessment methods and recently developed assessment indices for interhemispheric inhibition with respect to motor control. Interhemispheric inhibition is one of the most important assessment indices in physical therapy as it reflects the decline in motor ability associated with age-related alterations and is involved in the mechanisms of motor function recovery in central nervous system disorders. Conventional methods for assessing interhemispheric inhibition have used fMRI and EEG to visualize brain activity during finger movement tasks or during brain activity modulation using TMS. Motor overflow and bimanual coordinated movements have recently gained attention as new indices for evaluating interhemispheric inhibition. In particular, a magnetic sensor tapping device can measure bimanual coordinated movements and evaluate interhemispheric inhibition in a wide range of age groups from children to the elderly. However, there is a need to establish further evidence to support the widespread use of bimanual coordinated movements to assess interhemispheric inhibition in clinical practice. The use of bimanual coordinated movements to assess interhemispheric inhibition in individuals could facilitate our understanding of the pathophysiology of motor control.
1.Boddington LJ, Reynolds JNJ. Targeting interhemispheric inhibition with neuromodulation to enhance stroke rehabilitation. Brain Stimulation. 2017;10(2):214-222. DOI: 10.1016/j.brs.2017.01.006
2.Mirdamadi JL, Xu J, Arevalo-Alas KM, Kam LK, Borich MR. State-dependent interhemispheric inhibition reveals individual differences in motor behavior in chronic stroke. Clinical Neurophysiology. 2023;149:157-167. DOI: 10.1016/j.clinph.2023.02.177
3.Creutzfeldt OD, Baumgartner G, Schoen L. Reaktionen einzelner Neurone des senso-motorischen Cortex nach elektrischen Reizen. I. Hemmung und Erregung nach direkten und kontralateralen Reizen. Archiv für Psychiatrie und Nervenkrankheiten. 1956;194:597-619
4.Roick H, von Giesen HJ, Benecke R. On the origin of the postexcitatory inhibition seen after transcranial magnetic brain stimulation in awake human subjects. Experimental Brain Research. 1993;94(3):489-498. DOI: 10.1007/BF00230207
5.Fuhr P, Agostino R, Hallett M. Spinal motor neuron excitability during the silent period after cortical stimulation. Electroencephalography and Clinical Neurophysiology. 1991;81(4):257-262. DOI: 10.1016/0168-5597(91)90011-l
6.Day BL, Rothwell JC, Marsden CD. Transmission in the spinal reciprocal Ia inhibitory pathway preceding willed movements of the human wrist. Neuroscience Letters. 1983;37(3):245-250. DOI: 10.1016/0304-3940(83)90438-x
7.Cook ND. Callosal inhibition: The key to the brain code. Behavioral Science. 1984;29(2):98-110. DOI: 10.1002/bs.3830290203
8.Ferbert A, Priori A, Rothwell JC, Day BL, Colebatch JG, Marsden CD. Interhemispheric inhibition of the human motor cortex. The Journal of Physiology. 1992;453:525-546. DOI: 10.1113/jphysiol.1992.sp019243
9.Addamo PK, Farrow M, Bradshaw JL, Moss S, Georgiou-Karistianis N. The effect of attending to motor overflow on its voluntary inhibition in young and older adults. Brain and Cognition. 2010;74(3):358-364. DOI: 10.1016/j.bandc.2010.10.001
10.McGregor KM, Nocera JR, Sudhyadhom A, Patten C, Manini TM, Kleim JA, et al. Effects of aerobic fitness on aging-related changes of interhemispheric inhibition and motor performance. Frontiers in Aging Neuroscience. 2013;5:66. DOI: 10.3389/fnagi.2013.00066
11.Morishita T, Timmermann JE, Schulz R, Hummel FC. Impact of interhemispheric inhibition on bimanual movement control in young and old. Experimental Brain Research. 2022;240(2):687-701. DOI: 10.1007/s00221-021-06258-7
12.Klomjai W, Katz R, Lackmy-Vallée A. Basic principles of transcranial magnetic stimulation (TMS) and repetitive TMS (rTMS). Annals of Physical and Rehabilitation Medicine. 2015;58(4):208-213. DOI: 10.1016/j.rehab.2015.05.005
13.Kesikburun S. Non-invasive brain stimulation in rehabilitation. Turkish Journal of Physical and Medical Rehabilitation. 2022;68(1):1-8. DOI: 10.5606/tftrd.2022.10608
14.Meyer BU, Röricht S, Woiciechowsky C. Topography of fibers in the human corpus callosum mediating interhemispheric inhibition between the motor cortices. Annals of Neurology. 1998;43(3):360-369. DOI: 10.1002/ana.410430314
15.Jin K, Xie L, Sun F, Mao X, Greenberg DA. Corpus callosum and experimental stroke: Studies in callosotomized rats and acallosal mice. Stroke. 2011;42(9):2584-2588. DOI: 10.1161/STROKEAHA.111.613349
17.Chen JE, Glover GH. Functional magnetic resonance imaging methods. Neuropsychology Review. 2015;25(3):289-313. DOI: 10.1007/s11065-015-9294-9
18.Allison JD, Meador KJ, Loring DW, Figueroa RE, Wright JC. Functional MRI cerebral activation and deactivation during finger movement. Neurology. 2000;54(1):135-142. DOI: 10.1212/wnl.54.1.135
19.Gröschel S, Sohns JM, Schmidt-Samoa C, Baudewig J, Becker L, Dechent P, et al. Effects of age on negative BOLD signal changes in the primary somatosensory cortex. NeuroImage. 2013;71:10-18. DOI: 10.1016/j.neuroimage.2012.12.039
20.Langan J, Peltier SJ, Bo J, Fling BW, Welsh RC, Seidler RD. Functional implications of age differences in motor system connectivity. Frontiers in Systems Neuroscience. 2010;4:17. DOI: 10.3389/fnsys.2010.00017
22.Babiloni C, Barry RJ, Başar E, et al. International Federation of Clinical Neurophysiology (IFCN) – EEG research workgroup: Recommendations on frequency and topographic analysis of resting state EEG rhythms. Part 1: Applications in clinical research studies. Clinical Neurology. 2020;131(1):285-307. DOI: 10.1016/j.clinph.2019.06.234
23.Sauseng P, Gerloff C, Hummel FC. Two brakes are better than one: The neural bases of inhibitory control of motor memory traces. NeuroImage. 2013;65:52-58. DOI: 10.1016/j.neuroimage.2012.09.048
24.Chettouf S, Rueda-Delgado LM, de Vries R, Ritter P, Daffertshofer A. Are unimanual movements bilateral? Neuroscience and Biobehavioral Reviews. 2020;113:39-50. DOI: 10.1016/j.neubiorev.2020.03.002
25.Bönstrup M, Hagemann J, Gerloff C, Sauseng P, Hummel FC. Alpha oscillatory correlates of motor inhibition in the aged brain. Frontiers in Aging Neuroscience. 2015;7:193. DOI: 10.3389/fnagi.2015.00193
26.Ishibashi K, Ishii D, Yamamoto S, Okamoto Y, Wakatabi M, Kohno Y. Asymmetry of interhemispheric connectivity during rapid movements of right and left hands: A TMS-EEG study. Journal of Motor Behavior. 2022;54(2):135-145. DOI: 10.1080/00222895.2021.1930993
27.Bodwell JA, Mahurin RK, Waddle S, Price R, Cramer SC. Age and features of movement influence motor overflow. Journal of the American Geriatrics Society. 2003;51(12):1735-1739. DOI: 10.1046/j.1532-5415.2003.51557.x
28.Armatas CA, Summers JJ, Bradshaw JL. Mirror movements in normal adult subjects. Journal of Clinical and Experimental Neuropsychology. 1994;16:405-413. DOI: 10.1080/01688639408402651
29.Cernacek J. Contralateral motor irridation—cerebral dominance. Archives of Neurology. 1961;4:61-68
30.Sehm B, Steele CJ, Villringer A, Ragert P. Mirror motor activity during right-hand contractions and its relation to white matter in the posterior Midbody of the Corpus callosum. Cerebral Cortex. 2016;26(11):4347-4355. DOI: 10.1093/cercor/bhv217
31.Welniarz Q , Dusart I, Gallea C, Roze E. One hand clapping: Lateralization of motor control. Frontiers in Neuroanatomy. 2015;9:75. DOI: 10.3389/fnana.2015.00075
32.Hoy KE, FitzgeraldP B, Bradshaw JL, Armatas CA, Georgiou-Karistianis N. Investigating the cortical origins of motor overflow. Brain Research Reviews. 2004;46(3):315-327. DOI: 10.1016/j.brainresrev.2004.07.013
33.Luo Y, Chen C, Adamek JH, Crocetti D, Mostofsky SH, Ewen JB. Altered cortical activation associated with mirror overflow driven by non-dominant hand movement in attention-deficit/hyperactivity disorder. Progress in Neuropsychopharmacology and Biology Psychiatry. 2022;112:110433. DOI: 10.1016/j.pnpbp.2021.110433
34.Baliz Y, Armatas C, Farrow M, Hoy KE, Fitzgerald PB, Bradshaw JL, et al. The influence of attention and age on the occurrence of mirror movements. Journal of the International Neuropsychological Society. 2005;11(7):855-862. DOI: 10.1017/s1355617705051003
35.Addamo PK, Farrow M, Hoy KE, Bradshaw JL, Georgiou-Karistianis N. The influence of task characteristics on younger and older adult motor overflow. Quarterly Journal of Experimental Psychology (Hove). 2009;62(2):239-247. DOI: 10.1080/17470210802269217
36.Addamo PK, Farrow M, Hoy KE, Bradshaw JL, Georgiou-Karistianis N. A developmental study of the influence of task characteristics on motor overflow. Brain and Cognition. 2009;69(2):413-419. DOI: 10.1016/j.bandc.2008.09.005
37.Addamo PK, Farrow M, Bradshaw JL, Moss S, Georgiou-Karistianis N. Characterizing the developmental profile of effort-induced motor overflow across a timed trial. The American Journal of Psychology. 2013;126(2):227-234. DOI: 10.5406/amerjpsyc.126.2.0227
38.Simon-Martinez C, Decraene L, Zielinski I, Hoare B, Williams J, Mailleux L, et al. The impact of brain lesion characteristics and the corticospinal tract wiring on mirror movements in unilateral cerebral palsy. Scientific Reports. 2022;12(1):16301. DOI: 10.1038/s41598-022-19920-z
40.Dai J, Wu F, Li J, Yu M, Liao C, Shou Y. Surface electromyography analysis of mirror movements under unilateral movement in stroke patients: A retrospective study. Frontiers in Human Neuroscience. 2022;16:1079596. DOI: 10.3389/fnhum.2022.1079596
41.Ejaz N, Xu J, Branscheidt M, Hertler B, Schambra H, Widmer M, et al. Evidence for a subcortical origin of mirror movements after stroke: A longitudinal study. Brain. 2018;141(3):837-847. DOI: 10.1093/brain/awx384
42.Hinder MR, Fujiyama H, Summers JJ. Premotor-motor interhemispheric inhibition is released during movement initiation in older but not young adults. PLoS One. 2012;7(12):e52573. DOI: 10.1371/journal.pone.0052573
43.Chettouf S, Triebkorn P, Daffertshofer A, Ritter P. Unimanual sensorimotor learning-a simultaneous EEG-fMRI aging study. Human Brain Mapping. 2022;43(7):2348-2364. DOI: 10.1002/hbm.25791
44.Wang J, Meng HJ, Ji GJ, Jing Y, Wang HX, Deng XP, et al. Finger tapping task activation vs. TMS hotspot: Different locations and networks. Brain Topography. 2020;33(1):123-134. DOI: 10.1007/s10548-019-00741-9
45.Suzumura S, Kanada Y, Osawa A, Sugioka J, Maeda N, Nagahama T, et al. Assessment of finger motor function that reflects the severity of cognitive function. Fujita Medical Journal. 2021;7(4):122-129. DOI: 10.20407/fmj.2020-013
46.Kandori A, Yokoe M, Sakoda S, Abe K, Miyashita T, Oe H, et al. Quantitative magnetic detection of finger movements in patients with Parkinson's disease. Neuroscience Research. 2004;49(2):253-260. DOI: 10.1016/j.neures.2004.03.004
47.Shima K, Tsuji T, Kan E, Kandori A, Yokoe M, Sakoda S. Measurement and evaluation of finger tapping movements using magnetic sensors. Annual International Conference IEEE Engineering Medical and Biology Society. 2008;2008:5628-5631. DOI: 10.1109/IEMBS.2008.4650490
48.Suzumura S, Osawa A, Nagahama T, Kondo I, Sano Y, Kandori A. Assessment of finger motor skills in individuals with mild cognitive impairment and patients with Alzheimer’s disease: Relationship between finger-to-thumb tapping and cognitive function. Japanese Journal of Comprehensive Rehabilitation Science. 2016;7:19-28. DOI: 10.11336/jjcrs.7.19
49.Sugioka J, Suzumura S, Kawahara Y, Osawa A, Maeda N, Ito M, et al. Assessment of finger movement characteristics in dementia patients using a magnetic sensing finger-tap device. Japanese Journal of Comprehensive Rehabilitation Science. 2020;14:91-94. DOI: 10.11336/jjcrs.11.91
50.Tomita Y, Tanaka S, Takahashi S, Takeuchi N. Detecting cognitive decline in community-dwelling older adults using simple cognitive and motor performance tests. Geriatrics & Gerontology International. 2020;20(3):212-217. DOI: 10.1111/ggi.13863
51.Enokizono T, Ohto T, Tanaka M, Maruo K, Sano Y, Kandori A, et al. Quantitative assessment of fine motor skills in children using magnetic sensors. Brain & Development. 2020;42(6):421-430. DOI: 10.1016/j.braindev.2020.03.004
52.Enokizono T, Ohto T, Tanaka M, Maruo K, Mizuguchi T, Sano Y, et al. Boys with attention-deficit/hyperactivity disorder perform wider and fewer finger tapping than typically developing boys—Peer comparisons and the effects of methylphenidate from an exploratory perspective. Brain & Development. 2022;44(3):189-195. DOI: 10.1016/j.braindev.2021.11.002
53.Sugioka J, Suzumura S, Kuno K, Kizuka S, Sakurai H, Kanada Y, et al. Relationship between finger movement characteristics and brain voxel-based morphometry. PLoS One. 2022;17(10):e0269351. DOI: 10.1371/journal.pone.0269351
54.Suzumura S, Osawa A, Kanada Y, Keisuke M, Takano E, Sugioka J, et al. Finger tapping test for assessing the risk of mild cognitive impairment. Hong Kong Journal of Occupational Therapy. 2022;35(2):137-145. DOI: 10.1177/15691861221109872
55.Liu B, Chen X, Li Y, Liu H, Guo S, Yu P. Effect of passive finger exercises on grip strength and the ability to perform activities of daily living for older people with dementia: A 12-week randomized controlled trial. Clinical Interventions in Aging. 2018;13:2169-2177. DOI: 10.2147/CIA.S174756
56.Wang J, Xie J, Li M, Ren D, Li Y, He Y, et al. Finger exercise alleviates mild cognitive impairment of older persons: A community-based randomized trial. Geriatric Nursing. 2022;47:42-46. DOI: 10.1016/j.gerinurse.2022.06.014
57.Naito E, Morita T, Hirose S, Kimura N, Okamoto H, Kamimukai C, et al. Bimanual digit training improves right-hand dexterity in older adults by reactivating declined ipsilateral motor-cortical inhibition. Scientific Reports. 2021;11(1):22696. DOI: 10.1038/s41598-021-02173-7
Written By
Shoya Fujikawa, Shun Sawai, Ryosuke Yamamoto and Hideki Nakano
Submitted: 05 July 2023Reviewed: 08 August 2023Published: 10 November 2023
 Open access peer-reviewed chapter