Open Access is an initiative that aims to make scientific research freely available to all. To date our community has made over 100 million downloads. It’s based on principles of collaboration, unobstructed discovery, and, most importantly, scientific progression. As PhD students, we found it difficult to access the research we needed, so we decided to create a new Open Access publisher that levels the playing field for scientists across the world. How? By making research easy to access, and puts the academic needs of the researchers before the business interests of publishers.
We are a community of more than 103,000 authors and editors from 3,291 institutions spanning 160 countries, including Nobel Prize winners and some of the world’s most-cited researchers. Publishing on IntechOpen allows authors to earn citations and find new collaborators, meaning more people see your work not only from your own field of study, but from other related fields too.
To purchase hard copies of this book, please contact the representative in India:
CBS Publishers & Distributors Pvt. Ltd.
www.cbspd.com
|
customercare@cbspd.com
Quality of health and life expectancy is increasing globally as countries deploy different national health insurance schemes. The universal health coverage index increased from 45 in 2000 to 67 in 2019 with the fastest growth coming from sub-Saharan Africa at an average rate of 2.6% per annum from 2010 to 2019. Life expectancy increased from 66.8 years in 2000 to 73.3 years in 2019. Number of health workers also increased by about 29%. Between 2000 and 2017, catastrophic health expenditures increased by 3% and 1%, using 10% and 25% of family income spent on health respectively. At a global UHC score of 67, the maternal mortality ratio was 132/per 100,000 live births, neonatal mortality rate, and infant mortality rates were 13, and 26 per 1,000 live births, respectively, which are below the respective SDG targets. Unimmunized (zero dose) infants increased by 5 million between 2019 and 2021. Health insurance coverage remains low with about one billion or 13% of the world population impoverished by catastrophic health expenditures. To meet the SDG target by 2030 SDG, the time for nations to act is now.
National AIDS, STI, and Viral Hepatitis Control Program (NASCP), Federal Ministry of Health, Abuja, Nigeria
*Address all correspondence to: alobogab@gmail.com
1. Introduction
According to the World Health UHC global road map, the universal health coverage index increased from 45 in 2000 to 67 in 2019 with the fastest growth coming from sub-Saharan Africa at an average rate of 2.6% per year from 2010 to 2019. The global life expectancy increased from 66.8 years in 2000 to 73.3 years in 2019. The UHC scores vary across different countries. It spanned from over 95% in Japan and Iceland to less than 25% in Somalia and the Central African Republic [1]. Similarly, the number of health workers increased globally by 29%. Despite the improved global UHC scores and increased number of health workers, about 5 million under-five children died in 2020. The number of zero-dose of immunized children increased by 5 million in 2021 when compared to 2019. In 2017, the maternal mortality ratio was 211 per 100, 000 live births against the sustainable development goal target of 70 per 100,000 live births. There is also a drag in the communicable disease prevalence with malaria being off target by 40%, and HIV incidence dropping by only 39% as against the target of 75%. Targets for noncommunicable diseases were also off-target [1]. The road map gave the following recommendations:
Countries were generally encouraged to invest more and better in one national plan with government financing. This is necessary because higher health expenditures are associated with lower out-of-pocket expenditures.
Prioritizing primary health care as a foundation for UHC, health security, and better health outcomes.
Provision of equitable health services by leaving no one behind, informed by equity-oriented research, and data for decision-making.
Providing opportunities for multi-sectoral and multilateral collaborations.
Continuous tracking of progress and accountabilities on coverage with a focus on those left behind.
Health insurance is described as a contract between a company and a consumer in which the company agrees to pay all or some of the insured person’s healthcare costs in return for payment of a monthly premium [2]. According to the Encyclopedia Britannica, health insurance is a system for the financing of medical expenses by means of contributions or taxes paid into a common fund to pay for all or part of health services specified in an insurance policy or the law. When the financing is by a private organization or health insurance company through a contract, it is called private or voluntary health insurance but when it is financed by legally mandated compulsory contributions or by taxes and whose provisions are specified by legal statutes, it is known as government insurance or social insurance [3].
There are different models of health insurance, such as the single-payer model as operational in the United Kingdom, Spain, New Zealand, and Cuba, where the government provides free health care from revenue generated from taxes. In the social health insurance model, everyone buys insurance usually through deductions made by their employers as obtained in Germany, France, Belgium, the Netherlands, Japan, and Switzerland. In the national health insurance model, public health insurance is used to pay for private practice health care as obtained in Canada, Taiwan, and South Korea. Health insurance has many advantages such as lowering health and administrative costs, standardization of services, prevention of future social and health costs, and healthier life choices. The challenges are healthy people pay for the sickest, it has lesser financial incentives to stay healthy, it’s associated with high waiting time, incentivizing health workers to lower quality due to cost is common, and the inability of the government to fund it [4]. In OECD countries, around 10% of healthcare spending is from private health insurance in 2019. In over 50% of the countries, the private health expenditure is around 5%. This marks a growth of about 1% when compared to the figure in 2005. However, there are widespread variations between countries from 0.2% in the Czech Republic to 58.5% in the Netherlands [5].
Health insurance across the global health system becomes imperative as we approach the 2030 sustainable development goal targets adopted by many nations in the world. While substantial progress has been achieved between 2015 and today, much remains to be done to bring about 1 billion global population with impoverishing health expenditures into some form of financial risk protection through health insurance and other mechanisms.
The aim of the chapter is to present the global progress on universal health coverage across different health systems, health insurance coverage, health financing, financial risk protection, catastrophic health expenditures, and key health indices by regions and countries.
The methodological approach involves extensive literature reviews of contemporary issues and progress made toward financial risk protection and implementation of national health insurance schemes by regions and countries, including progress made toward reduction in impoverishing and catastrophic health expenditures. In almost all cases, current issues from 2020 till date were referenced. Information was sourced from reputable organizations such as World Health, World Bank, OECD, Commonwealth Funds, United Nations, and systematic reviews among others with no personal opinion included.
1.1 Key findings
Globally, the ratio of out-of-pocket expenditure to the total health expenditure fell from 19% in 2000 to 16% in 2020 with the largest drop coming between 2018 and 2020. About 1 billion people had catastrophic health expenditures in 2020.
On a scale of 1–100, the global UHC was 67. Between 2000 and 2017, catastrophic health expenditures increased by 3 and 1%, using 10 and 25% of family income spent on healthcare services, respectively. The global subjective feelings of well-being were 5 on a scale of 1–10.
Among OECD countries, the United States with UHC score of 83 met most of the SDG targets, but many health indices were poorer than many other high-income countries despite spending more on health per capita than them.
Sub-Saharan Africa needs concerted efforts to meet the SDG targets. The UHC score was 44 with many of the SDG indicators about five times lower than the SDG targets. Almost all the building blocks of health system strengthening require improvement.
Asia and the Pacific home to about 60% of the global population have the highest catastrophic health expenditures. Most countries in the region have UCH score above the global average. Health financing improved but would require more investments. The region is on track to meeting the SDG targets with moderate efforts based on current health indices.
India has the largest national health insurance scheme in the world with the potential to reach about 500 million people. The country’s UHC is 61 with many health indices about two to three times lower than the SDG targets. The success of the health insurance scheme would significantly minimize out-of-pocket expenditures.
China with a UHC score of 82 has met most of the SDG health targets. With subjective feeling of well-being at 5.9, the health system would require more high-quality, value-based, and equitable health services. Health insurance coverage improved from 22.1% in 2003 to 95.1% in 2013, and a drop in out-of-pocket expenditure followed this from 60.1% in 2000 to 35.9% in 2016.
Nigeria with a UHC of 44 and many health indices about 10 times lower than the SDG targets requires substantial efforts and investment. Only about 10% of the population have a form of health insurance. The implementation of the basic health care provision fund and the launch of the National Health Act in 2022 mandating every citizen to enroll in the national and state health insurance agencies is a bold step, which, if well implemented, can provide the needed financial risk protection and improve access to health services.
1.2 Chapter structure
The chapter started with brief introduction, definition of key terms, review of global out-of-pocket expenditures, trends in catastrophic health expenditures, progress toward UHC, and related key health indices. It progressed with review of health systems across global regions and selected countries. It concluded with references.
2. Review of progress toward universal health coverage
Financial risk protection is necessary for all people to prevent unexpected illnesses from pushing people into abject poverty by selling assets, using up family savings, and forcing indebtedness to access healthcare. According to the World Health, Universal health coverage (UHC) means that all people have access to the full range of quality health services they need, when and where they need them, without financial hardship. It covers the full continuum of essential health services, from health promotion to prevention, treatment, rehabilitation, and palliative care across the human life course. UHC is measured by tracking coverage of essential health services and catastrophic health spending [6].
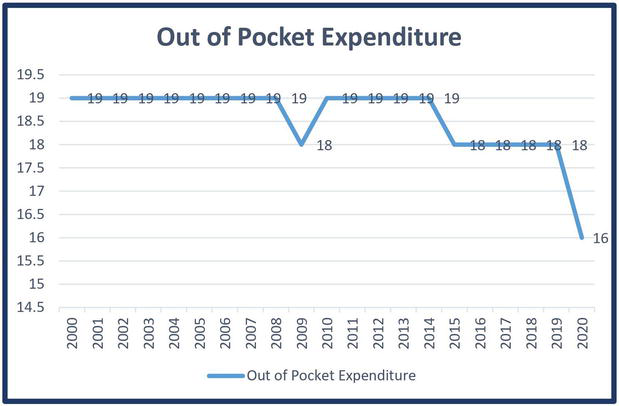
The ratio of the global out-of-pocket expenditure to the total health expenditures has been progressively dropping from 2000 to 2020 (Figure 1 and Table 1). The ratio dropped from 19% in 2000 to 16% in 2020 [7]. Contrasting this drop, the percentage of the global population with catastrophic health expenditure increased between 2000 and 2017. Catastrophic health expenditure is defined as the population with large out-of-pocket spending in relation to household consumption or income with “large” defined using two thresholds of 10 and 25% of the income [8].
Figure 1.
Global trend in the ratio of out of pocket expenditures to countries health expenditures.
Country name
2000
2001
2002
2003
2004
2005
2006
2007
2008
2009
2010
2011
2012
2013
2014
2015
2016
2017
2018
2019
2020
Differences between 2000 and 2020
Africa Eastern and Southern
22
23
24
21
20
20
20
21
21
18
18
17
17
19
18
19
19
17
15
16
15
7
Africa Western and Central
63
62
64
67
62
62
64
64
65
65
65
64
63
62
62
61
63
64
62
60
58
5
Arab World
38
36
37
36
36
35
34
35
35
32
33
31
31
30
28
30
29
27
27
33
31
7
Central Europe and the Baltics
24
24
22
22
24
23
23
23
22
22
22
23
23
22
22
22
22
22
21
21
19
4
East Asia and Pacific (excluding high income)
56
59
58
56
55
55
52
48
46
43
41
41
40
39
37
35
36
36
36
35
35
21
Europe and Central Asia (excluding high income)
33
32
31
31
32
32
31
31
31
31
32
33
32
34
34
35
36
37
37
36
30
3
Europe and Central Asia
17
17
17
17
17
17
17
17
17
17
17
18
18
18
18
18
18
18
18
18
16
1
Euro area
15
15
15
15
16
15
16
16
16
15
15
16
16
16
16
16
16
16
16
16
14
1
European Union
16
16
16
16
16
16
16
16
16
16
16
16
16
16
16
16
16
16
16
16
14
1
Fragile and conflict affected situations
49
48
49
51
47
48
45
45
48
47
48
48
48
51
50
52
54
52
53
53
52
↑3
Latin America and Caribbean (excluding high income)
38
40
42
42
41
41
39
37
35
33
31
31
31
30
30
28
28
27
28
28
26
12
Latin America and Caribbean
38
40
41
41
40
41
39
37
35
34
32
31
31
30
30
28
29
28
29
28
26
12
Middle East and North Africa
38
38
37
37
38
38
36
36
37
36
38
36
36
32
29
31
30
28
28
32
30
8
Middle East and North Africa (excluding high income)
54
53
51
50
50
51
49
49
48
49
51
50
50
48
44
46
46
44
42
44
42
12
OECD members
17
16
16
16
16
16
16
16
16
15
15
15
15
15
15
14
14
14
14
14
12
4
Other small states
28
28
28
26
26
26
26
26
28
27
25
24
22
22
22
20
21
22
22
21
18
9
Sub-Saharan Africa (excluding high income)
32
34
36
36
33
33
34
34
36
33
31
31
31
33
34
34
34
32
29
30
30
2
Sub-Saharan Africa
32
34
36
36
33
33
34
34
36
33
31
31
31
33
34
34
34
32
29
30
30
2
East Asia and Pacific (IDA and IBRD countries)
56
59
58
56
55
55
52
48
46
43
41
41
40
39
37
35
36
36
36
35
35
21
Europe and Central Asia (IDA and IBRD countries)
32
31
29
29
31
30
30
30
29
29
30
31
31
31
32
32
33
33
32
32
27
4
Latin America and the Caribbean (IDA and IBRD countries)
39
40
42
42
41
41
39
38
36
34
32
31
31
30
30
29
29
28
29
29
27
12
Middle East and North Africa (IDA and IBRD countries)
A total of 10% of family income used for health expenditure increased from 579 million people (8.4%) in 2000 to 996.3 million people (11.1%) in 2017. This implies an increase of about 3%. In the same period, 25% of family income used on health increased from 131.3 million people (1.9%) in 2000 to 289 million people (2.8%) in 2017. This implies an increase of about 1% (details in Table 1 and Figure 1).
Noncommunicable diseases remain a major challenge to achieving UHC despite accounting for 60% of disability-adjusted life years and 70% of global mortalities. LIC and LMIC account for 78% and 82% of the global mortalities and morbidities due to NCDs, respectively [9]. With efficient use of health resources, about $1398 is needed per capita in order to achieve 80% of the UHC coverage index [1]. In 2019, 17% of countries fell below the UHC index of 45 with 56% and 44% being low income and low-medium income countries, respectively. Although the percentages of countries’ gross domestic products spent on health appear similar, the per capita health expenditures for LIC and LMIC were low at $43 and $138, respectively due to relatively lower GDP making it difficult to achieve 80% of UHC indices at the projected cost of $1398. Health funding in many of these countries relies on donors implying that these countries need to play more active roles [9].
In Table 1, apart from regions classified as fragile and conflict-affected situations, the ratio of out-of-pocket expenditure to the overall regional health expenditures dropped globally in 2020 when compared with 2000 with the highest drops coming from East and South Asia, the Pacific, heavily indebted poor countries (HIPC), Latin America, and the Caribbean (excluding high-income countries). The lowest drops were from sub-Saharan Africa, least developed countries, the European Union, Eurozone, and Central Asia.
Apart from North America, Europe, and Central Asia, catastrophic health expenditure using the 10% threshold of family income used on healthcare spending increased globally between 2000 and 2017. The highest increase was from East Asia and the Pacific, the Middle East and North Africa, and South Asia. Using the 25% threshold, sub-Saharan Africa has the highest improvement with a drop of 0.6%. There were drops also in North America, Europe, and Central Asia. These pose a lot of implications in the attempt to reduce global out-of-pocket expenditures as regions with the highest populations also have the highest increase in numbers of families with catastrophic health expenditures in both the 10 and 25% thresholds.
With many years of cross-fertilization of ideas and experiences globally, including medical research and a large burden of evidence, the drivers of poor health indices are well understood. A high UHC score using the SDG 3 indices has been consistently associated with improved healthcare delivery, including the subjective feeling of well-being by health users. The global UHC score (Table 2) is about 67, and this was associated with a maternal mortality ratio of 132/100,000 live births and neonatal and infant mortality rates of 13 and 26 per 1000 live births, respectively. This score was also associated with a subjective feeling of well-being of five and a life expectancy of 73 years. Having a UHC score of 80 and above correlates with many positive health outcomes such as skilled birth attendants at birth, subjective well-being, and life expectancy. In these selected countries (Table 2), Canada, United Kingdom, Germany, Japan, France, and the United States with high UHC scores of over 80 have a higher life expectancy at birth, skilled birth attendants during deliveries, better subjective feeling of well-being, very low maternal mortality ratio, low neonatal and under-five mortality rates, and high immunization uptake for children. Mortalities due to noncommunicable diseases were also lower. Nigeria, Bangladesh, Kenya Indonesia, and India with UHC scores of about 60 and below also have poorer indices across all spectrums with the health indices below the global averages. High UHC scores were also positively correlated with good health indices in wealthier nations classified as upper middle and high-income as against low-income and lower-middle-income countries. OECD countries with high UHC also have better health indices, while the poorest indices came from Oceania and sub-Saharan Africa, which also have the lowest UHC scores (Table 3).
Region (10%) (Household income)
Population in million (2000)
Population in million (2017)
Region (10%) (Household income)
Population 2000 percentage
Population 2017 (%)
Differences
East Asia and Pacific
189.1
412.7
East Asia and Pacific
9.1%
17.6%
−8.5%
Europe and Central Asia
62.6
62.3
Europe and Central Asia
7.3%
6.8%
0.5%
Latin America and Caribbean
37.6
55
Latin America and Caribbean
7.2%
8.7%
−1.5%
Middle East and North Africa
25.3
68.1
Middle East and North Africa
8.0%
15.4%
−7.4%
North America
17.7
15.9
North America
5.7%
4.4%
1.3%
South Asia
195.2
294.9
South Asia
14.0%
16.5%
−2.5%
Sub-Saharan Africa
51.5
87.4
Sub-Saharan Africa
7.7%
8.3%
−0.6%
Summaries
579
996.3
Summaries
8.4%
11.1%
−2.7%
Region (25%) (Household income)
Population in million (2000)
Population in million (2017)
Region (25%) (Household income)
Population 2000 percentage
Population 2017 (%)
Differences
East Asia and Pacific
47.7
128.5
East Asia and Pacific
2.3%
5.5%
−3.2%
Europe and Central Asia
9.6
9.1
Europe and Central Asia
1.1%
1.0%
0.1%
Latin America and Caribbean
6.1
10.1
Latin America and Caribbean
1.2%
1.6%
−0.4%
Middle East and North Africa
5.8
13.3
Middle East and North Africa
1.8%
3.0%
−1.2%
North America
3.2
2.5
North America
1.0%
0.7%
0.3%
South Asia
41.3
105.5
South Asia
3.0%
5.9%
−2.9%
Sub-Saharan Africa
17.6
20.9
Sub-Saharan Africa
2.6%
2.0%
0.6%
Summaries
131.3
289.9
Summaries
1.9%
2.8%
−1.0%
Table 2.
Global trends in catastrophic health expenditures.
Note: Catastrophic health expenditures are defined as the population with large out-of-pocket spending in relation to household consumption or income with “large” defined using two thresholds 10% and 25% of the income. Adapted from World Bank. Universal health coverage data. Trends in catastrophic health expenditure. (Amount of Household income on out-of-pocket health expenditure). Available at https://datatopics.worldbank.org/universal-health-coverage/
Country
Universal health coverage (UHC) index of service coverage (worst 0–100 best)
Maternal mortality rate (per 100,000 live births)
Neonatal mortality rate (per 1000 live births)
Mortality rate, under-5 (per 1000 live births)
Surviving infants who received 2 WHO-recommended vaccines (%)
Births attended by skilled health personnel (%)
Age-standardized death rate due to cardiovascular disease, cancer, diabetes, or chronic respiratory disease in adults aged 30–70 years (%)
Subjective Well-being-Scale 1–10 (2022)
Life expectancy at birth (years)
Bangladesh
51
123
16
27.3
97
59
18.9
3.4
74.3
Brazil
75
72.2
8.5
14.4
68
99.1
15.5
6.3
75.9
Canada
89
11
3.4
5
90
98
9.6
6.9
82.2
China
82
23.1
3.2
6..9
99
99.9
15.9
5.9
77.4
France
84
7.9
2.5
4.4
92
97.6
10.6
6.6
82.5
Germany
86
4.4
2.2
3.6
91
96.2
12.1
6.6
81.7
India
61
102.7
19.1
30.6
85
89.4
21.9
3.9
70.8
Indonesia
59
172.9
11.3
22.2
67
94.7
24.8
5.6
71.3
Iran
77
22
8.1
12.6
98
99
14.8
5
77.4
Japan
85
4.3
0.8
2.3
96
99.9
8.3
6.2
84.3
Kenya
56
530
18.4
37.2
89
70.2
21
4.4
66.1
Latin America
73
90.2
9.2
16.2
71
95.4
15.5
6.1
75.6
Nigeria
44
1047
34.9
115.2
80
43.3
16.9
4.5
62.6
Russia
75
13.7
2
5.1
97
99.6
24.2
6
73.2
South Africa
67
126.8
11
32.8
86
96.7
24.1
5.6
65.3
United Kingdom
88
9.8
2.8
4.2
91
NA
10.3
6.7
81.4
United States
83
21.1
3.3
6.2
91
99
13.6
6.7
78.5
World
67
131.5
12.7
25.8
84
88.6
19
5.2
73.3
High-Income Countries
83
11.1
2.5
4.6
92
98.8
11.9
6.6
80.7
Low-Income Countries
42
382.5
25.9
63.9
65
67
23.5
3.7
65
Lower- Middle Income Countries
58
190.1
19.3
37
80
82.1
22.2
4.5
70.1
Upper- Middle Income Countries
78
38.6
5
9.9
92
99
16.6
5.9
76.4
World
6.7
131.5
12.7
25.8
84
88.6
19
5.2
73.3
East And South Asia
68
82.4
13
22.2
88
90.8
20.1
5
73.3
Eastern Europe and Central Asia
69
80.6
7.7
13.9
89
95.3
25.2
5.3
72.4
Middle East and North Africa
68
47.3
11.1
19.8
88
92
21.3
4.7
74
Oceania
37
168.9
19.1
38.9
41
64
36.4
65.6
OECD
83
18.1
3.3
5.8
91
98.6
11.9
6.5
80.4
Sub-Saharan Africa
44
491.1
26.4
70.1
67
64.7
21.3
4.3
64.3
World
67
131.5
12.7
25.8
84
88.6
19
5.2
73.3
Table 3.
Universal health coverage and multiple health indices.
3. Health care systems across the world: What works and why it matters now?
3.1 United States health system
The United States has not achieved universal health coverage despite investing more in health per capita compared to other high-income countries. There are still many uninsured people in the country affected by healthcare costs. Among high-income countries, the US has the lowest life expectancy at birth and a higher death rate from preventable causes of death. Higher maternal and infant mortalities including high suicide rate. The country also has a higher incidence of multiple chronic medical conditions and obesity. The health-seeking behavior is also lower as Americans see fewer physicians, including having a lower ratio of physicians and hospital beds per 1000 population. The country however screens more people for breast and colorectal cancer, including flu vaccines [10].
According to the 2020 Census Bureau, 8.6% do not have any form of health insurance. Of those insured, the private sector accounted for 66.5% of the population. The employment-based insurance accounts for 54.4% of the insured. The public health insurance marginally grew from 34.4% in 2018 to 34.8% in 2020. Within the same period, the number of uninsured children less than 19 years old rose from about 7.7 to 9.3% [11].
The system is described as a high cost providing lower coverage to the people and lower quality of healthcare services commensurate with the investment. To address these, the following have been recommended: Health coverage decisions should be based on how much such services benefit the people rather than how much is spent. In addition, there is a need for consensus on the minimal criteria for people to be enrolled. The need to unbundle the one size fits all in public investment to enable users to have the option of determining how much is paid for services by different individuals in line with differential needs and expectations. The third recommendation is how people can easily fund additional care outside those covered by the subsidies [12].
According to the 2023 Scorecard of America’s Health System as reported by the Commonwealth Fund, Massachusetts, Hawaii, and New Hampshire were the best-performing states with Oklahoma, West Virginia, and Mississippi being the least performing. COVID-19 reduced life expectancy generally. Health system performance covered the uninsured leading to minimal morbidities but the policies lacked sustenance. Some of the recommendations were for the government to close the coverage gap to increase the number of insured, improve cost protection for those on subsidiary coverage, and reduce barriers to reproductive, preventive, and behavioral health [13].
There have been several health reforms in the United States with many positive outcomes, including Medicare and Medicaid. A seven-year review (2014–2020) of Medicaid expansion under the Affordable Care Act found an overall increase in insurance coverage when expanded states were compared to non-expanded states with the increase cutting across adults in rural and urban groups, different racial/ethnic communities, and most of the vulnerable populations. Despite the increased number of uninsured people nationally, they remained stable in the expanded states. Private coverage marginally decreased. Medicaid expansion generally has positive health outcomes, access to care, affordability, and financial security [14]. Building on these successes, a review of studies between February 2020 and March 2021, shows a positive effect of Medicaid on mortalities, cancer, chronic diseases, disabilities, and sexual and reproductive health. There were also improvements in behavioral and other social determinants of health in addition to positive economic impacts on states and providers [15, 16].
3.2 Sub-Saharan Africa
Sub-Saharan Africa is not on course to meet the sustainable development targets by 2030. The maternal mortality ratio is about 390 deaths per 100,000 live births, which is more than the global average of 211/100,000 live births and about five times the SDG target of 70/100,000 live births. The infant mortality rate is 72/1000 live births, which is about three times the SDG target of 25. Half of the deaths are neonatal predominately occurring on the day of birth and immediate peripartum period. With an annual decline of 3.1% in infant mortality rates, it would be 54/1000 live births by 2030. About 56.3% of women of reproductive age in the region have their family planning needs met compared to the global average of 77%. Skilled birth attendance is 65% compared to the SDG target of 90% [17].
Many nations in sub-Saharan Africa are among the low- and medium-income countries with multiple challenges in the health system. Almost all the building blocks of health system strengthening are affected, particularly healthcare financing, leadership, and weak and non-resilient health systems, including epidemiological and demographic challenges. In most of these countries, about 75 dollars is spent per capita on health compared to $850 in high-income countries. While health insurance would help very well in financial risk protection, strengthening the primary health care system is another very important area requiring strengthening, particularly in countries in the region classified as LMICs [18]. The need for private sector investment in the health sector is very important in Africa following the inability of the government to meet the needs of healthcare financing. A literature review revealed poor health financing, corruption, and bureaucracy as major reasons for the government to effectively deliver on health. The need for better participation of private sector and philanthropic organizations is necessary to attain UHC [19]. It is believed that current health resources in sub-Saharan Africa can only improve UHC by about 19%, improving education, governance systems, and healthcare financing are necessary for the reduction of out-of-pocket expenditures and donor dependence [20]. Even when available, health insurance has not drastically reduced catastrophic health expenditures in Africa due to the design of national health insurance schemes. Investment in research on NHI, compulsory national health insurance programming, and inter-sectoral collaborations are necessary for West African regions to reduce impoverishing health expenditures and increase financial risk protection [21].
3.3 Asia and Pacific
Asia-Pacific is home to 60% of the world’s population implying that health challenges in this region would affect the global indices drastically. Emerging challenges in these regions are the aging population with about 25% of the population above 60 years. With this aging demography, susceptibility to noncommunicable diseases, such as hypertension, diabetes, and cancers, is high. The region is characterized by a large out-of-pocket expenditure a factor that was exacerbated by the COVID-19 pandemic. The region needs to improve efficiency, optimize resources, and have patient-centered outcomes [22]. Life expectancy in this region decreased by 1 year due to the COVID-19 pandemic. The neonatal mortality rate was 15.8 per 1000 live births, and the maternal mortality ratio was 140 per 100,000 live births among countries in this region classified as lower-middle and low-income. Between 2010 and 2019, healthcare expenditures increased by 41.4, 62.5, and 74.1% for countries in these regions classified as lower-middle, low-income, upper-middle, and high-income countries, respectively [23].
Challenges facing Southeast Asia countries are unsustainable revenue-raising approaches, fragmented health insurance schemes, discordance between insurance benefits and people’s needs, low political will, rising healthcare costs, and the attitude of caregivers and managers. To address these, countries within the region should address sustainable health financing, innovative digital technologies, and adaptable health systems tailored to prevailing needs [24].
A landscape review of Cambodia, India, Indonesia, the Philippines, Thailand, and Vietnam on UHC for key populations in southeast Asia found barriers such as lack of awareness, complicated administrative processes, documentation issues, co-payments or facility fees, stigma, discrimination, and weak data privacy systems. Some of these barriers can be reduced through improved legislation and regulation of health insurance schemes with particular emphasis on key populations, provision of comprehensive HIV service coverage, strengthening confidentialities, addressing knowledge gaps, sound financing strategies, partnership with civil society organizations, reduction in vertical programming, adopting multispectral approach, and strengthening transition and sustainability plans [25].
3.4 India
With a population of 1.4 billion, India accounts for about 18% of the global population. The under-five, infant, and neonatal mortality rates were 31, 25, and 19%, respectively. The ANC utilization rate was 59%, while skilled birth attendance and postnatal care were 89 and 61%, respectively [26]. To achieve the sustainable development goal three, India launched the Ayushman Bharat in 2017 with a commitment to leave no one behind. It adopted a continuum of care covering health and wellness centers and a health insurance scheme called Pradhan Mantri Jan Arogya Yojana. The Ayushman Bharat PM-JAY is the largest health assurance scheme in the world targeting 40% of the population. It was designed to provide cashless access to healthcare services and reduce catastrophic health spending with the aim of UHC in the country [27].
Much has been achieved in the Indian health system. Life expectancy increased from 47.7 years in 1970 to 69.5 years in 2020. The maternal mortality ratio decreased from 301 in 2003 to 130 in 2016. Noncommunicable diseases remain a challenge with ischemic heart disease, chronic obstructive pulmonary diseases, and cardiovascular accidents, being the leading causes of mortalities. About 70 and 58% of outpatient and inpatient health services are provided by private or nonprofit organizations. Common challenges include quality of healthcare services, accessibility, and affordability of services, including ready availability of essential medicines and diagnostics [28]. The commitment of the government to achieving UHC is commendable through the launch of the largest health insurance scheme in the world.
3.5 China
China is committed to UHC and a Healthy China by 2030. Health insurance coverage improved from 22.1% in 2003 to 95.1% in 2013, and a drop in out-of-pocket expenditure followed this from 60.1% in 2000 to 35.9% in 2016. Within these intervention periods, life expectancy increased from 72.0 to 76.4 years, the maternal mortality ratio dropped from 59 to 29 per 100,000 live births, the under-five mortality from 36.8 to 9.3 per 100 live births, similarly, the neonatal mortality rate dropped from 21.4 to 4.7 per 1000 live birth from data reviewed between 2000 and 2017. Few challenges remain such as the need for high-quality, value-based, and more equitable health services [29]. A review of 24 service coverage indices between 1993 and 2018 showed that prevention indices increased from 65.5 to 87.7%, and treatment indices increased from 57.1 to 75.5%. Inequitable services increased during the period. It is projected that, apart from noncommunicable diseases, most indicators will achieve 80% by 2030 with prevention and treatment projected to reach 92.7 and 83.2%, respectively by 2030. Despite all these, catastrophic health expenditure and inequity remain large. It is recommended that the systems need to prioritize integrated service delivery at the primary health care levels and provision of better financial protection [30].
3.6 Nigeria
Nigeria is the largest country in Africa in terms of population. Despite having the highest maternal mortality ratio, under-five mortality rate, lowest numbers of unimmunized children, and lowest numbers of skilled birth attendance in the world, only 10% of the country has any form of health insurance for financial risk protection. The introduction of the National Health Insurance Act in 2022 making it mandatory for all Nigerians to have a form of insurance was a very important intervention aimed at ensuring UHC in the country. The act has the authority to regulate, promote, manage, and integrate all health insurance schemes and practices in the country. It further has special coverage for vulnerable groups [31].
Knowledge about health insurance is limited, including the ability to monitor progress toward UHC. Although the country has implemented the basic health care provision fund, which is a laudable intervention ability to fund it, may be a challenge. The country also has poor capacity for health insurance implementation, poor communication, and poor stakeholder management. This would require interagency collaboration and capacity-building strategies (Table 4) [32].
Countries/Regions
Challenges
Recommendations
1.
Globally
UHC score of 67.
Invest in one national health plan with government financing, prioritizing PHC, equitable services, accountability in health care using research, and multispectral collaborations [1].
2.
OECD Countries* United States health system
About 8.6% do not have any form of health insurance [11].
Higher per capita expenditure on health but more morbidities and mortalities [10].
Unbundling of one-size-fits-all, Users ability to determine how much is paid and how people can fund additional care [12].
Close coverage gaps, improve cost protection, and reduce barriers to reproductive, preventive, and behavioral health [13].
Improved research, and scale-up of national health insurance coverage [21].
4.
Asia and the Pacific
Fragmented health insurance schemes, discordance between insurance benefits and people’s needs, low Political will, rising healthcare costs, and the attitude of caregivers [24].
Key population lack of awareness, stigma, discrimination, and weak data privacy [25].
There is a need for sustainable health financing, innovative digital technologies, and adaptable health systems tailored to prevailing needs [24].
There has been very laudable significant progress by many nations globally on financial risk protection from health expenditures. The universal health coverage index is improving progressively including life expectancy and many other indices, such as maternal and child health. While many countries in the world have met the sustainable development goal targets and others are on track, countries in sub-Saharan Africa appear to be left behind. Although the ratio of out-of-pocket expenditure to total expenditure on health is decreasing globally, about 11.1 and 2.8% of the global population continue to suffer from catastrophic health expenditures, using about 10 and 25% of family income on health expenditure. Regions with the highest burden of diseases have the lowest per capita health expenditure and lowest UHC scores. The World Health recommends a nationally driven health insurance scheme and prioritization of primary health care to meet sustainable development goal three. With a few years to the sustainable development goal target, high numbers of uninsured population with about 1 billion or 13% of the world population impoverished by catastrophic health expenditures, the time to act is now.
References
1.Lozano R, Fullman N, Mumford JE, Knight M, Barthelemy CM, Abbafati C, et al. Measuring universal health coverage based on an index of effective coverage of health services in 204 countries and territories, 1990–2019: A systematic analysis for the global burden of disease study 2019. Lancet. 2020;396(10258):1250-1284
2.Investopedia. Health Insurance: Definition, How it Works. Available from: https://www.bu.edu/law/files/2016/01/EllisPaper.pdf
3.Encyclopaedia Britannica. Britannica Money. Health Insurance. Available from: https://www.britannica.com/money/health-insurance
4.Balance. What Is Universal Health Care. Available from: https://www.thebalancemoney.com/universal-health-care-4156211
5.OECD. Private Health Insurance. Private Health Insurance Spending-Brief 2022. Available from: https://www.oecd.org/health/Spending-on-private-health-insurance-Brief-March-2022.pdf
6.WHO. Universal Health Coverage (UHC). Available from: https://www.who.int/news-room/fact-sheets/detail/universal-health-.coverage-(uhc)
7.World Bank. Out-of-Pocket Expenditure (Percentage of Current Health Expenditure). Available from: https://data.worldbank.org/indicator/SH.XPD.OOPC.CH.ZS
8.World Bank. Universal Health Coverage Data. Trends in Catastrophic Health Expenditure. (Amount of Household Income on Out-of-Pocket Health Expenditure). Available from: https://datatopics.worldbank.org/universal-health-coverage/
9.Adedeji O. Global health–Is universal health coverage achievable? Journal of Global Medicine. 2021. Available from: https://www.researchgate.net/publication/349655568_Global_health_-_Is_universal_health_coverage_achievable
10.The Commonwealth Fund. 2023 Scorecard on State Health System Performance. Available from: https://www.commonwealthfund.org/publications/scorecard/2023/jun/2023-scorecard-state-health-system-performance
11.United States Census Bureau. Health Insurance Coverage in United States: 2020. Available from: https://www.census.gov/library/publications/2021/demo/p60-274.html
12.Baicker K, Chandra A, Shepard M. A different framework to achieve universal coverage in the US. JAMA Health Forum. 2023;4(2):e230187. DOI: 10.1001/jamahealthforum.2023.0187
13.The Commonwealth Fund. Improving Quality of Care. U.S. Health Care from a Global Perspective, 2022: Accelerating Spending, Worsening Outcomes. Available from: https://www.commonwealthfund.org/publications/issue-briefs/2023/jan/us-health-care-global-perspective-2022
14.KFF. The Effects of Medicaid Expansion under the ACA: Studies from January 2014 to January 2020. Medicaid. Available from: https://www.kff.org/medicaid/report/the-effects-of-medicaid-expansion-under-the-aca-updated-findings-from-a-literature-review/
15.KFF. Building on the Evidence Base: Studies on the Effects of Medicaid Expansion, February 2020 to March 2021. Medicaid. Available from: https://www.kff.org/medicaid/report/building-on-the-evidence-base-studies-on-the-effects-of-medicaid-expansion-february-2020-to-march-2021/
16.Sustainable Development Goals. SDG Indicators. Metadata Repository. Available from: https://view.officeapps.live.com/op/view.aspx?src=https%3A%2F%2Funstats.un.org%2Fsdgs%2Fmetadata%2Ffiles%2FMetadata-03-08-01.docx&wdOrigin=BROWSELINK
17.WHO Africa. Africa’s Advances in Maternal, Infant Mortality Face Setbacks: WHO Report (01 December 2022). Available from: https://www.afro.who.int/news/africas-advances-maternal-infant-mortality-face-setbacks-who-report
18.Kodali PB. Achieving universal health coverage in low- and middle-income countries: Challenges for policy post-pandemic and beyond. Risk Management and Healthcare Policy. 2023;16:607-621. DOI: 10.2147/RMHP.S366759
19.Salawu MM, Onwujekwe O, Fawole OI. Innovative strategies to strengthen health service delivery for universal health coverage in Africa–A scoping literature review. South Eastern European Journal of Public Health. 2023;2:1. DOI: 10.56801/seejph.vi.214
20.Arhin K, Oteng-Abayie EF, Novignon J. Assessing the efficiency of health systems in achieving the universal health coverage goal: Evidence from sub-Saharan Africa. Health Economics Review. 2023;13:25. DOI: 10.1186/s13561-023-00433-y
21.Odonkor SNNT, Koranteng F, Appiah-Danquah M, Dini L. Do national health insurance schemes guarantee financial risk protection in the drive towards universal health coverage in West Africa? A systematic review of observational studies. PLOS Global Public Health. 2023;3(8):e0001286. DOI: 10.1371/journal.pgph.0001286
22.World Economic Forum. Charting a Course to Remodel Universal Healthcare in the Asia-Pacific. 2021. Available from: https://www.weforum.org/agenda/2021/11/how-to-remodel-universal-healthcare-in-the-asia-pacific/
23.OECD/WHO. Health at a Glance: Asia/Pacific 2022: Measuring Progress Towards Universal Health Coverage. Paris: OECD Publishing; 2022. DOI: 10.1787/c7467f62-en
24.Lim MY, Kamaruzaman HF, Wu O, Geue C. Health financing challenges in southeast Asian countries for universal health coverage: A systematic review. Archives of Public Health. 2023;81(1):148. DOI: 10.1186/s13690-023-01159-3
25.UNIADS. Key Populations are Being Left behind in Universal Health Coverage: Landscape Review of Health Insurance Schemes in the Asia-Pacific Region. 2022. Available from: https://www.aidsdatahub.org/sites/default/files/resource/unaids-key-populations-uhc-asia-pacific-2022.pdf
26.UNICEF Data. Country Profiles. India. Available from: https://data.unicef.org/country/ind/
27.National Health Authority. About Pradhan Mantri Jan Arogya Yojana. 2019. Available from: https://nha.gov.in/PM-JAY#:∼:text=Ayushman%20Bharat%2C%20a%20flagship%20scheme%20of%20Government%20ofcommitment%2C%20which%20is%20to%20%22leave%20no%20one%20behind.%22
28.Selvaraj S, Karan KA, Srivastava S, Bhan N, Mukhopadhyay I. India Health System Review. New Delhi: World Health Organization, Regional Office for South-East Asia; 2022
29.Tao W, Zeng Z, Dang H, et al. Towards universal health coverage: Achievements and challenges of 10 years of healthcare reform in China. BMJ Globalization and Health. 2020;5:e002087
30.Li Y, Zhang C, Zhan P, Fu H, Yip W. Trends and projections of universal health coverage indicators in China, 1993–2030: An analysis of data from four nationwide household surveys. The Lancet Regional Health-Western Pacific. 2023;31:100646. DOI: 10.1016/j.lanwpc.2022.100646
31.Ipinnimo TM, Omotoso AA, Bamidele TA, Sanni TA, Ibirongbe DO, Ipinnimo MT, et al. Comparing the Nigeria National Health Insurance Scheme Act, 2004 and the National Health Insurance Authority Act, 2022-what is new and its implications for the health system. West African Journal of Medicine. 2023;40(5):525-532
32.Ogundeji YK, Tinuoye O, Bharali I, et al. Is Nigeria on course to achieve universal health coverage in the context of its epidemiological and financing transition? A knowledge, capacity and policy gap analysis (a qualitative study). BMJ Open. 2023;13:e064710. DOI: 10.1136/bmjopen-2022-064710
Written By
Gabriel Igbo Alobo
Submitted: 31 August 2023Reviewed: 31 August 2023Published: 13 March 2024
 Open access peer-reviewed chapter