Open Access is an initiative that aims to make scientific research freely available to all. To date our community has made over 100 million downloads. It’s based on principles of collaboration, unobstructed discovery, and, most importantly, scientific progression. As PhD students, we found it difficult to access the research we needed, so we decided to create a new Open Access publisher that levels the playing field for scientists across the world. How? By making research easy to access, and puts the academic needs of the researchers before the business interests of publishers.
We are a community of more than 103,000 authors and editors from 3,291 institutions spanning 160 countries, including Nobel Prize winners and some of the world’s most-cited researchers. Publishing on IntechOpen allows authors to earn citations and find new collaborators, meaning more people see your work not only from your own field of study, but from other related fields too.
To purchase hard copies of this book, please contact the representative in India:
CBS Publishers & Distributors Pvt. Ltd.
www.cbspd.com
|
customercare@cbspd.com
The blue duiker (Cephalophus monticola) is exclusively an African wild Bovidae. It is a principal source of protein in the African forest zones and contributes to the nutrition of local populations. The methodology used is the opportunistic method which consists of taking the heads of blue duikers from carcasses encountered randomly and opportunistically in villages, urban markets, and checkpoints. Thus, 60 skulls were collected and measured from January to December 2018. Descriptive statistics and multivariate analysis were done using SPSS version 21.0 software and XLSTAT-Pro version 7.5.2 software. The measures of the skulls (60 in total and in mm) point out that: the total length (117.36 ± 3.51; 118.23 ± 4.38 and 118.47 ± 4.09), the length of row of cheek teeth (35.35 ± 2.88; 36.39 ± 3.82 and 36.28 ± 3.67) the zygomatic arc height (10.40 ± 1.50; 11.06 ± 1.12 and 11.17 ± 1.10) in these three areas respectively indicate a significant difference (<0.05). The Principal Component Analysis (PCA) enables us to see the level of genetic variabilities of blue duiker through skull measurements. These variable measurements are close together from one to another where there is a high similarity between species. Grouping these biometric characteristics permitted us to identify three structures of the blue duiker, corresponding to the three sub-species found in Cameroon.
Biotechnology and Bio-informatics Research Unit, University of Dschang, FASA, Cameroon
University of Bertoua, Higher Institute of Agriculture, Wood, Water Resources, and Environment of Belabo, Cameroon
Felix Meutchieye
Biotechnology and Bio-informatics Research Unit, University of Dschang, FASA, Cameroon
Evaristus Tsi Angwafo
University of Bamenda, Cameroon
*Address all correspondence to: miantsiaolivier@gmail.com
1. Introduction
Global biodiversity is currently undergoing an unprecedented crisis [1, 2], to the point that some scientists are now talking about a sixth extinction [3]. Species extinction could be up to 1000 times higher than last century [4]. Some authors such as [5] argue that the consequences of these extinctions are comparable to the effects of climate change in terms of ecosystem change. This phenomenon is amplified by human actions on biodiversity, including commercial hunting, which is perceived as one of the major threats to this biodiversity. Three species alone account almost 70% of the bushmeat sold in all the markets of the country of the COMIFAC countries: the blue duiker, Cephalophus monticola; the African brush-tailed porcupine, Atherurus africanus and the Greater spot-nosed monkey, Campithecus nictitans; [6]. The blue duiker account 39% of this harvest, as the main supplier of bushmeat [7, 8]. This animal, commonly called as “hare”, is well known to forest populations for its food use. Beyond that, it could have other, little-known uses. Market observations of the carcasses of these animals show a variation in the color of the fur, ranging from dark grey to light grey to bright black. These variations in fur levels could lead to errors of assessment on the part of the population living near forests, on the one hand, and on the other hand, among urban consumers and the entire control chain.
Beyond the food discolouration and in the context of the “biodiversity crisis”, the characteristics of the blue duiker remain insufficient. However, it is the first approach for the identification and sustainable use of the species [9]. The first step in this characterization of the blue duiker is based on knowledge of the variations of the biometric features [9]. These are found on the live animal and on the skull. However, most of the phenotypes of the majority of natural animal species are not recorded, such as those of the blue duiker [10]. Furthermore, due to the lack of comprehensive information on population structure and geographical distribution, many animal populations in developing regions are commonly considered “indigenous” or “traditional”. Therefore, there is a need to establish simplified and consistent phenotypic characterization procedures to help countries conduct a more comprehensive inventory of their animal genetic resources [11].
At a time when the countries of the Congo Basin, including Cameroon, have begun the process of developing bushmeat management strategies, poor identification of blue duiker can have serious consequences on the conservation of this species whose meat is highly valued in the forest zone [12, 13, 14]. Studies of the blue duiker in Gabon and Cameroon have examined its relationship to the structure of the environment [15], its diet [16], its place among primary consumers, particularly the frugivorous [17] and its abundance [18, 19]. Relatively maneuverable and easy to capture by hunters, the blue duiker is a suitable study for better craniometric characterization [20], although according to Dubost [21], in reality, it is not easy to characterize it.
Identifying the blue duiker is essential and the foundation of any successful modern management. In recent years, the need to properly identify an animal, to trace it through the production chain and ultimately in food products, that is to say, to have traceability, has become essential in order to record the Evolution of its weight gain, fertility, susceptibility to diseases, and thus to facilitate the selection and management of genetic resources.
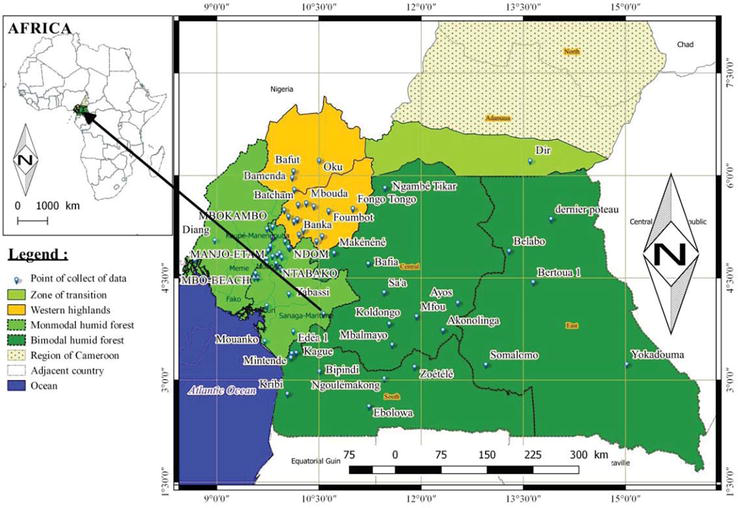
Cameroon is located in the west of the Central Sub Region of Africa, stretching from the Gulf of Guinea to Lake Chad. It falls between latitude 2° to 13° North of the equator and longitude 8° 30′ to 16° 10′ East of the Greenwich Meridian. The country covers a surface area of 475,385 km2 and has a coastline of 402 km. It is bounded to the South by the Republic of Congo, Gabon, Equatorial Guinea and the Atlantic Ocean, to the west by the Republic of Nigeria, to the North by Lake Chad and to the East by the Republic of Chad and the Central African Republic. Blue duikers are in three agro-ecological zones of Cameroon (Figure 1): Western Highlands (WH) equals zone 3 falls between latitude 4°54′ to 6°36′ North and longitude 9°18′ to 11°24′ East; Monomodal Rain Forest (MRF) equals zone 4 falls between latitude 2°6′ to 6°12′ North and longitude is 8°48′ to 10°30′ East and Bimodal Rain Forest (BRF) equals zone 5 falls between latitude 10°30′ North to longitude 16°12′ East [22].
Figure 1
Study area of blue duiker’s skull.
2.2 Data collection
The head is detached from the body by hunters or vendors using a machete. Once the head has been obtained, the skull is stripped of its skin and as much adherent flesh as possible using a very sharp knife. The lower jaw is separated and the tongue and eyes are removed; the cervical cavity is emptied of its contents. The skull and the lower jaw are emaciated as best as possible, they are immersed in a container filled with cold water for 1 or 2 days, renewing the water several times. The purpose of this operation is to purge all the blood vessels and soften the flesh in order to facilitate the rest of the work.
The skull and lower jaw are then boiled in a suitably sized container (washing pot) filled with water, taking care that the liquid still covers the skull. This cooking takes about 15–20 min.
We take out the skull and the jawbone and we strip off as much flesh and cartilage as possible with a sharp knife, pliers, a wire bent into a hook. The cooking vessel is rinsed and cleaned and the skull and jaw are returned to clean water. Boil again for a few minutes. Usually, this second boil is enough for all meat and cartilage debris to come off easily at the tip of the knife.
After checking that there are no more meaty particles left, especially in the cervical cavity, in the nasal cavities and under the millstones, the skull is rinsed with a jet of water, brushed well with an ordinary foaming detergent, rinsed again and air dried for 24 h. After these different operations, the different measurements are carried out [23]. Thus, a total of 14 cranial measurements and mass were taken. These measurements numbered from 1 to 10 are identical to those used by [24] and mainly used to identify wolf subspecies (Canis lupus). Measurements of 11, 12, 13, 14 and 16 quickly distinguish a wolf from a coyote, a wolf or a coyote from a dog as well as the whole range of their hybrids [24]. Therefore, the 15 measures retained consider that ruminants do not have canines. Thus, 60 skulls were measured at a rate of 20 (10 males and 10 females) per agro-ecological zone. According to [25], to perform craniometric measurements, five instruments are required: the vernier, the ruler, the compass, the bevel and the protractor. For our study, two instruments were used: the electronic vernier and the protractor. When using this type of vernier, it is important to check from time to time if the dial still indicates zero when the jaws are closed, otherwise, the yellow ABS button is pressed to reset to zero. The protractor is used exclusively to measure the orbital angle. To facilitate the reading of the latter, it is preferable to obtain a protractor of good size graduated to the nearest 0.5°.
The cranial measurement uses many existing possibilities [23]. The measurements enumerated from 1 to 10 are the same used by [25] and served especially for the classification of subspecies of wolf (Canis lupus). Measurements 11; 12; 13; 14 and 16 are the main ones to distinguish the Wolf of the Coyote [24]. For instance, ruminants do not have the canine, we have taken 14 measurements. Then, 60 skulls were measured haphazardly by the opportunistic method developed by [26], to evaluate the quantity of bush meat in the Central African villages. These 14 measures (in mm) have been taken by the Vernier with the skull mass (in g): total skull length, zygomatic width, jugal teeth, line length, palate maximal width, minimal palate width, postorbital apophyses width, the height between first molar and orbit, arcade zygomatic height, the fourth upper pre-molar length, second molar width, distance between the margin of the incisive row and the edge of the temporal condyle, condyle basal length, pre-maxillary width, orbiter angle and mass.
2.3 Statistical analysis
On the base of the 15 craniometrical measures, we have used statistical description. The Principal Component Analysis (PCA) has been carried out to evaluate the genetic variability of the blue duiker population studies [27]. The data analysis method is called the multivariate analysis, which consists of the transformation of the correlated variable in the new decorrelated variables from one another. These new variables are named “principal components”, or principal axes. It enables us to reduce the number of variables and to send the least redundant information. The PCA enabled us to identify the least number of components or axes with better explained data variability. It consists in compressing the whole number of random variables, the first axes of the PCA are the best choices in terms of the inertia or of the variance.
In the construction of a phylogenetic tree or dendrogram following the protocol of Hierarchy Ascending Classification (HAC), we have used the Pearson correlation to identify the genetic type and the relationship that exists between each other [28]. It is one of the statistical methods of data analysis that enabled us to divide a whole number of data into different homogenize groups. In this case, the data of each sub-whole number divides the common measurement, which often corresponds to the proximity criteria (similarities or dissimilarities) that we have defined to introduce the distance measurement and classes between objects. This technique of data analysis also enables us to hierarchy data thereby, to construct dendrograms that give evidence of the distance between groups or their similarities and dissimilarities.
Analysis of population structure has been realized by means of Factorial Discriminant Analysis (FDA) on the base of 15 measurements [27] thereby identifying the characters that distinguished better blue duikers as described. It enables us to represent graphically the different cranial measurements of blue duikers and the centre of their groups using more discriminant axes.
The software analysis SPSS version 21.0 and XLSTAT-Pro version 7.5.2. was used for data analysis.
The measurements of the skull will be of two types: the measurements (total length; zygomatic width; jugal teeth row length; maximum palate width; minimum palate width; post orbital apophyses width; orbital first molar base height; zygomatic arch height; maximum fourth premolar length upper; maximum second molar width; palate length; Condylo-basal length; pre-maxillary width; orbital angle) and the mass. These measurements are shown in Tables 1–12 according to agro-ecological zones and sex.
Agro-ecological zones
n
Skull length (mm)
Zygomatic width (mm)
CV (%)
μ ± σ
CV (%)
μ ± σ
CV (%)
WH Z3
20
36.25
117.36 ± 3.51
2.99
55.45 ± 1.17
2.10
MRF Z4
20
29.45
118.23 ± 4.38
3.71
56.33 ± 1.34
2.38
BRF Z5
20
34.72
118.47 ± 4.09
3.45
56.30 ± 1.27
2.25
Total
60
P-value
0.000
0.000
Table 1.
Total skull length, zygomatic width of skull of blue duiker.
P < 0.05.
Agro-ecological Zones
n
Jugal teeth line length (mm)
Palate maximal width (mm)
Palate minimal width (mm)
μ ± σ
CV (%)
μ ± σ
CV (%)
μ ± σ
CV (%)
WH Z3
20
35.35 ± 2.88
8.15
37.57 ± 2.74
7.30
20.19 ± 2.24
11.10
MRF Z4
20
36.39 ± 3.82
10.50
44.11 ± 19.10
43.29
21.03 ± 1.37
6.52
BRF Z5
20
36.28 ± 3.67
10.13
38.63 ± 3.45
8.94
21.19 ± 1.71
8.05
Total
60
P-value
0.000
0.000
0.000
Table 2.
Jugal teeth line length, palate maximal width and minimal palate width of skull of blue duiker.
P < 0.05.
Agro-ecological Zones
n
Post-orbital apophyses width (mm)
Height between first molar and orbit (mm)
Arcade zygomatic height (mm)
μ ± σ
CV (%)
μ ± σ
CV (%)
μ ± σ
CV (%)
WH Z3
20
29.18 ± 6.26
21.45
14.30 ± 1.51
10.53
10.40 ± 1.50
14.46
MRF Z4
20
29.99 ± 7.25
24.16
15.10 ± 1.14
7.57
11.06 ± 1.12
10.13
BRF Z5
20
30.25 ± 6.80
22.49
15.23 ± 1.23
8.08
11.17 ± 1.10
9.83
Total
60
P-value
0.000
0.000
0.000
Table 3.
Post-orbital apophyses width, height between the first molar and orbit, arcade zygomatic height of skull of blue duiker.
P < 0.05.
Agro-ecological zones
n
Fourth upper pre-molar length (mm)
Second molar width (mm)
Length palate (mm)
μ ± σ
CV (%)
μ ± σ
CV (%)
μ ± σ
CV (%)
WH Z3
20
5.33 ± 0.86
16.18
4.87 ± 0.94
19.21
60.25 ± 5.38
8.93
MRF Z4
20
5.94 ± 1.50
25.31
5.55 ± 1.29
23.32
61.08 ± 6.37
10.43
BRF Z5
20
5.88 ± 1.35
23.03
5.58 ± 1.22
21.79
61.44 ± 6.02
9.80
Total
60
P-value
0.000
0.000
0.000
Table 4.
Fourth upper pre-molar length, second molar width, length palate of skull of blue duiker.
P < 0.05.
Agro-ecological Zones
n
Condyle basal length (mm)
Pre-maxillary width (mm)
Orbiter angle (°)
μ ± σ
CV (%)
μ ± σ
CV (%)
μ ± σ
CV (%)
WH Z3
20
100.21 ± 4.41
4.40
23.82 ± 1.22
5.12
27.75 ± 2.36
8.50
MRF Z4
20
101.22 ± 5.60
5.53
24.40 ± 1.48
6.07
28.25 ± 1.94
6.88
BRF Z5
20
101.52 ± 5.23
5.15
34.63 ± 5.84
16.87
28.35 ± 2.18
7.70
Total
60
P-value
0.000
0.000
0.000
Table 5.
Condyle basal length, pre-maxillary width, orbiter angle of skull of blue duiker.
P < 0.05.
Sex
n
Skull length (mm)
Zygomatic width (mm)
CV (%)
μ ± σ
CV (%)
μ ± σ
CV (%)
M
30
40.04
114.32 ± 0.82
0.72
55.67 ± 0.69
1.24
F
30
28.42
121.72 ± 1.77
1.45
56.38 ± 1.65
2.93
Total
60
P-value
0.000
0.340
T-test
−20.77
−21.17
Table 6.
Total skull length, zygomatic width of skull of blue duiker according to the sex.
P < 0.05.
Sex
n
Jugal teeth line length (mm)
Palate maximal width (mm)
Palate minimal width (mm)
μ ± σ
CV (%)
μ ± σ
CV (%)
μ ± σ
CV (%)
M
30
32.96 ± 0.62
1.89
35.24 ± 0.75
2.13
22.09 ± 0.80
3.63
F
30
39.06 ± 2.17
5.55
44.49 ± 14.80
32.92
19.52 ± 1.66
8.51
Total
60
P-value
0.000
0.000
0.000
T-test
−14.82
−3.59
7.64
Table 7.
Jugal teeth line length, palate maximal width and minimal palate width of skull of blue duiker according to the sex.
P < 0.05.
Sex
n
Post-orbital apophyses width (mm)
Height between first molar and orbit (mm)
Arcade zygomatic height (mm)
μ ± σ
CV (%)
μ ± σ
CV (%)
μ ± σ
CV (%)
M
30
23.35 ± 1.11
4.76
15.22 ± 0.69
4.50
11.59 ± 0.40
3.44
F
30
36.27 ± 1.79
4.95
14.53 ± 1.72
11.86
10.16 ± 1.45
14.32
Total
60
P-value
0.000
0.046
0.000
T-test
−33.540
2.044
5.202
Table 8.
Post-orbital apophyses width, height between the first molar and orbit, arcade zygomatic height of skull of blue duiker according to the sex.
P < 0.05.
Sex
n
Fourth upper pre-molar length (mm)
Second molar width (mm)
Length palate (mm)
μ ± σ
CV (%)
μ ± σ
CV (%)
μ ± σ
CV (%)
M
30
5.04 ± 0.40
7.88
4.88 ± 0.38
7.87
55.32 ± 1.17
2.11
F
30
6.39 ± 1.49
23.33
5.79 ± 1.51
26.13
66.53 ± 1.86
2.80
Total
60
P-value
0.000
0.002
0.000
T-test
−4.790
−3.183
−27.947
Table 9.
Fourth upper pre-molar length, second molar width, length palate of skull of blue duiker according to the sex.
P < 0.05.
Sex
n
Condylo basal length (mm)
Pre-maxillary (mm)
Orbiter angle (°)
μ ± σ
CV (%)
μ ± σ
CV (%)
μ ± σ
CV (%)
M
30
96.54 ± 1.26
1.31
23.83 ± 1.29
5.39
30.00 ± 0.64
2.14
F
30
105.43 ± 3.06
2.90
31.41 ± 6.74
21.46
26.23 ± 1.28
4.87
Total
60
P-value
0.000
0.026
0.000
T-test
−14.727
−1.125
14.419
Table 10.
Condyle basal length, pre-maxillary width, orbiter angle of skull of blue duiker according to the sex.
P < 0.05.
Agro-ecological zones
n
Mass (g)
μ ± σ
CV (%)
WH Z3
20
6.49 ± 2.35
36.25
MRF Z4
20
7.59 ± 2.24
29.45
BRF Z5
20
8.24 ± 2.86
34.72
Total
60
P-value
0.000
Table 11.
Blue duiker skull mass according to the agro-ecological zones.
P < 0.05.
Sex
n
Mass (g)
μ ± σ
CV (%)
M
30
7.44 ± 2.98
40.04
F
30
7.44 ± 2.11
28.42
Total
60
P-value
0.992
T-test
−0.010
Table 12.
Blue duiker skull mass according to the sex.
P < 0.05.
3.1 Blue duiker skull measurements
3.1.1 According to agro-ecological zones
Tables 1–5 show that the agro-ecological zone has no influence on the blue duiker skull measurements. So, there is no significant difference between these skull measurements in the three agro-ecological zones. Therefore, the blue duiker population would be the same in the three agro-ecological zones. However, the territories of this animal have split over time. This division would be due to human activities, namely urbanization, agro-industry, road construction, logging, etc. The blue duiker has been able to adapt to its increasingly changing environment, with a notable growth in commercial hunting [28]. The sustainable management of this animal will be the grantee of cultural conservation and biodiversity in Cameroon.
3.1.2 According to the sex
Table 6 shows the P-value given for an equal two-sided test (0.340) above the 5% threshold. This means that the means of the zygomatic width measurements are significantly different between the male and female blue duiker. On the other hand, the P-value (0.000) of the total length of the skull is below the threshold of 5%. This means that the averages of total skull length are not significantly different and therefore influenced by sex.
Table 7 shows that the P-value given for an equal two-sided test (0.000) is below the 5% threshold. This means that the averages of the measurements of the row length of the cheek teeth, the maximum palate width and the minimum palatal width are not significantly different between the male and female blue duiker, therefore, the sex has an influence on these cranial measurements.
Table 8 shows that the P-value given for an equal two-sided test (0.000; 0.046) is below the 5% threshold. This means that the averages of the post-orbital process width measurements, the first orbital molar base height and the zygomatic arch height are not significantly different between the male and female blue duiker. Therefore, the sex has an influence on these cranial measurements.
Table 9 shows that the P-value given for an equal two-sided test (0.000; 0.002) is below the 5% threshold. This means that the averages of the measurements of the maximum fourth upper premolar length, the maximum second molar width and the palatal length are not significantly different between the male and female blue duiker, therefore, the sex has an influence on these cranial measurements.
Table 10 shows that the P-value given for an equal two-sided test (0.000; 0.026) is below the 5% threshold. This means that the means of the measurements of the condylo-basal length, the pre-maxillary width and the orbital angle are not significantly different between the male and female blue duiker, therefore, the sex has an influence on these cranial measurements.
3.2 Blue duiker skull Mass
The mass of the skull of the blue duiker does not vary from one agro-ecological zone to another regardless of sex (Table 11).
It appears from Table 11 that the agro-ecological zone has no influence on the mass of the blue duiker skull because P < 0.05. So, there is no significant difference between the mass of blue duikers in the three agro-ecological zones.
Table 12 shows the P-value given for an equal two-sided test (0.992) above the 5% threshold. This means that the averages of the cranial mass measurements are significantly different between the male and female blue duiker.
3.3 Principal Component Analysis (PCA) of cranial measurement of blue duiker’s
The Principal Component Analysis was done to show the contribution of 15 cranial measurements to the explanation of genetic variabilities within the blue duiker’s population. These 15 measurements have enabled us to obtain 15 proper values which permitted the construction of a correlation circle.
Principal component analysis (PCA) was carried out to show the contribution of 15 cranial measurements to the explanation of the total genetic variability observed within the blue duiker population. The eigenvalues and the factors are sorted in descending order of variability represented in Table 13.
Component
Initial eigenvalues
Extraction Sums of the squares of the factors retained
Total
% of variance
Cumulative %
Total
% of variance
Cumulative %
1
7.534
50.224
50.224
7.534
50.224
50.224
2
5.144
34.291
84.515
5.144
34.291
84.515
3
0.931
6.206
90.721
4
0.738
4.922
95.643
5
0.390
2.598
98.242
6
0.110
0.731
98.973
7
0.063
0.421
99.394
8
0.042
0.279
99.673
9
0.019
0.127
99.800
10
0.012
0.081
99.881
11
0.010
0.068
99.949
12
0.005
0.033
99.981
13
0.002
0.014
99.995
14
0.000
0.003
99.998
15
0.000
0.002
100.000
Table 13.
Eigenvalues and cumulative proportion of principal components of cranial measurements.
In Table 13, the first eigenvalue emerges with a value of 7.53 and represents 50.22% of the variability. This means that if we represent the data on a single axis, then we will always have 50.22% of the total variability which will be preserved. Thus, we can deduce from the graph below that the pairs of variables (total length of the skull; mass), (zygomatic width; pre-maxillary width), (length of cheek teeth row; mass), (length of cheek teeth row; maximum palate width), maximum palate width; orbital angle), (zygomatic arch height; pre-maxillary width), (upper fourth premolar maximum length; pre-maxillary width) and (orbital angle; mass) show a significant correlation at the 5% level. However, not all cranial measurements are influenced by agro-ecological zones, which is not the case with sex, which influences these measurements. We can conclude that there is a correlation between the different biometric characteristics at the 5% threshold.
The observation of Table 13 shows that the orbital angle, the height of the zygomatic arches and the width of the minimum palate are orthogonal to each other, so they are significantly uncorrelated. On the other hand, the other measurements are close to each other, so they are significantly and positively correlated. The measurements of the skulls of blue duiker populations are mostly close to each other and therefore indicate how these measurements are grouped by agro-ecological zone according to their similarities (Figure 2).
Figure 2.
Grouping of similar cranial measurements by agro-ecological zone.
Figure 2 makes it possible to represent the cranial measurements on a two-dimensional map, and thus to identify trends. We see that, on the basis of the biometric variables available, they are grouped according to the axes F1 (50.22%) and F2 (34.29%). We see in this figure that on the basis of the biometric variables available, the characteristics grouped according to the three agro-ecological zones are quite specific. We notice that the zones of BRF Z2, WH Z3, of MRF Z4 have measurements that are specific to them. These measurements are completely isolated and well away from the centre of the mark. The cranial measurements of blue duikers are mostly closer one against the other, indicating that these measurements construct a similar structure.
3.4 Hierarchy Ascending Classification (HAC) of blue duikers of Cameroon
The dendrogram in Figure 3 illustrates the relationship between the three subclasses of cranial measurements based on similarity. The HAC will then gather the individuals iteratively in order to produce a dendrogram. That is, to identify subclasses of observations with similar measurements.
Figure 3.
Dendrogram of cranial measurements of the blue duiker according to cranial measurements. c: subclass of cranial measurements.
3.5 Discriminant factorial analysis (DFA) of blue duiker
The discriminant factor analysis (DFA) of the cranial measurements made it possible to find out which characteristics make it possible to best separate the classes (groups) of individuals by agro-ecological zone. It gives a graphical representation that best accounts for this separation (Figure 4).
Figure 4.
Discrimination of blue duiker cranial measurements according to agro-ecological zones.
The explanatory variables that discriminate the three groups are those whose probability is lower than the chosen risk of error (≤5%). Thus, among the characteristics (total length of the skull; zygomatic width; jugal teeth row length; maximum palate width; minimum palatal width; post orbital apophyses width; orbital first molar base height; zygomatic arch height; maximum fourth upper premolar length; maximum width second molar; palatine length; condylo-basal length; pre-maxillary width; orbital angle, mass.) are not influenced by agro-ecological zones. They are grouped into three barycentre’s corresponding to the different subclasses which bring together the agro-ecological zones presenting the best similar measurements. However, they can only be discriminated against on the basis of sex. Thus, among the 15 measurement variables, the pairs (total length of the skull; mass), (zygomatic width; pre-maxillary width), (length of cheek teeth row; mass), (length of cheek teeth row; maximum palate width), maximum palate width; orbital angle), (zygomatic arch height; pre-maxillary width), (maximum length of the upper fourth premolar; pre-maxillary width) and (orbital angle; mass) therefore better discriminate between the three subclasses. The sign of the coefficient of the linear discriminant function makes it possible to locate the cranial measurements of each of the subclasses; the negative sign for subclass 1; the positive sign for subclass 2 and the negative sign for subclass 3.
According to the [29], wildlife species are typically undervalued on the basis of productivity and size compared to domesticated animals. In some contexts, however, wildlife can compete with livestock, particularly given the opportunities they provide, including ecotourism, hunting, meat and other ecosystem benefits. She goes further by asserting that, approaches to managing wildlife, therefore the blue duiker, should include improving knowledge of the use and trade of wild species and an understanding of the ecology of the species concerned. In the same vein, if these conditions were combined and incorporated into sound national wildlife management strategies, it would be possible to achieve more sustainable use of wildlife for food and other purposes. Thus, knowing the population structure of the blue duiker helps to achieve the objectives of the CBD. Biometric characteristics of living and cranial blue duiker show three intra-specific subclasses. This would imply the existence of a blue duiker meta-population common to the three agro-ecological zones. As such, one could suspect three blue duiker subgroups due to the fragmentation of their habitat [30]. The C1, C2 and C3 subclasses would in fact be a blue duiker meta-population but isolated by the reduction and fragmentation of the forest ecosystem. The consequence of this fragmentation is inbreeding which could make the blue duiker population fragile and susceptible to any type of disease [31].
Knowledge of the resource allows good monitoring because in article 17 on the monitoring of the use of genetic resources, the Ngoya Protocol stipulates that, in order to promote compliance with the applicable rules, each Party shall take appropriate measures to monitor the use of genetic resources. Use of genetic resources and increase transparency regarding such use [32]. These measures must be related to the use of genetic resources or the collection of relevant information, among others, at any stage of research, development, innovation, pre-commercialization or commercialization. Sustainable wildlife management refers to the proper management of wildlife species to maintain their populations and habitats over time, taking into account the socio-economic needs of human populations [33]. When sustainably managed, wildlife can provide long-term nutrients and income to indigenous peoples and local communities, contributing significantly to local livelihoods and safeguarding human and environmental health [29, 34, 35].
The biometric parameters grouped according to agro-ecological zones are strongly linked to each zone. The characteristics of the living blue duiker gave three groups of characteristics. The same is true for cranial measurements. These three groups of characteristics allow us to say that the blue duiker in Cameroon has three structures corresponding to three subspecies closely linked to their agro-ecological zones. Although similar, these three subspecies have different structures due to their habitat, which varies from one agro-ecological zone to another. The knowledge of these sub-species has an impact on the ecological monitoring of the blue duiker in the sense that the monitoring plan will be built according to each agro-ecological zone thus corresponding to each sub-species.
Each country is called upon to gather information on its genetic resources. This is done at the local level, with the populations living near the forests. To achieve this, it is necessary to develop data collection tools that are accessible to all and easy to use. This data will be used at municipal and national levels to sustainably manage the resource. Biometrics is used to help local populations and resource managers identify the resources in order to easily collect data that can be used to make management decisions.
ACPRD (African Center for Participatory Research and Development) fir funding on this research and, hunters, sellers and personal wildlife for the collaborations.
African wisdom teaches that it is easier for a man to climb a tree with both arms than with one. This amounts to saying that within the framework of an intellectual work, a single head, even that of a scholar, cannot carry it out alone. This research has benefited from the scientific advice of some, the moral support and the financial support of others. In the impossibility of quoting them all, our thanks go particularly to:
Pr TSI Evaristus ANGWAFO, Full Professor, at the Faculty of Agronomy and Agricultural Sciences University of Dschang, Department of Forestry, for his contribution to the writing of this article;
Pr MEUTCHIEYE Félix, Lecturer, teacher at the Faculty of Agronomy and Agricultural Sciences, Department of Zootechnics, for his contribution to the writing of this article;
The whole FOKAM family for the support they have always given me;
The TCHOUASSEP family for their moral support and especially to my wife WOUNGWA TCHOUASSEP Pamela Nichel for her advice and her moral and financial support.
1.Sala OE, Chapin FS, Armesto JJ, Berlow E, Bloomfield J, Dirzo R, et al. Global biodiversity scenarios for the year 2100. Science (New York, N.Y.). 2000;287(5459):1770-1774
2.Nazarevich V. The sixth species extinction event by humans. Convergence Earth Common Journal Convergence MacEwan University. 2015;5(1):10
3.Ripple WJ, Abernethy K, Betts MG, Chapron G, Dirzo R, Galetti M, et al. Bushmeat hunting and extinction risk to the world’s mammals. Royal Society Open Science. 2016;3(10):160-498
4.Duraiappah AK, Naeem S, Agardy T, Ash NJ, Cooper HD, Díaz S, et al. Millennium ecosystem assessment: Ecosystems and human wellbeing. Ecosystems. 2005:1-100
5.Hooper DU, Adair EC, Cardinale BJ, Byrnes JEK, Hungate BA, Matulich KL, et al. A global synthesis reveals biodiversity loss as a major driver of ecosystem change. Nature. 2012;486(7401):105-108
6.Bahuchet S. Le rôle de la restauration de rue dans l’approvisionnement des villes en viande sauvage: le cas de Yaoundé (Cameroun). Travaux de la Société d’Ecologie Humaine. 2000:171-182
7.COMIFAC. Stratégie sous régionale pour l’utilisation durable de la faune sauvage par les communautés autochtones et locales des pays de l’espace COMIFAC. Adoptée en Conseil des Ministres de la COMIFAC en janvier 2015. Rapport; 2015. p. 25
8.Hette S. Quantification de la viande de brousse prélevée et consommée dans trois villages du sud-est du Cameroun. Travail de fin d’études présenté en vue de l’obtention du diplôme de master bio ingénieur en gestion des forêts et des espaces naturels. Liège université, Agro-Bio-Tech; 2018. p. 75
9.FAO. Caractérisation phénotypique des ressources génétiques animales. Directives FAO: sur la production et la santé animales; 2013. p. 151
10.Baumung R, Simianer H, Hoffmann I. Genetic diversity studies in farm animals–A survey. Journal of Animal Breeding and Genetics. 2004;121:361-373
11.Mahammi F. Caractérisation phénotypique et moléculaire des populations de poules locales (Gallus gallus domesticus) de l’Ouest Algérien. Université des Sciences et de la Technologie d’Oran « Mohamed Boudiaf ». Faculté des Sciences de la Nature et de la Vie Département de Génétique Moléculaire Appliquée Thèse présentée En vue de l’obtention du Diplôme de Doctorat; 2015. p. 180
12.Van Vuuren BJ, Robinson TJ, Retrieval of four adaptive lineages in duiker antelope: Evidence from mitochondrial DNA sequences and fluorescence in situ hybridization. Molecular of Phylogenetic Evolution. Elsevier. 2001;20:409-425
13.Bennun L. Davies G. Howell K. Newing H Linkie M: La biodiversité des forêts d’Afrique: Manuel pratique de recensement des vertébrés ; 2004. p. 180
14.Miantsia FO. Analyse situationnelle et perspectives de game-ranching d’ongulés sauvages (Cephalophus spp. et Potamochoerus porcus) au Cameroun [Thèse présentée en vue de l’obtention du diplôme de Master Recherche en gestion de l’environnement, option gestion des ressources naturelles]. Département de Foresterie, Université de Dschang; 2016. p. 87
15.Dubost G. The size of African forest artiodactyls as determined by the vegetation structure. African Journal of Ecology. 1979;17(1):1-17
16.Dubost G. Comparison of the diets of frugivorous Forest ruminants of Gabon. Journal of Mammalogy. 1984;65(2):298-316
17.Gauteir-Hion A, Emmons LH, Dubost G. A comparison of the diets of three major groups of primary consumers of Gabon (primates, squirrels and ruminants). Oecologia (Berl.). 1980;45:182-189
18.Nasi R, Van Vliet N. Mesure de l’abondance des populations d’animaux sauvages dans les concessions forestières d’Afrique centrale. Unasylva. 2011;62(2):49-55
19.Towa OW, Bobo KS, Djekda D, Keumbeng B, Bobo R, Moaga Y, et al. Population density estimates of forest duikers (Philantomba monticola & Cephalophus spp.) differ greatly between survey methods. African Journal of Ecology. 2018;56(4):908-916
20.Vlaeva R, Georgieva S, Barzev G, Ivanova I. Morphological and phenotypic characteristics of donkeys in some regions of Bulgaria. Trakia Journal of Sciences. 2016;1:92-95
21.Dubost G. L‘écologie et la vie sociale du Céphalophe bleu (Cephalophus monticola Thunberg), petit ruminant forestier africain. Zeitschrift für Tierpsychologie. Ethology. 1980;54:205-266
22.IRAD. Deuxième rapport sur l’état des ressources phytogénétique pour l’alimentation et l’agriculture au Cameroun; 2008. p. 93
23.Ducos, Etude d’un squelette de taurin kapsiki: note préliminaireIn: Des taurins et des hommes : Cameroun, Nigéria [en ligne]. Marseille: IRD Editions; 1998. DOI: 10.4000/books.irdeditions.5403
24.Moulay AB, ZNARI M, Teresa A. Comparative study of the cranial fluctuating asymmetry in two Dorcas gazelle subspecies Gazella dorcas massaesyla vs. G. d. neglecta). Bulletin de l’Institut Scientifique, Rabat, Section Sciences de la Vie. 2018;(40):1-9
25.Lajoie A. Philibert A et Jolicoeur H : Guide de prises de mesures crâniennes pour des fins de taxonomie et d’identification des canidés. Ministère des Ressources naturelles de la Faune et des Parcs. Direction du développement de la faune. Québec: Bibliothéque nationale du Québec; 2003. p. 34
26.Lahm SA. Utilization of forest resources and local variation of wildlife populations in northeastern Gabon. In: Hladik CM, Hladik A, Linares OF, Pagezy H, Semple A, Hadley M, editors. Tropical Forests People and Food, MAB Series. Vol. 13. UNESCO; 1993. pp. 213, 852-226
27.Khaldi Z. Haddad B. Soui S. Rouissi H. Ben Gara A et Rekik B. Caracterisation phenotypique de la population Ovine du Sud Ouest de la Tunisie. Animal Genetic Resources. 49(0):1-8. DOI: 10.1017/S2078633611000361
28.Miantsia FO, Meutchieye F, Tsi AE. Inedible diversity use of blue duiker, Cephalophus Monticola (Thunberg, 1789) of Cameroon. JOJ Wildlife & Biodiversity. Juniper. 2021;4(2):555631. DOI: 10.19080/CTBEB.2021.04.555631
29.MINEPDED. Loi n° 2021/014 du 9 juillet 2021 régissant l’accés aux ressources génétiques, à leurs dérivés, aux connaissances traditionnelles associées et le partage juste et équitable des avantages issus de leur utilisation. p. 19
30.Van Vliet N, Nasi R. Mise en évidence des facteurs du paysage agissant sur la répartition de la faune dans une concession forestière. Diversité Biologique. Faune Gabon. Bois et Forêts des Tropiques. 2007;292(2):23-37
31.Quagleitti B. Impact de la consanguinité et de l’hybridation chez quatre auxiliaires de lutte biologique. Sciences biologiques [Thèse de doctorat]. Université de Côte d’Azur; 2017. p. 180
32.CBD. L’accès aux ressources génétiques et le partage juste et équitable des avantages découlant de leur utilisation relative à la Convention sur la diversité biologique. Protocole de Ngoya. 2012:16
33.Starkey M, Scholtz O, Taylor G. Wildlife monitoring practices and use in Central Africa. In: Program on African Protected Areas and Conservation (PAPACO). Wildlife Conservation Society; 2015. Available from: https://papaco.org/wp-content/uploads/2015/09/IUCN-Monitoring-PA-2-in-Central-Africa.pdf vue le 04/04/2021
34.FAO. Gestion durable des forêts et de la faune sauvage en Afrique: Améliorer la valeur, les avantages et les services. Nature & Faune. 2016;30(2):107
35.FAO. Projet FAO/GEF “Gestion durable du secteur de la faune sauvage et de la viande de brousse en Afrique centrale”. In: Rapport Final. 2017. p. 16
Written By
Miantsia Fokam Olivier, Felix Meutchieye and Evaristus Tsi Angwafo
Submitted: 25 July 2023Reviewed: 02 August 2023Published: 07 February 2024
 Open access peer-reviewed chapter