 Open access peer-reviewed chapter
Abstract
We describe studies on ferrites that use the Low Field Absorption (LFA) technique. These are made in soft magnetic polycrystalline ferrites magnetite, garnet iron, and nickel-zinc ferrite, where we show LFA spectra, highlighting their main characteristics and illustrating how magnetic phase transitions and magnetic anisotropy are detected employing these measurements. In this chapter, we also present a review of ferromagnetic resonance (FMR) studies in ferrites. Ferromagnetic materials exhibit various behaviors when subjected to ac magnetic fields, such as domain wall relaxation (DWR) and FMR. For instance, most ferrites generally find DWR at relatively low frequencies, below 10 MHz, while FMR must satisfy the Larmor equation. Microwave power absorption can be associated with magnetization processes as a function of dc fields, such as LFA and FMR. Microwave absorption centered at zero magnetic fields has been observed in various materials: superconductors, ferrites, and semiconductors. For ferrites, the LFA signal with the same phase of the ferromagnetic resonance follows the thermal behavior of the magnetization. For magnetically ordered materials, the LFA signal is evidence of the existence of a ferromagnetic phase, this signal is not present in the paramagnetic state, and it appears as the temperature is decreased below Curie temperature.
Keywords
- soft ferrites
- low field absorption (LFA)
- ferromagnetic resonance (FMR)
- phase transition
- magnetically modulated microwave absorption spectroscopy (MAMMAS)
1. Introduction
Ferrites are a group of magnetic ceramic oxides containing the ferric ion Fe3+ in their structure and a divalent (M2+) or trivalent rare earth (R3+) cation. Accordingly, to their crystal structure, ferrites can be classified as spinels (MFe2O4), garnets (R3Fe5O12), perovskites (RFeO3), or as hexagonal structures related to the magnetoplumbite mineral (MO·6Fe2O3) [1, 2]. This diversity in composition and crystal structure provides a broad spectrum of magnetic and electrical properties which can be tuned and engineered for electronic and biomedical applications.
This chapter will focus on soft magnetic ferrites such as the spinel [3] and the garnet crystal structure [4, 5]. These ferrites are characterized by their high magnetic permeability, high electrical resistivity, and moderate permittivity from dc to GHz frequencies [6]. Soft ferrites are applied in electronic devices of high frequency [7] due to their ability to interact with dc and ac magnetic fields for transporting information or energy [6, 7] and by shielding electronic components from undesirable electromagnetic interference (EMI) [8].
The applicability of the soft ferrites is associated with the magnetic susceptibility (
This chapter is dedicated to the microwave characterization of the soft magnetic ferrites magnetite (Fe3O4), nickel-zinc ferrite (NZFO: (Nix, Zn1-x)Fe2O4), and yttrium iron garnet (YIG: Y3Fe5O12). The focus of this chapter will be on the characterization of these systems and their magnetic anisotropies and phase transitions using the microwave power absorption techniques that historically are known as Ferromagnetic resonance (FMR) [9, 10], Low field absorption (LFA) [11] and magnetically modulated microwave absorption spectroscopy (MAMMAS) [12].
1.1 Soft magnetic materials under alternating magnetic fields
Ferromagnetic materials exhibit various behaviors when subjected to ac magnetic fields, ranging from domain wall relaxation (DWR) to ferromagnetic resonance (FMR). At radio frequency, in the 103–106 Hz range, the changes in magnetic permeability are mainly associated with the movement of domain walls (DW), where this process can be modeled to assume that DW moves like an elastic membrane driven by an externally applied ac field. In this model, it is assumed that the DW can be elastically deformed by the amount
Where
Figure 1 shows the calculated complex inductance (
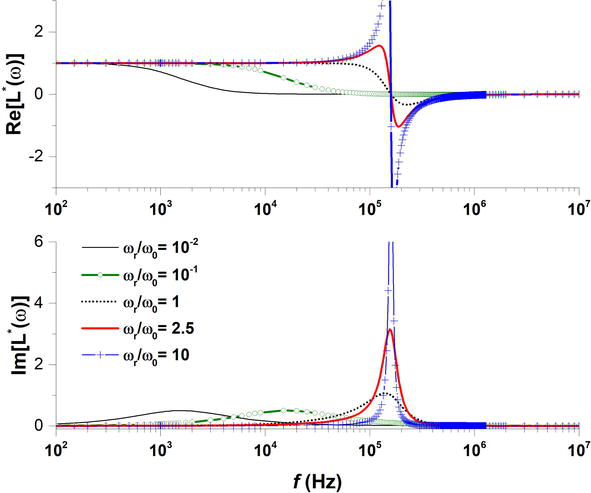
Figure 1.
Calculated complex inductance L*(ω) spectra for ferrites with different ratios of relaxation to resonance frequencies.
1.2 Microwave power absorption techniques
The volumetric density of the microwave power absorbed by a magnetic sample is directly related to the electrodynamic properties of the material and is given as [14, 15]:
Where
Microwave power absorption can be measured as a function of the radiation frequency (
In the second type of FMR setup [17, 18], the sample is mounted inside and in the center of a resonant cavity coupled to a microwave source through a magic-T bridge. The Microwave absorption is obtained by analyzing the reflected wave from the sample-loaded cavity due to a change in the quality factor (Q), and later it is guided to a crystal detector using a microwave circulator. These microwave measurements are performed under a fixed frequency while varying the DC magnetic field (
The kind of microwave absorption techniques employed in this chapter (FMR, LFA, and MAMMAS) were implemented with resonant cavities in the TE011 mode [12, 17, 19], where the sample is placed at a maximum magnetic field (
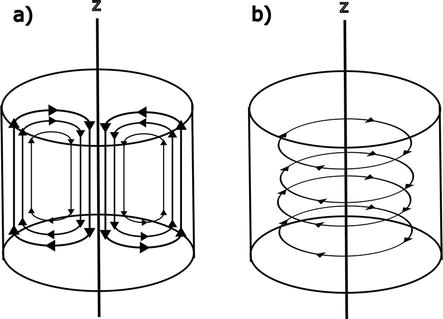
Figure 2.
Schematic distribution of (a) magnetic and (b) electric field lines inside a cylindrical TE011 microwave cavity. Adapted from [
Most of the results discussed in this chapter were obtained in an electron paramagnetic resonance (EPR) spectrometer JEOL JES-RES3X (see Figure 3). It is also necessary to mention that microwave absorption is modulated by a magnetic field (
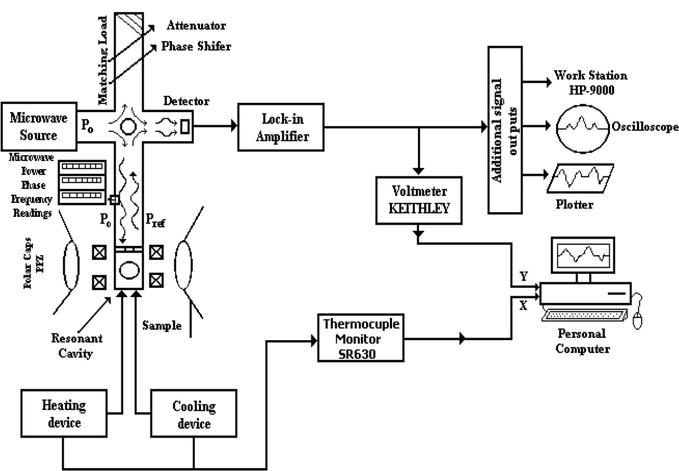
Figure 3.
Block diagram for implementing FMR, LFA, and MAMMAS techniques in a JEOL JES-RES3X spectrometer at X-band. Adapted from [
1.2.1 Ferromagnetic resonance (FMR)
The ferromagnetic resonance (FMR) phenomenon is the resonant absorption of microwave energy due to the Larmor precession of the magnetic moment in a material (Figure 4). The Larmor frequency gives FMR condition [9, 10, 22]:
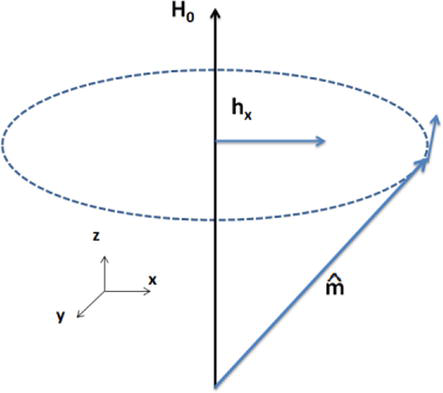
Figure 4.
Schematic representation of the Larmor precession. A magnetic moment
Here,
The magnetization process at microwave frequencies can be modeled via the Landau- Lifshitz-Gilbert (LLG) equation [23]:
Here,
LLG equation describes the dynamical response and relaxation of magnetization under given conditions of dc (
The internal field (
Also, FMR experiments allow for obtaining dynamical information regarding the magnetic relaxation of materials via the analysis of the FMR linewidth.
It can be shown that, near the resonance field, the real (
With the parameter
Eqs. (7)–(9) indicate that a smaller Gilbert damping factor makes the microwave absorption peak value more intense and concentrated in a small field interval. Else, as
1.2.2 Low field absorption (LFA)
LFA technique refers to the microwave absorption observed around zero DC magnetic field within a typical field width of
The typical LFA signal may exhibit hysteresis, observed in superconducting and magnetically ordered materials [11, 12]. So, the LFA signal is associated with the absorption dynamics of microwaves for fluxoid tubes in High-Tc superconductors and the interaction of microwaves with magnetic moments in the magnetic domains for ferromagnetic materials [12, 24].
LFA signal only appears below the corresponding Curie temperature
1.2.3 Magnetically modulated microwave absorption spectroscopy (MAMMAS)
Magnetically modulated microwave absorption spectroscopy (MAMMAS) [11, 12], or MFMMS (Magnetic field modulated microwave spectroscopy) as it is called in other works [15], is the study of the losses of the microwave power absorption as temperature function at a fixed magnetic field value (
It is necessary to mention that the FMR and LFA spectra are measured at a fixed temperature. However, the MAMMAS signal can be measured under a continuous temperature scan. Therefore, the MAMMAS technique is ideal for studying phase transitions in magnetic materials [15, 20]. The high sensitivity of this technique to detect the magnetic phase transitions is associated with the changes in electromagnetic properties of the materials with long-range electronic ordering. As this ordering is destroyed by thermal energy, marked changes exist in the electrical conductivity, permittivity, and permeability of materials during a phase transition. Finally, according to Eq. (2), changes in these properties affect the microwave power absorption of the magnetic medium.
2. Microwave power absorption studies in soft magnetic ferrites
Microwave power absorption techniques like FMR, LFA, and MAMMAS have been applied for various studies about magnetic ordering, phase transitions, and anisotropy characterization on soft magnetic ferrites. Here, we present a survey on the studies carried out in magnetite, nickel-zinc ferrite (NZFO), and yttrium iron garnet (YIG) employing these techniques.
2.1 Magnetite (Fe3O4)
Magnetite (Fe3O4) is the natural form of iron oxide and is considered a typical ferrite material. It crystallizes in the inverse spinel structure, whose general formula is represented by AB2O4. This structure belongs to the high symmetry space group
Magnetite has a low-temperature phase transition known as the Verwey transition [32, 33, 34, 35], where the magnetite has a low crystal symmetry, i.e., goes changing from the cubic
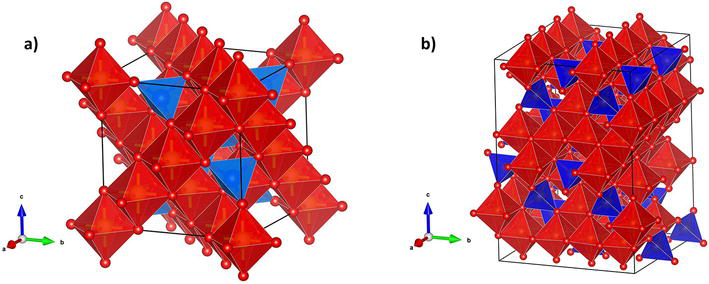
Figure 5.
Crystal structures of magnetite in the a) high symmetry phase (
The Verwey transition has been studied by different techniques [37], such as electrical resistivity, magnetoresistance [38], infrared and Raman spectroscopes [39], X-Ray diffraction (XRD), magnetometry, susceptibility, Mössbauer spectroscopy, calorimetric, nuclear magnetic resonance (NMR), and X-ray resonant absorption [32, 33, 37]. Also, FMR, LFA, and MAMMAS techniques have been applied to study this phase transition [24, 40].
In an earlier FMR study [41] on magnetite single crystals at X-band and K-band (18–26.5 GHz), the disappearance of the FMR signal has been observed at
More recently, the broadband FMR technique was used for studying the Verwey transition in an epitaxial magnetite film grown on MgGa2O4 (001) substrates [42]. FMR linewidth and the Gilbert damping showed an abrupt increase below the
FMR experiments were carried out in magnetite nanopowders, see Figure 6, following the Verwey transition through the changes in the resonance field (
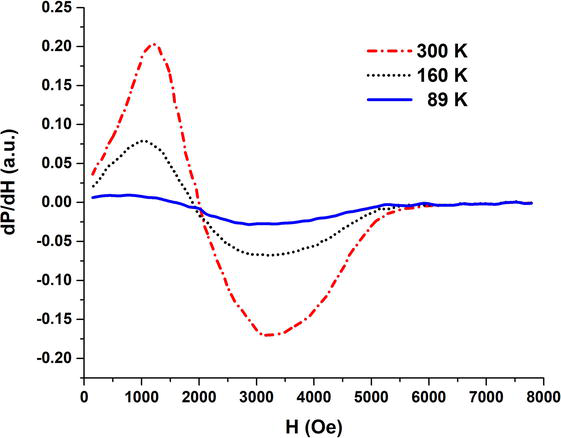
Figure 6.
FMR spectra in magnetite nanopowders for selected temperatures. Adapted from [
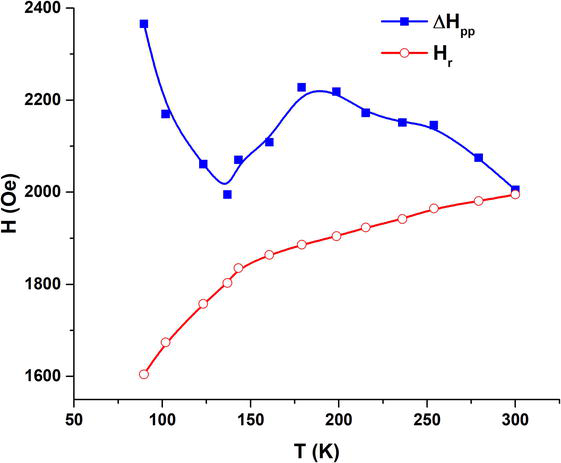
Figure 7.
Temperature dependence of the resonance field (Hr) and peak-to-peak linewidth (
As is known, in the limit of independent, non-interacting particles, the FMR linewidth is proportional to the anisotropy field, i.e.,
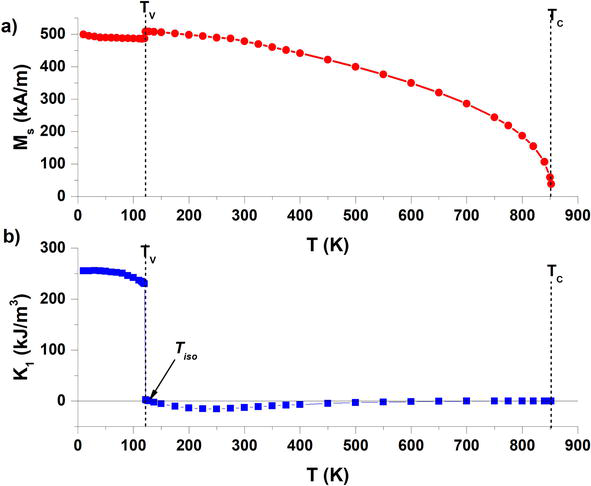
Figure 8.
Temperature dependence of (a) the saturation magnetization (filled circles) and (b) the lead magneto term of the magnetocrystalline anisotropy constant (K1-filled squares). Data were interpolated from reference [
LFA and MAMMAS techniques have been applied for studying the Verwey transition in bulk and nanopowders magnetite samples. Figure 9a shows LFA spectra in bulk magnetite samples at several temperatures. The linewidth (
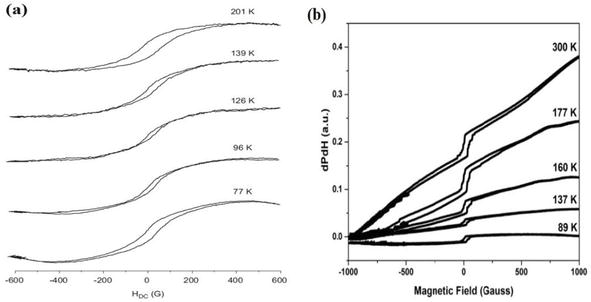
Figure 9.
LFA spectra in (a) bulk and (b) nanopowders magnetite at different temperatures. Adapted from [
In nanoparticles [40], LFA spectra can be described by a superposition of two components, one with hysteresis convoluted with a linear one. As is shown in Figure 9b, the slope of the linear component increases with temperature, showing a significant step at T > 137 K, which has been associated with the onset of the change in electron dynamics in B-sites.
MAMMAS spectra for bulk [24] and nanopowders [40] for magnetite samples are shown in Figure 10a and b, respectively. In both MAMMAS spectra, an increment in the microwave absorption is observed, due to an increment in the absorbing centers’ quantity and which produces an increase in the magnetoconductance of the samples, until reaching a maximum value. Later, the MAMMAS spectra diminish, and this behavior is associated with a decrease in the quantity of absorbing centers by the process of antiparallel spin alignment. It is necessary to mention that in the bulk sample, MAMMAS response increases to low temperatures due to an increase of the magnetocrystalline anisotropy in the magnetite monoclinic phase.
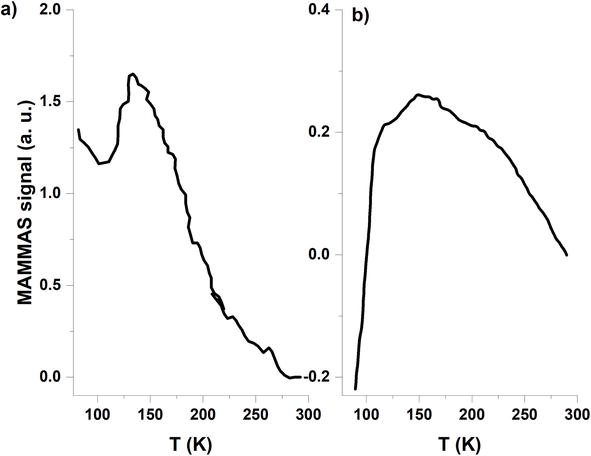
Figure 10.
MAMMAS response for (a) bulk and (b) nanopowders magnetite samples. Adapted from [
Wampler et al. [15] used the MAMMAS technique for studying the Verwey transition in magnetite epitaxial film growth onto MgO (001) substrates. They also provided electromagnetic modeling to explain the changes in microwave absorption for magnetite epitaxial films as a temperature function. In their model, the changes in MAMMAS spectra (renamed as magnetic field modulated microwave spectroscopy, MFMMS) are associated with changes in the magnetic moment and the magnetoresistive behavior of magnetite. MAMMAS measurements were performed under different DC magnetic field (HDC) values in their work, producing a family of MAMMAS curves. These responses were mainly associated with changes in the magnetic moment field derivative and then with the differential susceptibility (
2.2 Nickel-zinc ferrites (Ni1-x,Znx)Fe2O4
Nickel-zinc ferrite (NZFO: (Ni1-x,Znx)Fe2O4) is a solid-state solution whose final members are the nickel ferrite (NFO), a ferrimagnetic inverse spinel (↓Fe3+) [↑Fe3+↑Ni2+]O2−4; and the zinc ferrite (ZFO), which is a direct spinel with an antiferromagnetic order at low temperatures (Zn2+) [↑Fe3+↓Fe3+]O2−4 [1, 44, 45]. The resulting mixed spinel ferrites have a complex cation distribution represented by (Fe3+1-x Zn2+x) [Fe3+1 + xNi2+1-x]O2−4. Having a higher electrical resistivity (106Ω.m), NZFO is applied in electronic devices at frequencies between 1 and 500 MHz [2].
The magnetic properties of NZFO can be finely tuned by changing the Zn2+ content, as shown in Figure 11. Being diamagnetic, when Zn2+content increases, the magnetic moment in the A-sites is diluted. Also, the A-B superexchange coupling interaction between magnetic ions in A- and B-sites is weakened with increasing
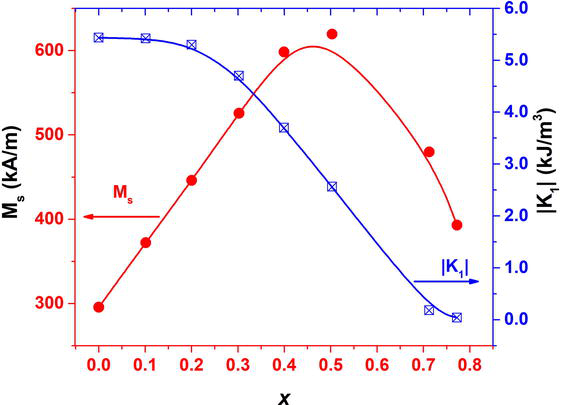
Figure 11.
The variation of the saturated magnetization (Ms– Red circles) and the absolute value of the magnetocrystalline anisotropy constant (K1.- blue squares) for NZFO as a function of the zinc content (x). With data from [
Figure 12 shows the extended field microwave absorption (EFMA) measurement. LFA signals more FMR spectrum for bulk powders (Figure 12a) and nanocrystalline thin film (Figure 12b) in NZFO samples with x = 0.65 [47]. The presence of the FMR signal at high fields and hysteresis around zero applied field due to LFMA are observed. For the bulk powders and thin film of NZFO, the resonance fields are
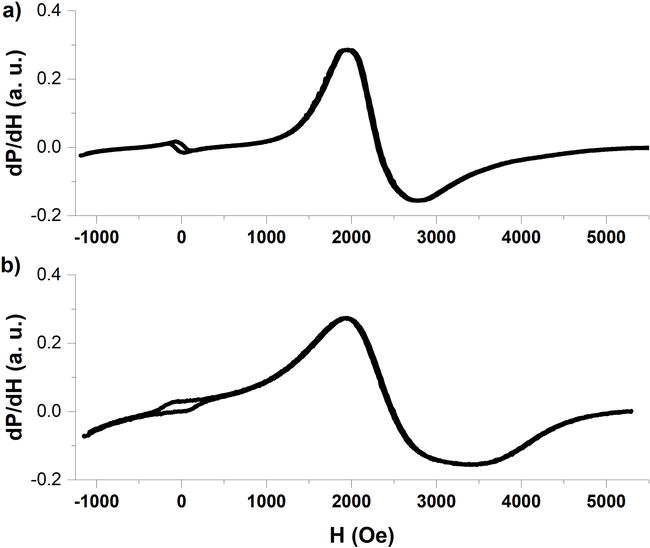
Figure 12.
The extended field microwave absorption in NZFO with x = 0.65 for (a) bulk powders and (b) thin film samples, where LFA signal is evident around H = 0 Oe. Adapted from [
FMR, LFMA, and MAMMAS studies have also been reported for sintered NZFO samples with
In a polycrystalline NZFO sample, the FMR spectrum showed the ferrimagnetic to paramagnetic transition at TC = 430 K, where the shift in resonance field toward the free electron value is because the internal field vanishes, see Figure 13a. Also,
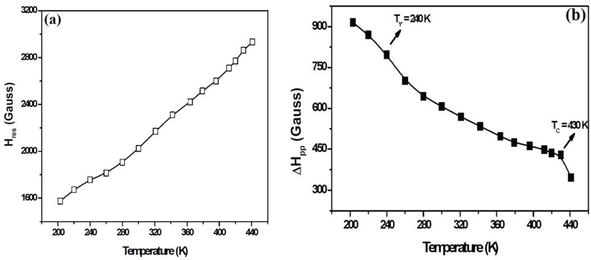
Figure 13.
Temperature dependence of (a)
On cooling the polycrystalline NZFO sample, MAMMAS response decreased, with a minimum at
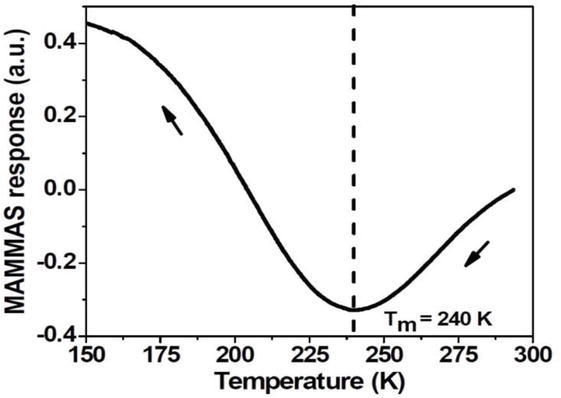
Figure 14.
MAMMAS response for the polycrystalline NZFO sample. Adapted from [
On the other hand, the LFA spectrum showed the development of a second component with an opposed phase at
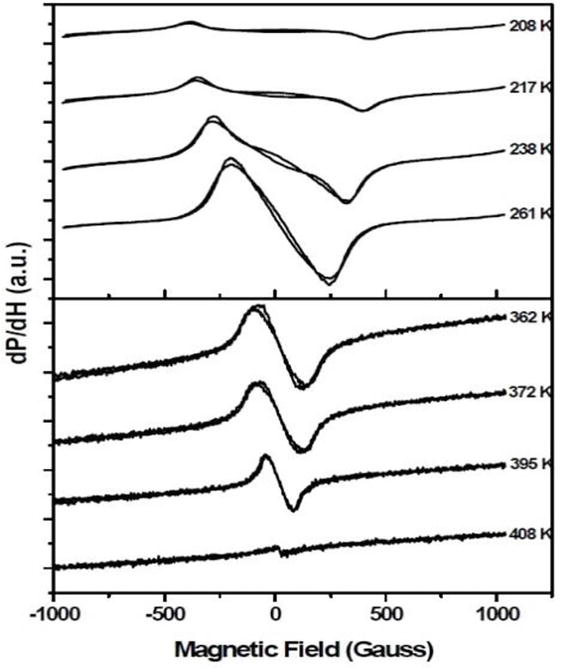
Figure 15.
LFA spectra of the polycrystalline NZFO sample in the 362–408 K (down) and 208–261 K (up) temperature ranges. Adapted from [
The study of microwave absorption processes at low magnetic fields is also crucial for developing some applications of soft ferrites for those applications that are expected to operate magnetic devices under small or zero applied fields. Lutsev and Shutkevich [49] reported broadband FMR measurements at 50 MHz-4.0 GHz frequencies in Mn-Zn and Ni-Zn ferrite nanocomposite films. Under these conditions, FMR absorption appears at
2.3 Yttrium iron garnet (YIG)
YIG (Y3Fe5O12) is a synthetic magnetic oxide that was independently discovered by Bertaut and Forrat [50], Pauthenet [51], and Geller and Gilleo [52] between 1956 and 1957. YIG adopts the garnet crystal structure, which belongs to the high symmetry space group
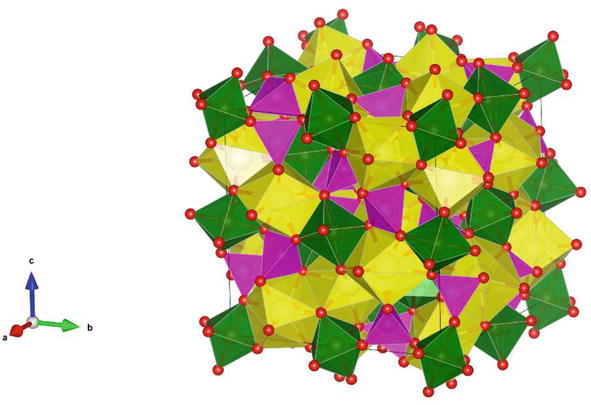
Figure 16.
Schematic representation of the crystal structure for yttrium iron garnet (YIG), where it is shown the coordination polyhedral for octahedral (green), tetrahedral (magenta), and dodecahedral (yellow) sites.
YIG has remarkable magnetic, electric, and magnetic optical properties, which are the basis for its applications in microwave devices for radar and telecommunications [5]. Also, YIG is a soft magnetic material with a low magnetocrystalline anisotropy with cubic anisotropy constants
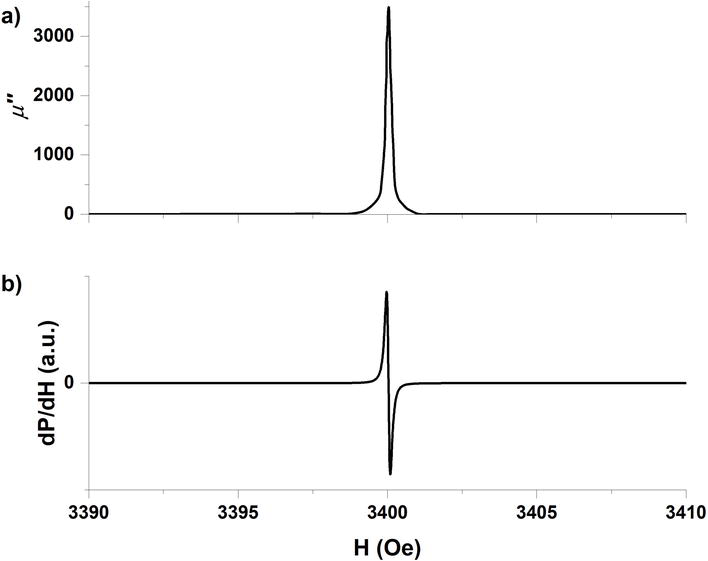
Figure 17.
FMR spectrum for a single crystal YIG sphere measured at 9.3 GHz with HDC applied parallel to the [100] axis. (a) Imaginary permeability representation with data interpolated from LeCraw [
Since their discovery, YIG has been one of the most widely studied materials under the FMR technique. Experiments for measuring its linewidth and damping [56, 57], the power saturation effects, the excitation of spin waves [5, 58, 59, 60], and spin pumping [61], and spin-torque transference [62] have been reported.
Although the single crystals and the micrometer-thick epitaxial films have smaller values of linewidth, this parameter is extremely sensitive to microstructure, pores, and magnetic impurities. YIG has been used as a model for studying the FMR relaxation mechanisms in magnetic materials. The difference in FMR properties between single crystals and nanocrystalline YIG materials can be huge, while epitaxial thin films growth onto GGG (100) substrates can exhibit linewidth and damping with low values as
LFA signal in YIG samples has a much lower amplitude, and its linewidth is smaller than in the FMR spectra (
A comparative study of the microwave absorption between micropowders and nanopowders in the YIG samples was presented by Sanchez MH et al. [65], where the representative FMR spectra are shown in Figure 18. The nanopowders in YIG samples show evidence of superparamagnetic (SPM) behavior, which is evidenced by vibrant sample magnetometry (VSM); also, by their nearly constant resonance field because it does not change with the temperature, and it is centered at Hr = 3330 Gauss.
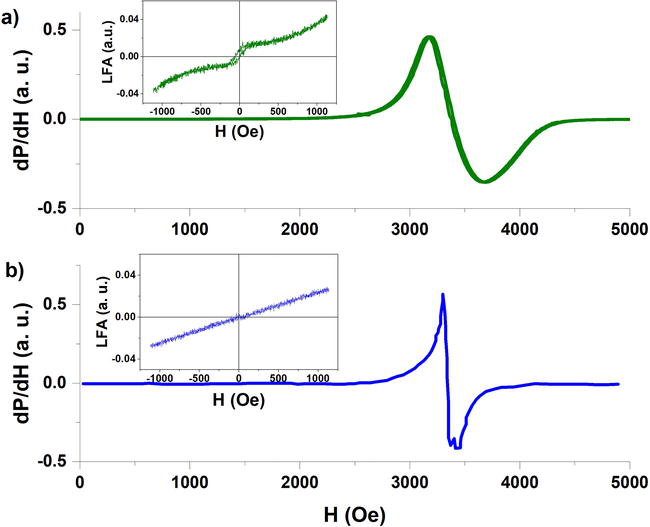
Figure 18.
FMR spectra for (a) micro powders and (b) nanopowder of the YIG samples at 300 K, and their respective LFA signals are shown in the insets. Adapted from [
In contrast, the micropowders in the YIG particles exhibit magnetization curves with hysteresis, and a much more complex thermal dependence of their FMR parameters, as expected for magnetic ordering. Hr in nanopowders increases with temperature due to thermal energy weakening of the internal field in the YIG sample. Also, the linewidth decreases with temperature because of magnetocrystalline anisotropy and long-range dipolar interactions, which are proportional to Ms.
As stated before, the LFA signal is a signature of magnetic order in the materials, as we show by the contrast between the FMR and LFA absorption spectra in YIG particles of micrometric and nanometric dimensions [65]. When both LFMA signals are compared, see the insets in Figure 18a (up) and 18b (down) found that the magnetically ordered micrometer-sized YIG particles have an LFA signal with evident hysteresis around zero magnetic fields. Conversely, YIG nanoparticles only exhibited a linear LFMA response with no hysteresis and just a constant slope, which slowly decreases with temperature in coherence with their SPM nature.
3. Conclusions
Microwave power absorption techniques like FMR, LFA, and MAMMAS are useful for characterizing magnetic ordering, couplings, and anisotropies in soft magnetic ferrites.
In magnetically ordered materials, the presence of the LFA signal is considered a signature of the onset of magnetic ordering. The magnetization processes in unsaturated magnets produce hysteresis on the LFA spectrum. So LFA measurements are useful for detecting magnetic phase transitions and following magnetic anisotropies.
MAMMAS signal is originated from the magnetic field dependence of conduction and magnetization process, while the electric polarization process plays a minor role whenever a cylindrical microwave cavity is implemented.
Acknowledgments
DGAPA-UNAM financially supported this work through the grant
References
- 1.
Valenzuela R. Magnetic Ceramics [Internet]. Cambridge: Cambridge University Press; 1994 [cited 2016 May 3]. Available from: http://ebooks.cambridge.org/ref/id/CBO9780511600296 - 2.
Mattei JL, Chevalier A, Laur V. Ferrite ceramics at microwave Frequencies: Applications and characterization. In: Encyclopedia of Materials: Technical Ceramics and Glasses [Internet]. Amsterdam (NL): Elsevier; 2021. [cited 2023 Jun 16]. pp. 183-205. Available from: https://linkinghub.elsevier.com/retrieve/pii/B9780128035818117655 - 3.
Hao A, Ning X. Recent advances in spinel ferrite-based thin films: Synthesis, performances, applications, and beyond. Frontiers in Materials. [Internet]. 2021; 8 (November):1-9. DOI: 10.3389/fmats.2021.718869 - 4.
Mallmann EJJ, Sombra ASB, Goes JC, Fechine PBA. Yttrium iron garnet: Properties and applications review. Solid State Phenomena [Internet]. 2013; 202 :65-96. Available from:https://www.scientific.net/SSP.202.65 - 5.
Serga AA, Chumak AV, Hillebrands B. YIG magnonics. Journal of Physics D: Applied Physics [Internet]. 2010; 43 (26):264002. Available from:https://iopscience.iop.org/article/10.1088/0022-3727/43/26/264002 - 6.
Harris VG, Geiler A, Chen Y, Yoon SD, Wu M, Yang A, et al. Recent advances in processing and applications of microwave ferrites. Journal of Magnetism and Magnetic Materials. 2009; 321 (14):2035-2047 - 7.
Pardavi-Horvath M. Microwave applications of soft ferrites. Journal of Magnetism and Magnetic Materials. 2000; 215 :171-183 - 8.
Houbi A, Aldashevich ZA, Atassi Y, Bagasharova Telmanovna Z, Saule M, Kubanych K. Microwave absorbing properties of ferrites and their composites: A review. Journal of Magnetism and Magnetic Materials. North-Holland; [Internet]. 2021; 529 :167839. Available from:https://linkinghub.elsevier.com/retrieve/pii/S0304885321001153 - 9.
Vonsovskii SV. Ferromagnetic resonance: The phenomenon of resonant absorption of a high-frequency magnetic field in ferromagnetic substances. In: Vonsovskii SV, editor. Ferromagnetic Resonance. 1st ed. Oxford, UK: Elsevier; [Internet]; 1966. p. 326. Available from: www.sciencedirect.com/science/book/9780080110271 - 10.
Yalcin O. Ferromagnetic resonance. In: Yalçın O, editor. Ferromagnetic Resonance - Theory and Applications [Internet]. Rijeka (HR): InTech; 2013. pp. 1-46. Available from: http://www.intechopen.com/books/ferromagnetic-resonance-theory-and-applications/ferromagnetic-resonance - 11.
Valenzuela R, Alvarez G, Montiel H, Gutiérrez MP, Mata-Zamora ME, Barrón F, et al. Characterization of magnetic materials by low-field microwave absorption techniques. Journal of Magnetism and Magnetic Materials [Internet]. 2008; 320 (14):1961-1965. Available from:https://linkinghub.elsevier.com/retrieve/pii/S0304885308000565 - 12.
Alvarez G, Zamorano R. Characteristics of the magnetosensitive nonresonant power absorption of the microwave by magnetic materials. Journal of Alloys and Compounds. 2004; 369 (1–2):231-234. Available from:https://linkinghub.elsevier.com/retrieve/pii/S0925838803009630 - 13.
Rado GT, Wright RW, Emerson WH, Ferromagnetism at Very High Frequencies. III. Two mechanisms of dispersion in a ferrite. Physics Review [Internet]. 1950; 80 (2):273-280. DOI: 10.1103/PhysRev.80.273 - 14.
Landau LD, Lifshits EM. Continuum Electrodynamics. 2nd ed. Vol. 8. Theoretical physics: Butterworth-Heinemann; 1982 - 15.
Wampler J, Hua N, Kukreja R, Ramìrez JG, Basaran AC, Fullerton EE, et al. Electromagnetic origin of the microwave absorption response of Fe3O4 thin films. Physical Review B. 2022; 106 (6):L060402. DOI: 10.1103/PhysRevB.106.L060402 - 16.
Maksymov IS, Kostylev M. Broadband stripline ferromagnetic resonance spectroscopy of ferromagnetic films, multilayers and nanostructures. Physica E: Low-dimensional Systems and Nanostructures. [Internet]. 2015; 69 :253-293. DOI: 10.1016/j.physe.2014.12.027 - 17.
Lo CK. Instrumentation for ferromagnetic resonance spectrometer. In: Yalcin O, editor. Ferromagnetic Resonance - Theory and Applications. [Internet]. Rijeka: InTech; 2013. pp. 47-62. DOI: 10.5772/56069 - 18.
Heinrich B. Radio Frequency Techniques. In: Heinrich B, JAC B, editors. Ultrathin Magnetic Structures II [Internet]. Berlin, Heidelberg: Springer Berlin Heidelberg; 1994. pp. 195-296. DOI: 10.1007/3-540-27166-X_3 - 19.
Webb A. Cavity- and waveguide-resonators in electron paramagnetic resonance, nuclear magnetic resonance, and magnetic resonance imaging. Progress in Nuclear Magnetic Resonance Spectroscopy [Internet]. 2014; 83 :1-20. DOI: 10.1016/j.pnmrs.2014.09.003 - 20.
Montiel H, Alvarez G. Detection of magnetic transitions by means of ferromagnetic resonance and microwave absorption techniques. In: Yalcin O, editor. Ferromagnetic Resonance - Theory and Applications [Internet]. Rijeka: InTech; 2013. pp. 63-92. DOI: 10.5772/55962 - 21.
Poole CP. Electron Spin Resonance: A Comprehensive Treatise on Experimental Techniques. 2nd ed. New York: John Wiley & Sons; 1983 - 22.
Gurevich AG, Melkov GA. Magnetization Oscillations and Waves [Internet]. 1st ed. Boca Raton (FL): CRC Press; 1996. Available from: https://www.crcpress.com/Magnetization-Oscillations-and-Waves/Gurevich-Melkov/p/book/9780849394607 - 23.
Gilbert TL. Classics in magnetics a phenomenological theory of damping in ferromagnetic materials. IEEE Transactions on Magnetics. [Internet]. 2004; 40 (6):3443-3449. DOI: 10.1109/TMAG.2004.836740 - 24.
Gutiérrez MP, Alvarez G, Montiel H, Zamorano R, Valenzuela R. Study of the Verwey transition in magnetite by low field and magnetically modulated nonresonant microwave absorption. Journal of Magnetism and Magnetic Materials [Internet]. 2007; 316 (2):e738-e740. Available from:https://linkinghub.elsevier.com/retrieve/pii/S0304885307004155 - 25.
Nabereznykh VP, Tsindlekht MI. Nonresonant microwave absorption in nickel near the curie point. Journal of Experimental and Theoretical Physics Letters [Internet]. 1982; 36 (4):157. Available from:http://jetpletters.ru/ps/1332/article_20129.shtml - 26.
Owens FJ. DC magnetic field-dependent microwave absorption in CMR material, La0.7Sr0.3MnO3. Journal of Physics and Chemistry of Solids [Internet]. 1997; 58 (9):1311-1314. Available from:https://www.sciencedirect.com/science/article/pii/S0022369797000401 - 27.
Alvarez G, Montiel H, Barron JF, Gutierrez MP, Zamorano R. Yafet–Kittel-type magnetic ordering in Ni0.35Zn0.65Fe2O4 ferrite detected by magnetosensitive microwave absorption measurements. Journal of Magnetism and Magnetic Materials [Internet]. 2010; 322 (3):348-352. Available from:https://linkinghub.elsevier.com/retrieve/pii/S0304885309009536 - 28.
Montiel H, Alvarez G, Gutiérrez MP, Zamorano R, Valenzuela R. Microwave absorption in Ni-Zn ferrites through the curie transition. Journal of Alloys and Compounds. 2004: 369 (1-2):141-143. DOI: 10.1016/j.jallcom.2003.09.074 - 29.
Lee SJ, Tsai CC, Cho H, Seo M, Eom T, Nam W, et al. Hysteretic characteristics of low-field microwave absorption of a Co thin film. Journal of Applied Physics [Internet]. 2009; 106 (6):063922. DOI: 10.1063/1.3204648 - 30.
Montiel H, Alvarez G, Betancourt I, Zamorano R, Valenzuela R. Correlations between low-field microwave absorption and magnetoimpedance in Co-based amorphous ribbons. Applied Physics Letters [Internet]. 2005; 86 (7):1-3. DOI: 10.1063/1.1861959 - 31.
Cervellino A, Frison R, Cernuto G, Guagliardi A, Masciocchi N. Lattice parameters and site occupancy factors of magnetite–maghemite core–shell nanoparticles. A critical study. Journal of Applied Crystallography [Internet]. 2014; 47 (5):1755-1761. DOI: 10.1107/S1600576714019840 - 32.
Walz F. The Verwey transition - a topical review. Journal of Physics. Condensed Matter [Internet]. 2002; 14 (12):R285-R340. Available from:https://iopscience.iop.org/article/10.1088/0953-8984/14/12/203 - 33.
Muxworthy AR, McClelland E. Review of the low-temperature magnetic properties of magnetite from a rock magnetic perspective. Geophysical Journal International [Internet]. 2000; 140 (1):101-114. Available from:https://academic.oup.com/gji/article/140/1/101/707798 - 34.
Rozenberg GK, Pasternak MP, Xu WM, Amiel Y, Hanfland M, Amboage M, et al. Origin of the Verwey transition in magnetite. Physical Review Letters [Internet]. 2006; 96 (4):045705. Available from:https://journals.aps.org/prl/abstract/10.1103/PhysRevLett.96.045705 - 35.
Senn MS, Wright JP, Attfield JP. Charge order and three-site distortions in the Verwey structure of magnetite. Nature [Internet]. 2012; 481 (7380):173-176. Available from:https://www.nature.com/articles/nature10704 - 36.
Senn MS, Wright JP, Cumby J, Attfield JP. Charge localization in the Verwey structure of magnetite. Physical Review B [Internet]. 2015; 92 (2):024104. DOI: 10.1103/PhysRevB.92.024104 - 37.
Bohra M, Agarwal N, Singh V. A short review on Verwey transition in nanostructured Fe3O4 materials [Internet]. Journal of Nanomaterials. 2019; 2019 :1-18. Available from:https://www.hindawi.com/journals/jnm/2019/8457383/ - 38.
Gridin VV, Hearne GR, Honig JM. Magnetoresistance extremum at the first-order Verwey transition in magnetite (Fe3O4). Physical Review B [Internet]. 1996; 53 (23):15518-15521. DOI: 10.1103/PhysRevB.53.15518 - 39.
Gasparov LV, Tanner DB, Romero DB, Berger H, Margaritondo G, Forró L. Infrared and Raman studies of the Verwey transition in magnetite. Physical Review B. 2000; 62 (12):7939-7944. DOI: 10.1103/PhysRevB.62.7939 - 40.
Alvarez G, Montiel H. Microwave absorption dynamics in Fe3O4 nanopowders around Verwey transition. Journal of Physics Conference Series [Internet]. 2022; 2307 (1):012040. Available from:https://iopscience.iop.org/article/10.1088/1742-6596/2307/1/012040 - 41.
Bickford LR. Ferromagnetic resonance absorption in magnetite single crystals. Physics Review [Internet]. 1950; 78 (4):449-457. Available from:https://journals.aps.org/pr/abstract/10.1103/PhysRev.78.449 - 42.
Srivastava A, Singh AV, Mohammadi JB, Mewes C, Gupta A, Mewes T. Ferromagnetic resonance study of the Verwey phase transition of magnetite thin film on MgGa₂O₄(001) substrate. IEEE Transactions on Magnetics [Internet]. 2020; 56 (12):1-6. Available from:https://ieeexplore.ieee.org/document/9201012/ - 43.
Schlömann E. Ferromagnetic resonance in polycrystalline ferrites with large anisotropy-I. general theory and application to cubic materials with a negative anisotropy constant. Journal of Physics and Chemistry of Solids [Internet]. 1958; 6 (2–3):257-266. Available from:https://www.sciencedirect.com/science/article/pii/0022369758901021 - 44.
Kaur A, Sharma P, Bhardwaj S, Kumar M, Sharma I, Batoo KM, et al. A review on synthesis and characterizations of mixed nickel-zinc ferrites. In: Sharma G, Kumar A, Dhiman P, editors. Ferrite - Nanostructures with Tunable Properties and Diverse Applications. Vol. 1112. Materials Research Foundations. Millersville (PA): Materials Research Forum LLC; 2021. pp. 189-217 - 45.
Dionne GF. Magnetic oxides [Internet]. In: Magnetic Oxides. Boston, MA: Springer US; 2009. pp. 1-466. Available from: http://link.springer.com/10.1007/978-1-4419-0054-8 - 46.
Yafet Y, Kittel C. Antiferromagnetic arrangements in ferrites. Physics Review [Internet]. 1952; 87 (2):290-294. Available from:https://journals.aps.org/pr/abstract/10.1103/PhysRev.87.290 - 47.
Barron-Lopez JF, Montiel H, Mata-Zamora ME, Alvarez G. Obtención y caracterización de películas magnéticas de ferrita de Ni-Zn por depósito electroforético. Superf y Vacio. 2011; 24 (4):126-131. Available from:http://ref.scielo.org/hdhpk7 - 48.
Murthy NSS, Natera MG, Youssef SI, Begum RJ, Srivastava CM. Yafet-kittel angles in zinc-nickel ferrites. Physics Review [Internet]. 1969; 181 (2):969-977. DOI: 10.1103/PhysRev.181.969 - 49.
Lutsev L, Shutkevich V. Sharp increase of microwave absorption in nonequilibrium MnZn- and NiZn-nano ferrites. Journal of Physics D: Applied Physics [Internet]. 2016; 49 (50):505002. Available from:https://iopscience.iop.org/article/10.1088/0022-3727/49/50/505002 - 50.
Bertaut F, Forrat F. Structure des ferrites ferrimagnetiques des terres rares. Comptes Rendus hebdomadaires des séances de l’Académie des Sciences. 956; 242 (1):382 - 51.
Pauthenet R. Spontaneous magnetization of some garnet ferrites and the Aluminum substituted garnet ferrites. Journal of Applied Physics. 1958; 29 (3):253. Available from:http://scitation.aip.org/content/aip/journal/jap/29/3/10.1063/1.1723094 - 52.
Geller S, Gilleo MA. Structure and ferrimagnetism of yttrium and rare-earth–iron garnets. Acta Crystallographica. 1957; 10 (3):239-239. Available from:http://scripts.iucr.org/cgi-bin/paper?S0365110X57000729 - 53.
Stancil D, Prabhakar A. Spin Waves. Boston, MA: Springer US; [Internet]; 2009. DOI: 10.1007/978-0-387-77865-5 - 54.
Larsen PK, Metselaar R. Electrical properties of yttrium iron garnet. In: Paoletti A, Societa Italiana di Fisica, editors. Physics of Magnetic Garnets: Proceedings of the International School of Physics (Enrico Fermi) [Internet]. Course LXX; 27 June-9 July 1977. Amsterdam (NL): North-Holland Publishing Company; 1978. pp. 417–444. Available from: https://pure.tue.nl/ws/files/1871955/620146.pdf - 55.
LeCraw RC, Spencer EG, Porter CS. Ferromagnetic resonance line width in yttrium iron garnet single crystals. Physics Review. 1958; 110 (6):1311-1313. DOI: 10.1103/PhysRev.110.1311 - 56.
Glass HL, Elliot MT. Attainment of the intrinsic FMR linewidth in yttrium iron garnet films grown by liquid phase epitaxy. Journal of Crystal Growth. 1976; 34 (2):285-288 - 57.
Stognij A, Lutsev L, Novitskii N, Bespalov A, Golikova O, Ketsko V, et al. Synthesis, magnetic properties, and spin-wave propagation in thin Y3Fe5O12 films sputtered on GaN-based substrates. J Phys D Appl Phys [Internet]. 2015; 48 (48):485002. Available from:https://iopscience.iop.org/article/10.1088/0022-3727/48/48/485002 - 58.
Collet M, Gladii O, Evelt M, Bessonov V, Soumah L, Bortolotti P, et al. Spin-wave propagation in ultra-thin YIG-based waveguides. Applied Physics Letters. 2017; 110 :092408 - 59.
Yu H, d'Allivy KO, Cros V, Bernard R, Bortolotti P, Anane A, et al. Magnetic thin-film insulator with ultra-low spin wave damping for coherent nano magnonics. Scientific Reports. 2014; 4 :6848. Available from:https://www.nature.com/articles/srep06848 - 60.
Rezende SM. Fundamentals of Magnonics. Cham, Switzerland: Springer; 2020 - 61.
Sun Y, Chang H, Kabatek M, Song YY, Wang Z, Jantz M, et al. Damping in yttrium iron garnet nanoscale films capped by platinum. Physical Review Letters. 2013; 111 (10):106601. Available from:http://link.aps.org/doi/10.1103/PhysRevLett.111.106601 - 62.
Klinger S, Amin V, Geprägs S, Ganzhorn K, Maier-Flaig H, Althammer M, et al. Spin-torque excitation of perpendicular standing spin waves in coupled YIG=Co Heterostructures. Physical Review Letters. 2018; 120 :127201 - 63.
Onbasli MC, Kehlberger A, Kim DH, Jakob G, Kläui M, Chumak AV, et al. Pulsed laser deposition of epitaxial yttrium iron garnet films with low Gilbert damping and bulk-like magnetization. APL Materials [Internet]. 2014; 2 (10):106102. DOI: 10.1063/1.4896936 - 64.
Yamada K, Kogiso K, Shiota Y, Yamamoto M, Yamaguchi A, Moriyama T, et al. Dependence of Gilbert damping constant on microstructure in nanocrystalline YIG coatings prepared by co-precipitation and spin-coating on a Si substrate. Journal of Magnetism and Magnetic Materials. 2020; 513 :167253. DOI: 10.1016/j.jmmm.2020.167253 - 65.
Montiel H, Alvarez G, Conde-Gallardo A, Zamorano R. Effect of the particle size on the microwave absorption in the yttrium-iron garnet. Journal of Nano Research. 2014; 28 :73-81. Available from:https://www.scientific.net/JNanoR.28.73