Open Access is an initiative that aims to make scientific research freely available to all. To date our community has made over 100 million downloads. It’s based on principles of collaboration, unobstructed discovery, and, most importantly, scientific progression. As PhD students, we found it difficult to access the research we needed, so we decided to create a new Open Access publisher that levels the playing field for scientists across the world. How? By making research easy to access, and puts the academic needs of the researchers before the business interests of publishers.
We are a community of more than 103,000 authors and editors from 3,291 institutions spanning 160 countries, including Nobel Prize winners and some of the world’s most-cited researchers. Publishing on IntechOpen allows authors to earn citations and find new collaborators, meaning more people see your work not only from your own field of study, but from other related fields too.
To purchase hard copies of this book, please contact the representative in India:
CBS Publishers & Distributors Pvt. Ltd.
www.cbspd.com
|
customercare@cbspd.com
Due to the special structure of the woven ceramic matrix composites, challenges and difficulties in the grinding process gradually emerge. How to ensure the reasonable and reliable application of materials has become a hot topic in the present research. The force model is beneficial to understand, predict, and even control the machining process. This chapter investigates the grinding force and process optimization of woven ceramic matrix composites, especially grinding force modeling, surface quality, and process optimization of woven ceramic matrix composites during grinding. A new force model considering the fiber orientation of WCMC is developed based on the energy balancing theory. Through the construction of a mathematical model, the study demonstrates the correlation of grinding force with the processing parameters and the composite fiber orientation. The optimum process parameters were obtained by aiming at minimum grinding force and maximum surface quality. The results show that the predictable model has good consistency with the experimental results, and fiber orientation has a major influence on the grinding force. This research can be used to predict the grinding force, thus conducting the machining and controlling their processing quality.
School of Mechanical Engineering, Tianjin University, Tianjin, China
Key Laboratory of Advanced Ceramics and Machining Technology, Ministry of Education, Tianjin University, Tianjin, China
Jingguo Zhou
School of Mechanical Engineering, Tianjin University, Tianjin, China
Key Laboratory of Advanced Ceramics and Machining Technology, Ministry of Education, Tianjin University, Tianjin, China
Jinhua Wei
Aerospace Research Institute of Materials and Processing Technology, Beijing, China
Haoji Wang
School of Mechanical Engineering, Tianjin University, Tianjin, China
Key Laboratory of Advanced Ceramics and Machining Technology, Ministry of Education, Tianjin University, Tianjin, China
Tianyi Sui*
School of Mechanical Engineering, Tianjin University, Tianjin, China
Key Laboratory of Advanced Ceramics and Machining Technology, Ministry of Education, Tianjin University, Tianjin, China
*Address all correspondence to: tdlinbin@126.com and suity@tju.edu.cn
1. Introduction
Woven ceramic matrix composites (WCMC) are more and more widely used in the military, transportation [1], shipping, aerospace, nuclear industry [2, 3, 4], and other fields due to their excellent properties of high specific stiffness, high-temperature resistance, corrosion resistance, high toughness, and wear resistance. However, due to the anisotropy of its materials, it is difficult to carry out mechanical processing [5]. Faced with the stability, precision, and low damage requirements of braided ceramic matrix composites, the most common machining method for WCMC is grinding [6, 7].
Grinding force is an important index to characterize the influence of grinding parameters on the grinding process. Grinding force is produced by elastic deformation, plastic deformation of the workpiece and the interaction between abrasive particle, workpiece and grinding chip [8, 9, 10]. It is related to almost all process factors of grinding. Therefore, it is of great significance to establish a grinding force prediction model [11]. For the grinding of composite materials, research on the machining force of ceramic material both on experimental and analytical aspects has been in-depth investigated [12, 13, 14, 15]. Durgumahanti et al. [16] established a new grinding force model developed by incorporating the effects of variable coefficient of friction and plowing force. Li et al. [17] developed a new grinding force model for micro-grinding of reaction-bonded silicon carbide (RB-SiC) ceramics. It was found that plowing and fracture were the dominant removal modes. Furthermore, comparisons are made between the values predicted and the experimental data, indicating that the proposed model is acceptable and can be used to simulate the grinding force for RB-SiC ceramics in practice. Zhang et al. [12] studied the grinding force of crystalline ceramic materials and amorphous ceramic materials in the experiment to improve the mechanical models of ceramics. The result shows that the grinding force models are not applicable for non-crystalline ceramic fused silica and the specific grinding energy fluctuates irregularly as a function of the maximum undeformed chip thickness seen from the experiment. So far, one of the main focuses is on ultrasonic-assisted machining [18, 19, 20] of WCMC and the corresponding force model to improve processing quality. But the efficiency is lower and more costly than ordinary machining methods. Though the machining force model of ordinary milling [13, 21], drilling [22], and even grinding [23, 24] of WCMC has also been researched, the theory is always based on fracture mechanics, the maximum undeformed chip thickness, or aggregate force including plowing, scratching, and removing neglecting fiber orientation and idealizing the model because of the complication of woven structure and reinforced particles or short fibers. In the review of the previous work, though WCMC grinding force has been paid great attention to and many experimental studies have already been made, the model considering fiber orientation is a gap. Hence, a grinding force model for WCMC involving fiber orientation is essential.
This chapter mainly develops a grinding for the model of WCMC considering fiber orientation based on the energy balancing theory to fill the gap. The influence of grinding parameters on specific energy and grinding force is analyzed. Taking the SiO2f/SiO2 as an example, a series of experiments were carried out to verify the accuracy of the model. This research, on one hand, can be used to predict the grinding force of WCMC; on the other hand, it provides a baseline for selecting the proper machine and tool for WCMC processing.
2. Modeling of the grinding force of woven ceramic matrix composites
2.1 Force modeling of the single particle in grinding WCMC
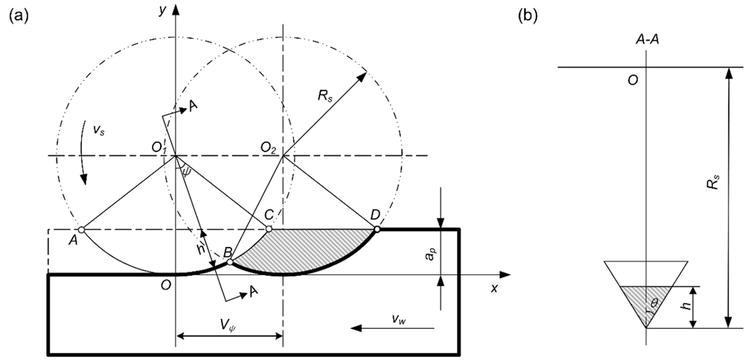
Points A and C are the positions where the diamond first cuts in and leaves the workpiece, respectively. Points B and D are the locations where particles touch and leave the workpiece for a second time [25]. It is worth noting that point B is the coincident point of the grit motion track, as shown in Figure 1. Therefore, the shaded area BCD can be viewed as the amount of particle removal except for the first one (Figure 1(a)). Assuming the process is ideal, the material is completely removed in each cut, and the first cut’s difference is neglected.
Figure 1.
Particle trajectory during the grinding process: (a) relative motion trajectories of adjacent particles and (b) cross section of the chip thickness [25].
2.1.1 Kinematic analysis of abrasive particles
In the XOY coordinate system, the grit motion track equation is (Figure 1(a)):
x=Rssinψ+VψE1
y=Rs1−cosψE2
where Rs (mm) is the radius of the grinding wheel, ψ (rad) is the angle between the instantaneous position of grain and vertical direction in the grinding process, and Vψ (mm) is the horizontal travel distance when the wheel is turned at an angle ψ.
Introducing the time variable, the grit relative motion track equation changing over time is
xt=Rssinvst/Rs+vwtE3
yt=Rs1−cosvst/RsE4
2.1.2 Cross-sectional area of the chip thickness
According to Figure 1(a), it can be obtained as follows:
cosvst/Rs=Rs−ap/Rs−hE5
h=Rs−Rs−ap/cosvst/RsE6
In Figure 1(b), the cross-sectional area of the chip thickness is
st=12⋅2htanθ⋅h=h2tanθ=Rs−Rs−apcosvst/Rs2tanθE7
where θ (°) is half of the grain vertex angle. h(mm) is the cutting height of the grain, and ap (mm) is the grinding depth. Because ψ=vst/Rs is so small that cosvst/Rs≈1, then
st≈ap2tanθE8
2.1.3 Moments grit cutting into and out of workpiece
When grit cuts out of the workpiece, h = 0 in Eq. (5), so:
cosvstnmax/Rs=1−ap/RsE9
Where tnmax(s) is the moment grit cuts out of workpiece for each cutting process. Hence:
During one cutting process, the total work single grit does is E=Ftvs+vwt1max−t2,where Ft is the tangential grinding force, and the total removal volume is V as Eq. (23) shows. Then, the specific grinding energy is
The general specific grinding energy u=Ftvs+vwvwapb in which b is the width of grit cutting into the workpiece when grinding depth is ap for single-grain grinding. b=2aptanθ, so:
u=Ftvs+vw2ap2vwtanθE25
2.1.7 Grinding force model of single abrasive
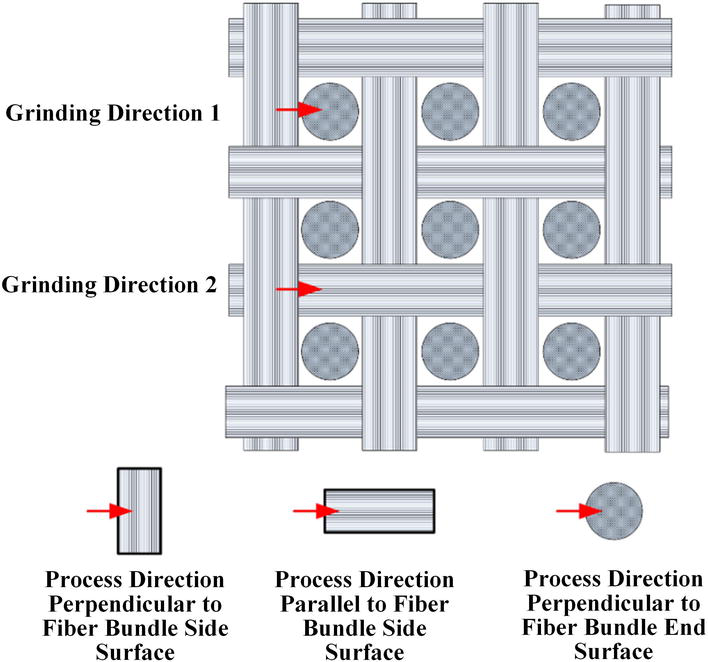
There are two fiber orientations in both grinding directions, respectively: perpendicular to the fiber bundle end and side surface in direction 1, and perpendicular and parallel to the fiber bundle side surface on direction 2. Figure 2 shows the relation between the fiber orientation of WCMC and the grinding direction.
Figure 2.
Relation sketch between fiber orientation of WCMC and grinding direction [25, 26].
Here are some instructions: the required energies removing unit volume perpendicular to the fiber bundle end and side surface are uend and uper1 on direction 1, respectively. The removing unit volumes parallel and perpendicular to the fiber bundle side surface are uper2 and upar, and the volume ratios of the fiber bundle end surface on direction 1 and parallel to the fiber bundle side surface on direction 2 are β and γ separately, then
On direction 1:
Vend=βV,Vper1=1−βVE26
On direction 2:
Vpar=γV,Vper2=1−γVE27
where Vend and Vper1 are the removal volumes of perpendicular to the fiber bundle end and side surface on direction 1, and Vpar and Vper2 are the removal volumes of parallel and perpendicular to the fiber bundle side surface on direction 2.
So, on directions 1 and 2, the needed energy removing volume V is
E1=Venduend+Vper1uper1=uendβV+uper11−βVE28
E2=Vparupar+Vper2uper2=uparγV+uper21−γVE29
According to energy balance E=Ftl, substituting Eqs. (21), (23), (28) and (29), then.
In the formulas above, uend, uper1, uper2, and upar are all related to processing parameters and material properties of each fiber orientation. If the composite is not 3D orthogonal, fiber orientation cannot be identified obviously, assuming that uf=uendβ+uper11−β or uf=uparγ+uper21−γ, then:
Ft=2πRstanθap2vwuf2apRsvw+vs+πRsvwE32
where uf is the specific energy related to grinding direction and fiber orientation. Then, the normal force Fn can be obtained through Eq. (33) as follows:
Fn=Ft±CF/μE33
Here, μ is the friction coefficient among grinding grain, processed material surface, and debris, and CF is a constant that is related to the grinding process.
2.2 The analysis and modeling of grinding force
Based on Eqs. (32) and (33), the theoretical model of tangential force during grinding is obtained by introducing the randomness of abrasive particles [6]:
where E⋅ refers to a mathematical expectation; ξ¯ and tanθ'¯ are the expectations of ξ and tanθ, respectively. Rs is the grinding wheel radius; ξ is a constant related to Rs; α, β, and γ are the fitting coefficients of ap, vs, and vw with actual processing, which is related to grinding direction and fiber orientation; θ' is half of the single-grain tip angle. Therefore, once the grinding wheel and the workpiece are selected, the width b, the radius, the grains exposure height distribution, and the grains protrusion angle are invariable. For this reason, the working conditions and the grinding wheel state are practically constant, given that the wheel wear is ignored. Thus, the expected ξ and θ' are constant.
Since vw≪vs, ap≪Rs for each grain, meaning that the minuscule changes of the true Rs and vs. are eliminated. When the nominal vs and vw values are constant during processing and ap is variable, Eq. (34) can be simplified as
Ft¯=ξ'tanθ'¯Eapα'E35
where ξ' is a constant describing the grinding wheel condition and the machining process and processing parameters vs and vw, while α' are the fitting coefficient of ap.
api=hi−hmax−apE36
According to the law of large numbers, the grain exposure height hi distribution follows a normal distribution:
hi∼Nh¯σ2E37
where h¯is the average value of hi, σ is the standard error, and the actual depth api also follows a normal distribution:
Eq. (39) is a transcendental equation with too many variables to obtain an analytical solution. So, assuming:
fap=∫0apapiα'12πσe−api−h¯−hmax+ap2σ2dapiE40
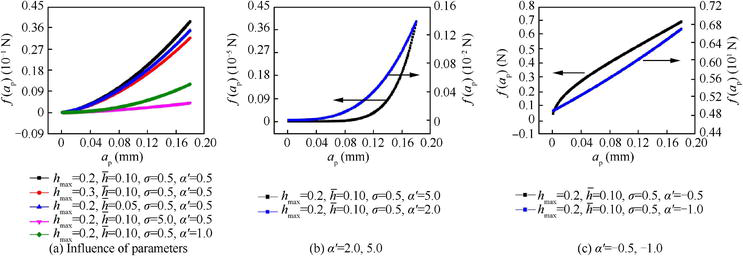
The trends of the numerical solution of tangential force with grinding depth are shown in Figure 3, reflecting that independently of the changes in other parameters, the value of f(ap) increases with ap. Thus, F¯t also increases.
Figure 3.
Trends of numerical solution of tangential force with grinding depth [6].
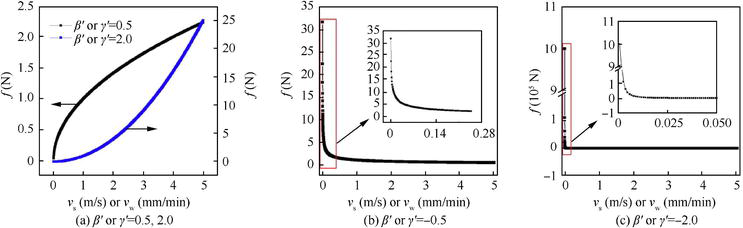
When the nominal value of ap is constant,hmax>apand hi≥hmax−apduring processing. vs or vw is changing, meaning that Eq. (34) can be simplified as
Ft¯=ξ'tanθ'¯vsβ'E41
Ft¯=ξ'tanθ'¯vwγ'E42
where β'and γ'are the fitting coefficients vs and vw. Assuming that f=vsβ',f=vwγ', the numerical solution variation trend of the variable f is as shown in Figure 4.
Figure 4.
Trends of numerical solution of tangential force with wheel speed or feed rate [6].
On the other hand, when hmax<ap, all the grains and the wheel matrix take part in the grinding process. Thus, the tangential force will have two components: the first caused by the interaction between the grain and workpiece, and the second caused by the interaction between the wheel matrix and workpiece. The resulting situations for the tangential and normal forces are more complicated than those of single-grain grinding.
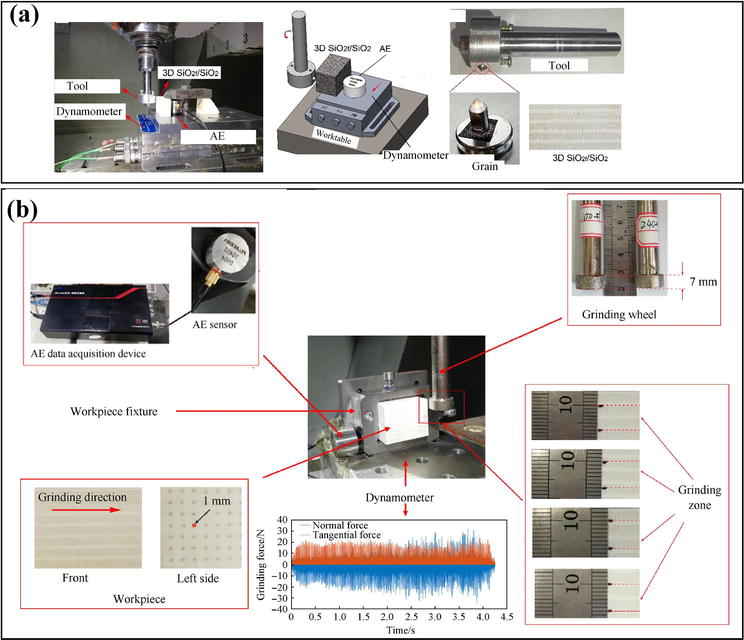
The grinding type used in this study is up-grinding without coolant. The dynamometer is Kistler 9257A, and the data acquisition system is Kistler 5070A which was used with the dynamometer sampling frequency of 20 kHz. Grinding experiments are performed on the JDUT400E CNC machine. The workpiece material is 3D orthogonal SiO2f/SiO2. After the experiment, the surface roughness Sa is obtained via a non-contact 3D optical measurement instrument NANOVEA ST400. In the single-particle scratching test, the grinding wheel is customized with a single diamond grain, and the radius of rotation during abrasive processing is 13.6 mm. The specimens have the dimensions of 50 × 25 × 15 mm, and grinding are along the longest direction with the grain engaged across the entire workpiece length. The real grinding process is shown in Figure 5(a). In the grinding test, the tool is specially designed as an electroplated diamond with grain numbers of 100 # and 240 #. The wheel diameter is 16 mm, which was used to carry out all the grinding experiments. There are two fiber orientations on the processing surface. Since the grinding forces of fibers in different directions vary, the wheel width of 7 mm was selected to ensure that the grinding zone includes two areas containing two different fiber orientations. The specimens have dimensions of 40 × 27 × 25 mm. The front surface is the grinding surface, while the grinding direction is along the 40 mm side. All the workpiece surfaces are ground to planes in advance, guaranteeing that, independently of the grinding depth, machining does not cross the 1 mm thickness fiber layer. The real grinding process is shown in Figure 5(b).
Figure 5.
Experiment setup: (a) the single particle scratch test and (b) the grinding experiment setup [6, 25].
The process parameters of the single particle scratching test and grinding wheel test are shown in Table 1 and Table 2, respectively. In the single-particle scratch test, the grinding experimental parameter design adopts single-factor grinding. In the grinding test, a full factorial experiment is adopted. The workpiece feed rate has a lower influence on the processing force than the grinding speed and depth. Thus, the workpiece feed rate is set to 500 mm/min. In order to compare with the grinding experiment of single grit, the selected grinding wheel speed and grinding depth level are the same as that of single grit. And each experimental run (for each of the conditions) is replicated three times.
Parameters
Value
Grinding wheel radius Rs (mm)
13.6
Grain vertex half angle θ (°)
38.7
Grinding wheel speed vs (r/min)
1000, 1500, 2000, 2500, 3000
Feed rate of workpiece vw (mm/min)
500, 550, 600, 650, 700
Grinding depth ap (mm)
0. 1, 0. 12, 0. 14, 0.16, 0. 18
Table 1.
Grinding parameters of the single particle scratch test.
Parameters
Value
Feed rate (mm/min)
500
Grinding wheel
100#
240#
Grinding speed (m/s)
1.4
2.1
2.8
3.5
4.2
Grinding depth (mm)
0.1
0.12
0.14
0.16
0.18
Table 2.
Grinding parameters of the full factor experiment [6].
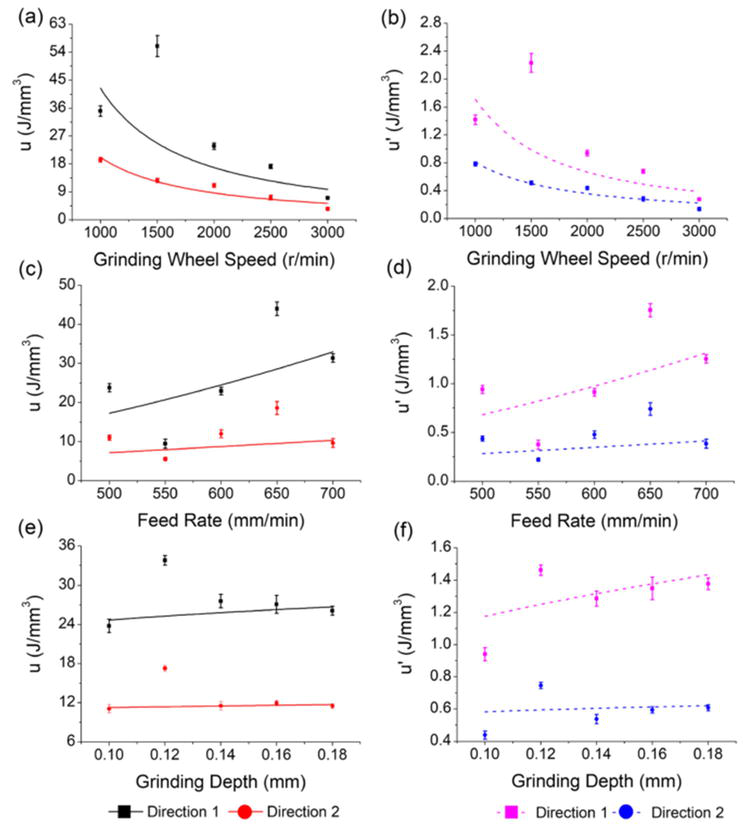
Through Eqs. (24) and (25), the specific grinding energies of our proposed model and the general model are obtained, as shown in Figure 6. Experimental result demonstrates that the specific grinding energy sharply decreases with increasing wheel speed and increases slightly with the increasing feed rate and grinding depth in both processing directions. The specific energy of direction 1 is larger than that of direction 2 under the same processing parameters. The proposed specific energies and the general ones have the same changing trends as each other under grinding parameters, but the values and the order of magnitude have a huge difference.
Figure 6.
Trends of specific grinding energy with different grinding parameters: (a), (c), (e) general specific energy. (b), (d), (f) proposed specific energy [25].
The difference between the general and the proposed models are reflected in two aspects. One is the model in the research and is based on single grain which is always taking part in the machining of each cut. The grain edge height is constant relative to the workpiece when the grinding depth is fixed. The other is the model that considers the contact period from t2 to t1 max between the grain and workpiece in one cut. It can be known that from the moment t1max to the next time the grain cutting into the workpiece, single grain does not take part in grinding anymore. Therefore, the angle ratio comparing Eqs. (24) and (25) appears, and the specific energy is smaller. Furthermore, each grain taking part in grinding does not always have contact with the workpiece during conventional wheel grinding, but when it cuts out of the workpiece or is within the cutting process, other grains are participating in cutting. Therefore, for conventional wheel grinding, the process is successive on a macroscopic scale; but for single grinding, the process is discontinuous no matter on a macroscopic or microscopic scale.
4.1.2 Force model verification
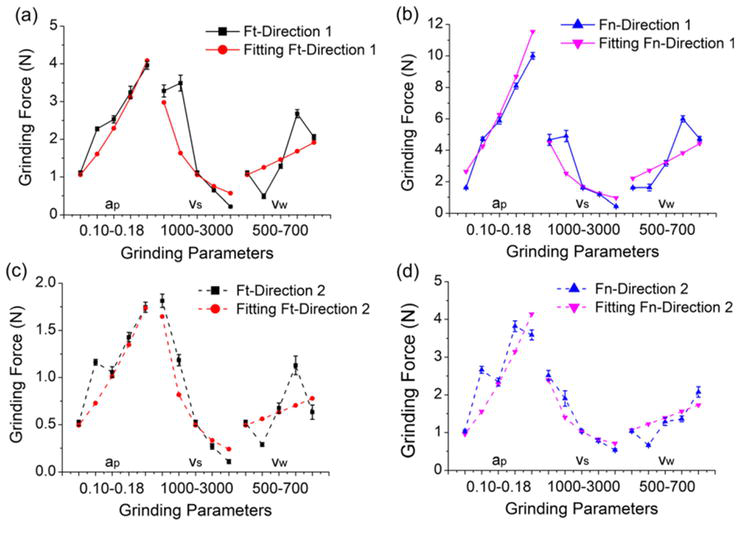
Figure 7 is the experimental and fitting results of the force with changing grinding parameters, which show good accordance with the experimental ones, and reflects the rationality of the force model. Meanwhile, the grinding force has a similar trend with the change of specific energy when the machining parameters change. This is because force is closely related to changes in energy. The grinding process is steadier, and the specific energy and the grinding force decrease. Inversely, increasing the feed rate will reduce the brittle fracture and increases the plastic deformation of the material resulting in a larger specific energy and grinding force. Increasing cutting depth will increase the material removal rate. Therefore, the integrated effects make the specific energy and the grinding force increase. From the global, the force and the specific energy are not just going up or down, and there are some fluctuations with the grinding parameters. The main reason is that the presence of reinforced fibers causes their fluctuations [27].
Figure 7.
Experimental and fitting results: (a) Ft on direction 1, (b) Fn on direction 1, (c) Ft on direction 2, and (d) Fn on direction 2 [25].
4.2 Grinding force analysis of grinding wheel
4.2.1 Effect of process parameters on grinding force
The grinding force contour maps with the change of grinding speed and depth are shown in Figure 8. It can be seen that the changes of tangential and normal forces are similar for the 100 # grinding wheel. A peak and closed profile was found in Figure 8(a) and (b), meaning that there is a grinding force turning point. Furthermore, the difference is revealed between the maximum values measured for tangential and normal forces. The largest tangential force was measured for a combination of the grinding speed 1.9–2.9 m/s and grinding depth 0.145–0.168 mm. On the other hand, the largest normal force was found for a combination of the grinding speed 2.7–3.0 m/s and grinding depth 0.117–0.139 mm. Generally speaking, the grinding force increases as the grinding speed decreases and the grinding depth increases, but there are some differences here. This phenomenon could be attributed to the change of fiber cutting types and tribological behavior between the abrasive grains and SiO2f/SiO2. With the increase in grinding depth and decrease in grinding speed, the wear debris is crushed into small pieces, which changes the SiO2 fiber cutting type, and causes a decrease in grinding force. The contour maps of grinding force using a 240 # grinding wheel are in Figure 8(c) and (d). Both tangential and normal forces are high when the grinding speed ranges from 2.0 to 2.4 m/s, and the grinding depth is 0.165–0.180 mm. Furthermore, when the grinding speed ranges from 1.4 to 1.9 m/s, the grinding depth is above 0.100 mm, the grinding wheel encounters a severe blockage.
Figure 8.
Grinding force contour maps with the change of grinding speed and depth [6].
4.2.2 Comparison of the force of the single particle and grinding wheel
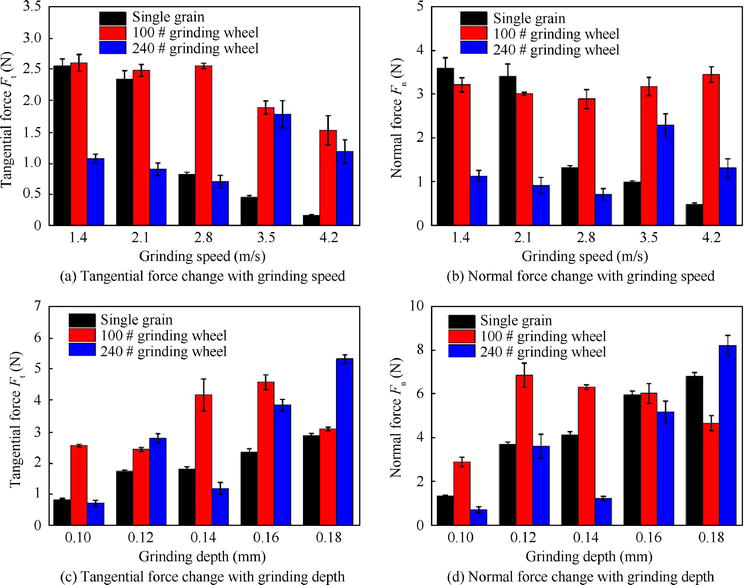
The grinding force for both the single-grain and grinding wheel grinding using the same parameters were shown in Figure 9. When the grinding depth is changed from 0.10 to 0.18 mm, the grinding speed is set to 2.8 m/s. The grinding speed changes from 1.4 to 4.2 m/s, while the grinding depth is set to 0.10 mm. The experimental results indicate that both the tangential and normal forces in single-grain grinding decrease with the grinding speed and increase with the grinding depth, as discussed in the previous study by the authors. However, the diamond wheel grinding performance is notably different. The diamond wheel grinding force fluctuates with the increases in grinding speed and grinding depth, particularly for 240 # grinding wheel. When testing the grinding force using a grinding wheel, the grains on the grinding wheel are much more complicated than the single-grain test. For example, the heights and conditions of the gains on the grinding wheel are different from each other. Thus, the contacting condition between the grinding wheel and the material surface is much more complicated than single-grain grinding. Due to the complexity of the grinding wheel diamond grains, the material removal type of grinding wheel will be significantly more complicated than single-grain scratching, that is the reason why the grinding performance of single-grain grinding and grinding wheel grinding is different.
Figure 9.
Force of single-grain and diamond wheel grinding [6].
4.2.3 Surface roughness after grinding
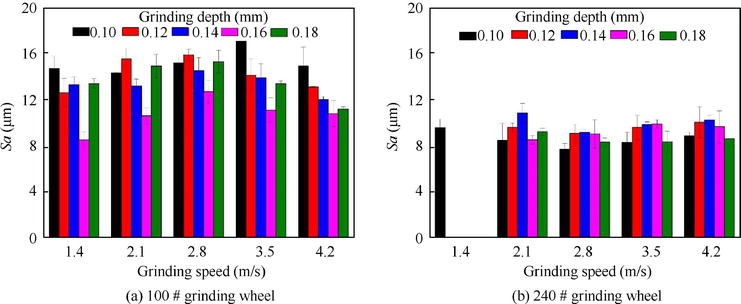
It was found that the surface roughness following the grinding using 240 # grinding wheel is notably smaller compared to 100 # grinding wheel, as shown in Figure 10. The difference in grain size of the two grinding wheels causes the difference in surface roughness. Larger grains cause wider and deeper scratches on the workpiece, leading to a rougher grinding surface. The grain size of 100 # grinding wheel is 124–178 um, and that of 240 # grinding wheel is 53–74 um.
Figure 10.
Surface roughness Sa under the different grinding speeds and depths [6].
Furthermore, with an increase in grinding speed, the surface roughness obtained using 100 # grinding wheel first increased and then decreased. The surface roughness in the 240 # grinding wheel first decreased and then increased. The changes trend of surface roughness and the grinding force was the same, indicating that a smoother surface is obtained when using a smaller grinding force. It should be noted that for 240 # grinding wheel under the grinding speed of 1.4 m/s, only the test with 0.1 mm grinding depth could be performed. The remaining four tests have failed due to severe grinding wheel blockage. Thus, no surface roughness data were shown in Figure 10(b).
4.2.4 Optimum grinding parameter
Table 3 shows the processing parameters corresponding to the minimum grinding force and surface roughness [28, 29, 30] of the two grinding wheels, respectively. By taking the intersection, the optimal machining parameters of the two grinding wheels can be obtained. At the same time, the respective nominal removal rates are calculated under the optimal processing parameters. Reasonable machining parameters should not only ensure the machining quality and reduce the damage to the workpiece and the tool, but also consider the processing efficiency.
In this chapter, a new force model of WCMC considering fiber orientation was proposed based on energy balancing theory and verified with the grinding experiment of 3D orthogonal SiO2f/SiO2. The main findings are listed as follows:
The study modifies the specific grinding energy model and proposes an analytical model to predict WCMC grinding force in single-grain processing in terms of fiber orientation.
Through the grinding experiments, the grinding force and the specific energy decrease with the increasing wheel speed but increase with the increasing feed speed and grinding depth.
During the grinding process, the force and specific energy of direction 1 are always larger than those of direction 2, and the normal force is always bigger than the tangential force.
Aiming at minimum grinding force and maximum surface quality, the optimum process parameters of two grinding wheels are obtained.
The research content of this paper includes some published papers, which have attracted wide attention. We will continue to carry out extensive research on the processing of ceramics in the future, especially the processing of woven ceramic matrix composite and ceramic electronic components.
1.Chen D, Liu Y, Meng M, et al. Dynamic axial crushing behaviors of circular composite tubes with different reinforcing fibers and triggers. International Journal of Mechanical Sciences. 2023;244:108083. DOI: 10.1016/j.ijmecsci.2022.108083
2.Wang H, Koyanagi T, Arregui-Mena DJ, et al. Anisotropic thermal diffusivity and conductivity in SiC/SiC tubes studied by infrared imaging and X-ray computed tomography. Ceramics International. 2022;48(15):21717-21727. DOI: 10.1016/j.ceramint.2022.04.153
3.Pan Z, Qiao F, Yu J, et al. Distribution of axial yarns on the localized deformation and damage mechanism of triaxial braided composite tubes. Thin-Walled Structures. 2022;177:109389. DOI: 10.1016/j.tws.2022.109389
4.Park JY, Kim D, Lee HG, et al. Fabrication and evaluation of C-ring strength of SiCf/SiC composite tube. Journal of the Korean Ceramic Society. 2021;58(6):718-727. DOI: 10.1007/s43207-021-00146-0
5.Teti R. Machining of composite materials. CIRP Annals - Manufacturing Technology. 2002;51(2):611-634. DOI: org/10.1016/S0007-8506(07)61703-X
6.Lin B, Wang H, Wei J, et al. Diamond wheel grinding characteristics of 3D orthogonal quartz fiber reinforced silica ceramic matrix composite. Chinese Journal of Aeronautics. 2021;34(5):404-414. DOI: 10.1016/j.cja.2020.12.026
7.Yao L, Liu Z, Song Q, et al. Prediction modelling of cutting force in rotary ultrasonic end grinding 2.5D woven SiO2f/SiO2 ceramic matrix composite. Composite Structures. 2023;304(2023):116448. DOI: 10.1016/j.compstruct.2022.116448
8.Yang Z, Zhu L, Lin B, et al. The grinding force modeling and experimental study of ZrO2 ceramic materials in ultrasonic vibration assisted grinding. Ceramics International. 2019;45(7):8873-8889. DOI: 10.1016/j.ceramint.2019.01.216
9.Li C, Li X, Wu Y, et al. Deformation mechanism and force modelling of the grinding of YAG single crystals. International Journal of Machine Tools and Manufacture. 2019;143:23-37. DOI: 10.1016/j.ijmachtools.2019.05.003
10.Li H, Yu T, Wang Z, et al. Detailed modeling of cutting forces in grinding process considering variable stages of grain-workpiece micro interactions. International Journal of Mechanical Sciences. 2016;126:319-339. DOI: 10.1016/j.ijmecsci.2016.11.016
11.Meng Q, Guo B, Zhao Q, et al. Modelling of grinding mechanics: A review. Chinese Journal of Aeronautics. 2022. DOI: 10.1016/j.cja.2022.10.006
12.Zhang Y, Lin B, Liu J, et al. An experimental study on mechanical modeling of ceramics based on microstructure. Applied Sciences. 2015;5(4):1337-1349. DOI: 10.3390/app5041337
13.Wang Y, Sarin VK, Lin B, et al. Feasibility study of the ultrasonic vibration filing of carbon fiber reinforced silicon carbide composites. International Journal of Machine Tools and Manufacture. 2016;101:10-17. DOI: 10.1016/j.ijmachtools.2015.11.003
14.Huang H, Liu YC. Experimental investigations of machining characteristics and removal mechanisms of advanced ceramics in high speed deep grinding. International Journal of Machine Tools & Manufacture. 2003;43:811-823. DOI: 10.1016/S0890-6955(03)00050-6
15.Zhang Y, Li C, Ji H, et al. Analysis of grinding mechanics and improved predictive force model based on material-removal and plastic-stacking mechanisms. International Journal of Machine Tools and Manufacture. 2017;122:81-97. DOI: 10.1016/j.ijmachtools.2017.06.002
16.Patnaik Durgumahanti US, Singh V, Venkateswara RP. A new model for grinding force prediction and analysis. International Journal of Machine Tools and Manufacture. 2010;50(3):231-240. DOI: 10.1016/j.ijmachtools.2009.12.004
17.Li Z, Zhang F, Luo X, et al. A new grinding force model for micro grinding RB-SiC ceramic with grinding wheel topography as an input. Micromachines. 2018;9(8):368. DOI: 10.3390/mi9080368
18.Yuan S, Fan H, Amin M, et al. A cutting force prediction dynamic model for side milling of ceramic matrix composites C/SiC based on rotary ultrasonic machining. The International Journal of Advanced Manufacturing Technology. 2016;86(1–4):37-48. DOI: 10.1007/s00170-015-8099-6
19.Wang Y, Lin B, Zhang X. Research on the system matching model in ultrasonic vibration-assisted grinding. The International Journal of Advanced Manufacturing Technology. 2014;70(1):449-458. DOI: 10.1007/s00170-013-5269-2
20.Ding K, Fu Y, Su H, et al. Study on surface/subsurface breakage in ultrasonic assisted grinding of C/SiC composites. International Journal of Advanced Manufacturing Technology. 2017;91(9–12):3095-3105. DOI: 10.1007/s00170-017-0012-z
21.Zhang J, Lin B, Fei J, et al. Modeling and experimental validation for surface error caused by axial cutting force in end-milling process. International Journal of Advanced Manufacturing Technology. 2018;99(1–4):327-335. DOI: 10.1007/s00170-018-2468-x
22.Ojo SO, Ismail SO, Paggi M, et al. A new analytical critical thrust force model for delamination analysis of laminated composites during drilling operation. Composites Part B: Engineering. 2017;124:207-217. DOI: 10.1016/j.compositesb.2017.05.039
23.Cao X, Lin B, Zhang X. Investigations on grinding process of woven ceramic matrix composite based on reinforced fiber orientations. Composites Part B Engineering. 2015;71(mar.):184-192. DOI: org/10.1016/j.compositesb.2014.11.029
24.Cao X, Lin B, Wang Y, et al. Influence of diamond wheel grinding process on surface micro-topography and properties of SiO2/SiO2 composite. Applied Surface Science. 2014;292:181-189. DOI: 10.1016/j.apsusc.2013.11.109
25.Wei J, Wang H, Lin B, et al. A force model in single grain grinding of long fiber reinforced woven composite. The International Journal of Advanced Manufacturing Technology. 2019;100(1–4):541-552. DOI: 10.1007/s00170-018-2719-x
26.Wei J, Wang H, Lin B, et al. Acoustic emission signal of fiber-reinforced composite grinding: Frequency components and damage pattern recognition. International Journal of Advanced Manufacturing Technology. 2019;103(1–4):1391-1401. DOI: 10.1007/s00170-019-03645-x
27.Liu C, Ding W, Yu T, et al. Materials removal mechanism in high-speed grinding of particulate reinforced titanium matrix composites. Precision Engineering. 2018;51:68-77. DOI: 10.1016/j.precisioneng.2017.07.012
28.Wei J, Wang H, Lin B, et al. Measurement and evaluation of fiber bundle surface of long fiber reinforced woven composites. Surface Topography-Metrology and Properties. 2019;7(1). DOI: 10.1088/2051-672X/aaf6fd
29.Wei J, Wang H, Lin B. Measurement of cell body and the whole surfaces of long Fiber reinforced woven composites. IOP Conference Series Materials Science and Engineering. 2019;678:012029. DOI: 10.1088/1757-899X/678/1/012029
30.Wei J, Lin B, Cao X, et al. Two-dimensional evaluation of 3D needled Cf/SiC composite fiber bundle surface. Applied Surface Science. 2015;355:166-170. DOI: 10.1016/j.apsusc.2015.06.182
Written By
Bin Lin, Jingguo Zhou, Jinhua Wei, Haoji Wang and Tianyi Sui
Submitted: 13 April 2023Reviewed: 04 May 2023Published: 26 May 2023
 Open access peer-reviewed chapter