Open Access is an initiative that aims to make scientific research freely available to all. To date our community has made over 100 million downloads. It’s based on principles of collaboration, unobstructed discovery, and, most importantly, scientific progression. As PhD students, we found it difficult to access the research we needed, so we decided to create a new Open Access publisher that levels the playing field for scientists across the world. How? By making research easy to access, and puts the academic needs of the researchers before the business interests of publishers.
We are a community of more than 103,000 authors and editors from 3,291 institutions spanning 160 countries, including Nobel Prize winners and some of the world’s most-cited researchers. Publishing on IntechOpen allows authors to earn citations and find new collaborators, meaning more people see your work not only from your own field of study, but from other related fields too.
To purchase hard copies of this book, please contact the representative in India:
CBS Publishers & Distributors Pvt. Ltd.
www.cbspd.com
|
customercare@cbspd.com
The radiopharmaceutical supply chain involves rigorous quality control tests to assure products are safe and effective to use in the clinic. However, one of the key challenges for analytical methods in radiopharmacy is the narrow time frame where the analysis must be completed due to the limited half-life of radiomolecules. Radiochemical purity and identity are critical tests to control the success of radiolabeling. These parameters are easily determined by thin-layer chromatography methods (TLC) in some widely used molecules such as [18F]FDG. However, for new diagnostic and therapeutic agents with more complex radiolabeling steps, it is critical to have better separations to identify impurity peaks only detectable using higher sensitive methods. This chapter will present the keys to designing and improving high-performance liquid chromatography (HPLC) methods for radiopharmaceutical analysis, with practical examples of method optimization. It will also be reviewed how to determine the main parameters necessary for the validation of an analytical method, and finally, some approaches to the use of liquid chromatography coupled with mass detectors in tandem (LC-MS/MS) during the development of radiopharmaceuticals will be presented.
Centro de Investigaciones Nucleares para Aplicaciones en Salud y Biomedicina (CINASB), División de Investigación y Aplicaciones Nucleares, Comisión Chilena de Energía Nuclear, Santiago, Chile
Silvia Lagos
Centro de Investigaciones Nucleares para Aplicaciones en Salud y Biomedicina (CINASB), División de Investigación y Aplicaciones Nucleares, Comisión Chilena de Energía Nuclear, Santiago, Chile
Ethel Velásquez
Centro de Investigaciones Nucleares para Aplicaciones en Salud y Biomedicina (CINASB), División de Investigación y Aplicaciones Nucleares, Comisión Chilena de Energía Nuclear, Santiago, Chile
*Address all correspondence to: roberto.mercado@cchen.cl
1. Introduction
Radiopharmaceuticals are medicinal products that contain radionuclides and are used for diagnostic and therapeutic purposes. In view of such products being intended for use in humans and the fact that they are generally administered intravenously to the patient, it is essential to ensure product quality from the beginning of the manufacturing phase within the supply chain. Therefore, quality control tests that include sampling, physicochemical and microbiological tests of raw materials and finished products are an essential part of quality assurance. Modern and specific regulations for radiopharmaceuticals mention that laboratory analytical methods must be suitable for their intended use, meaning they must be sensitive, specific, precise, and reproducible [1, 2].
Quality control analysis for radiopharmaceuticals include some simple methods, such as a visual inspection to ensure that their appearance is a clean, transparent solution without particulate matter. It is also necessary to measure the pH of injectable solutions, which can be done easily with a pH meter or a pH paper strip, through the use of a minimal aliquot to perform the measurement. Other analyses aim to identify the unique presence of the desired radioisotope by calculating its half-life and radionuclidic purity using gamma spectroscopy. However, the determination of radiochemical purity (RCP), chemical purity (CP), and the identity of a radiopharmaceutical are of particular interest to evaluate the quality of radiolabeling.
1.1 Radiochemical purity
Radiochemical purity of the radiopharmaceutical preparation can be defined as the proportion of the radionuclide activity present in the indicated chemical form (ARPh). As shown in eq. 1, radiochemical purity is expressed as a percentage relative to the total radioactive species in the sample (AT)
%RCP=ARPhATotal∗100E1
Since the radiochemical form of the radiopharmaceutical determines its biochemical behavior, it is necessary to control radiochemical impurities that may alter the desired biodistribution and modify specific uptake, subsequently affecting the diagnostic image or treatment being administered. Radiochemical impurities can originate from changes that occur during storage and deviations that occur during the production process of the radioisotope or radiopharmaceutical. The generation of radiochemical impurities can also derive from the radiolysis process of the radiolabeled molecule, originating fragments that contain the radiation-emitting isotope. In order to be detected, a process of separation of the radiochemical impurities is required; chromatographic separation and analysis methods are most suitable for determining radiochemical purity [3].
1.2 Chemical purity
The determination of chemical purity aims to detect and quantify those chemical impurities that may affect the quality of radiolabeling or generate adverse reactions in patients. These impurities are nonradioactive compounds that can be generated during radiolabeling as synthesis by-products, residues from a precursor, or auxiliary raw materials used in some steps of the production process, such as residual solvents. They can also be intentionally added substances such as stabilizers to delay radiolysis or other types of additives. In some cases, the presence of these impurities is unavoidable, so they must be controlled to a maximum value present in the preparation, which is usually declared in the product monographs. Due to the different nature of these impurities, it is necessary to evaluate the use of various techniques depending on the type of analyte. For example, residual solvents used during the synthesis process such as acetonitrile, dimethyl sulfoxide, or ethanol are detected by gas chromatography. Others, such as Kryptofix 2.2.2 or tetrabutylammonium carbonate, are detected by a spot test revealed with resublimated iodine. However, impurities related to reaction by-products or remnants of precursors usually have a similar structure and polarities to the radiopharmaceutical, then requiring methods with greater separation capacity such as high-performance liquid chromatography [3].
1.3 Identity
The identity of the radiopharmaceutical refers to the verification of the presence of the radiopharmaceutical within the mixture. This verification is performed by analyzing a nonradioactive standard (cold standard) solved in a similar matrix to the radiopharmaceutical sample. In this way, the coincidence of the retention time (tr) or retention factor (Rf) between the cold standard and the radiopharmaceutical unequivocally identifies the presence of the compound of interest.
During the radiopharmacy practice, the most commonly used techniques for determining identity, radiochemical purity, and chemical purity are thin-layer chromatography (TLC) and high-performance liquid chromatography (HPLC).
2.1 Thin-layer chromatography
This technique is a form of solid-liquid chromatography where the stationary phase is usually a polar absorbent thin-layer and a liquid mobile phase that can be a solvent or a mixture of them. Analysis of radiopharmaceuticals by thin-layer chromatography is performed by depositing a few microliters of the analyte onto a plate containing finely ground silica (e.g. TLC Silica Gel 60 plates), Whatman cellulose chromatography paper (e.g. Whatman 1 CHR) or glass microfiber chromatography paper (e.g. iTLC-SG), which is then placed on a plate or impregnated on fiberglass. This plate with the sample is placed in a chamber containing the mobile phase. The solvent, which is at the bottom of the chamber, moves up the adsorbent layer by capillary action and passes over the point where the sample was seeded; as it continues upward, the solvent moves the compounds in the mixture up the plate at different rates. The result is the separation of compounds due to differences in their affinity with the stationary phase and differences in solvent solubility [4].
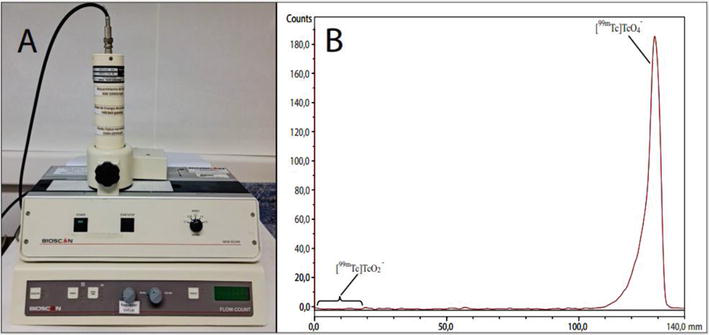
Once the solvent has run to the front mark, the plate is removed and visualized using ultraviolet light, iodine, or sulfuric acid solution. In contrast, for radiopharmaceutical products a dedicated instrument radio-TLC scanner is required, such as the Eckert & Ziegler/Bioscan model Mini-Scan radio-TLC scanner, which is shown in Figure 1, Panel A. This type of equipment is commonly used in routine quality control of radiopharmaceuticals such as [18F]FDG and [99mTc]NaTcO4 [5, 6]. It has a detector containing a counting gas (9:1 Argon:Methane) and an electrode; when the chromatographic run is finished, the TLC plate is placed in the equipment, and then the detector moves over the surface at an appropriate speed to optimize the count. The control software records the count as the detector moves to obtain the radiochromatogram [5]. Other manufacturers of these instruments are Elysia-Raytest, Capintec, Scannix and Lablogic. Figure 1, Panel B shows a radio-TLC chromatogram of [99mTc]NaTcO4 sample. A retention factor (Rf) ranging from 0.7 to 1 identifies the pertechnetate [99mTcO4] – species, while an Rf between 0 and 0.1 identifies reduced/hydrolyzed species [99mTcO2]−.
Figure 1.
(Panel A) Eckert & Ziegler/bioscan radio-TLC scanner, mini-scan model. (Panel B) radio-TLC chromatogram of [99mTc]NaTcO4 sample.
Using this simple technique, it is also possible to perform identity and radiochemical purity assays on radiocompounds. This is carried out by performing a test in parallel with the radiopharmaceutical analysis; to this aim, a drop of cold standard of the radiopharmaceutical is tested, being eluted with a selected mobile phase according to the polarity of the analyte and compatible with the stationary phase present on the TLC plate. This cold standard can be visualized by ultraviolet light (UV) or revealed by resublimated iodine, while the plate bearing the radiopharmaceutical sample is read on a radio-TLC scanner. The radiochemical purity is quantified by the percentage of peak area related to the total sample, while the radiochemical identity is confirmed by comparing the retention factor (Rf) of the radiochemical peak with that of the unmarked standard. To determine the identity and radiochemical purity of these compounds, it is necessary that the implemented method ensures that there is no co-elution of the analytes and provides different retention factors for each of them. One way to achieve this purpose is to use different mobile phase systems with suitable polarity for each analyte to be separated. It is for this reason that several mobile phases with the same stationary phase present in the chromatographic support are frequently used to perform a single analysis of radiochemical purity, chemical purity, or identity by TLC.
It is also possible to perform radiochemical purity analysis using TLC by manually cutting the chromatographic strip into several equal parts and then measuring them individually using a dose calibrator or an automated gamma counter. This alternative is especially useful when the laboratory does not have a radio-TLC scanner. However, this method of measurement is not the most suitable due to several disadvantages, mainly:
High variability in the radiochemical purity assessment, which is related to how uniformly the pieces have been cut.
If the cut segments are too large, there is a risk of overlooking some chromatographic peaks.
Due to the geometry of the detector, the measurement can be affected by the position of the strip section relative to the detector.
The high manipulation required by the analyst to perform the measurement in this way can introduce errors in the result.
Cutting and measuring the chromatographic strips carries the risk of cross-contamination between samples.
The time it takes to individually measure each piece of the chromatographic strip makes it very slow compared to using a radio-TLC scanner.
2.2 High-performance liquid chromatography
HPLC is an evolution of TLC, which offers better separation capacity by injecting a radiopharmaceutical sample into a packed liquid chromatography column, where its components are separated based on their polarity while being eluted by a suitable mobile phase. Due to the chemical and physical composition of the chromatographic column and the composition of the mobile phase used, this system can achieve better separations than thin-layer chromatography, even when the sample contains substances with similar polarities.
This instrument has a pump that propels the mobile phase at a sufficient pressure to travel through the packed column, eluting the sample through it. Once the sample has been separated, it can be detected by different types of detectors depending on the type of analyte to be analyzed. In the case of radiopharmaceuticals, a UV detector senses the chromophores of the sample, and a radiometric detector determines the gamma radiation emitted by the radioisotope linked to the radiopharmaceutical are commonly used. Similarly to TLC, it is possible to identify the radiopharmaceutical using a cold standard [3], this time by the coincidence of the retention time. In addition, having a quantitative detector like the UV, it is possible to identify and quantify the radiopharmaceutical and its impurities, which gives it a significant advantage over less quantitative methods such as TLC. Other detectors with more limited use in radiopharmacy are the refractive index detector, due to its lower sensitivity compared to UV detectors, and the pulsed amperometric detector, as the radiomolecules to be measured must be electroactive [7].
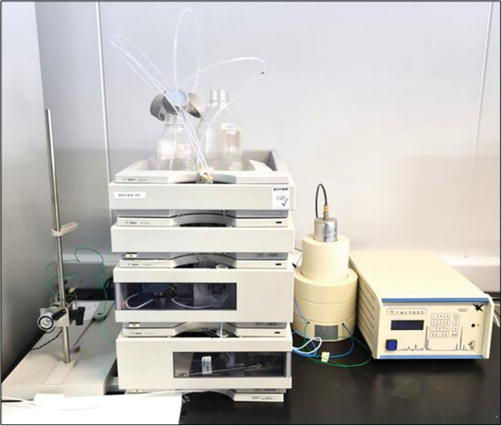
Figure 2 shows an Agilent 1190 radiochromatograph, which has a quaternary pump that allows manipulation of up to four solvents to form the mobile phase, and diode array detector (DAD) that measures the absorbance of the sample throughout the UV-Visible spectrum while performing the chromatographic run, providing an advantage in the development of quantitative analysis methods. Finally, this equipment has a NaI crystal Raytest radiation detector connected in series that allows radiometric measurements when the analyte has radioactive properties.
Figure 2.
Radio-HPLC system with diode array detector and radiometric detector. Some manufacturers of these instruments are Agilent, Dionex, Shimadzu, waters, among others.
2.3 TLC versus HPLC in radiopharmacy
Several factors should be evaluated to select between TLC and HPLC such as the analytes to be analyzed, equipment and resource availability, sensitivity and precision requirements, or research objectives to get the proper quality control method as part of the supply chain or in an R&D radiopharmaceutical environment. It is important to consider that the choice between TLC and HPLC may vary depending on the specific requirements of the radiopharmaceutical and the available capabilities. Table 1 summarizes some advantages and disadvantages of TLC and HPLC.
Attribute
TLC
HPLC
Simplicity and speed of analysis
Quick and simple analysis
Requires more preparation and analysis is usually slower
Cost
Economic analysis. The cost of TLC plates is affordable. Lower solvent consumption
Chromatographic columns are more expensive than TLC plates. Higher consumption of solvents.
Method validation
Method validation with TLC is generally easier.
More complex validation
Analyte limitations
Few limitations regarding the nature of the analyte.
Colloidal species and aggregates are not detected as they are retained at the top of the column.
Separation capacity
Low separation capacity
High separation capacity for analytes with similar polarities. Suitable for analysis of impurities generated by radiolysis.
3. Recommendations for the development of measurement methods in HPLC liquid chromatography for radiopharmaceuticals
Many times, setting an analysis method for a novel radiopharmaceutical or a radiopharmaceutical already on the market seems to be a very extensive job, especially when it comes to the development of an HPLC method or any other instrumental technique. The development of HPLC methods not only involves determining the instrumental parameters that will be used but also involves creating a complete procedure that will guide the analyst through the assay. Therefore, it is very important to identify the purpose of the analytical method to be developed, which in this case is multiple, since as previously mentioned, using liquid chromatography, it is possible to verify the identity of the radiopharmaceutical and also determine its chemical and radiochemical purity.
3.1 Initial steps
To initiate the HPLC method development process, it is very important to collect background information and data about the analyte to be measured, which include conducting a review of the literature to obtain some initial conditions for an analysis to be optimized, or estimate its polarity and other attributes as chromophore groups that help select an analytical separation column and mobile phase. During this stage, it is also advisable to fully understand the radiolabeling reaction and to have a chemical criterion when proposing the identity of unknown impurities that may be found during the analysis. At the same time, in the case of PET radiopharmaceuticals, it is important to test a sample of the synthesis precursor with the developed method. This way it is possible to identify chemical and radiochemical impurities based on the retention time (tr) and thus classify these compounds as a known impurity.
3.2 Column selection
To obtain successful chromatography, an adequate balance is required between the intermolecular forces existing between the three active participants in the separation process: the solute, the mobile phase, and the stationary phase. These intermolecular forces are qualitatively described in terms of the relative polarity of each of the three reactants. In general, the polarity in increasing order for various functional groups present in the analyte is: hydrocarbons < ethers < esters < ketones < aldehydes < amides < amines < alcohols. Water is more polar than any compound containing some of the above functional groups [8].
Since radiopharmaceuticals are usually radiolabeled variants of other better-known molecules such as hormones, sugars, nucleosides, or peptides, it is recommended to conduct a literature search for analysis methods for the original molecule in order to select a column. A special consideration should be given related to the behavior of the radiopharmaceutical which can be slightly different due to the modifications in its structure. For example, in the case of fluorinated radiopharmaceuticals, the strong electronegativity of fluorine makes these compounds slightly more lipophilic, increasing their retention time compared to their nonfluorinated analog, while the behavior in radiopharmaceuticals labeled with metals such as technetium-99 m also tends to increase due to the necessary use of bifunctional chelating agents for their radiolabeling, which can change the lipophilicity of the molecule.
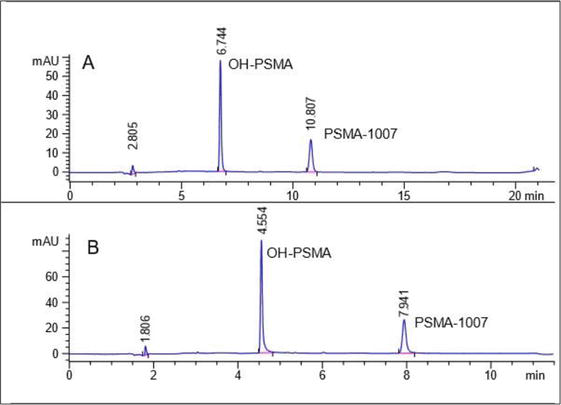
In addition to the composition of the stationary phase, another parameter to consider is the column dimension and physical characteristics of its packed particles, which can affect chromatographic separation. A 250 mm column will have good separation capacity, but it will increase analysis time. Therefore, it is recommended to choose shorter columns that also decrease the size of the packing particles. For example, a column with the same C18 phase and chromatographic conditions of 250 mm and a particle size of 5 μm will have separation efficiency similar to a C18 column of 150 mm and 2.6 μm. However, since the analyte has to travel a shorter distance, the analysis will be faster, which is particularly important in short-lived radiopharmaceuticals such as those labeled with fluorine-18 or carbon-11. Figure 3 shows the injection of a standard solution of OH-PSMA and cold-standard of [18F]PSMA-1007 at a concentration of 10 μg/mL in a 250 mm C18 column with a particle size of 5 μm (Panel A) and the same sample in a 150 mm C18 column with a particle size of 2.6 μm (Panel B). It is possible to observe how the change in dimensions alone reduces the retention time of both analytes and the total time of the chromatographic run.
Figure 3.
Comparison of two columns with the same C18 stationary phase. Panel a has dimensions of 250 x 4.6 mm x 5 μm, and panel B has dimensions of 150 x 4.6 mm x 2.6 μm.
It is possible to observe the use of this strategy in the recent monograph of the European Pharmacopeia for [18F]PSMA-1007 [9], in which the method described by Cardinale et al. [10] for determining the chemical purity of this radiopharmaceutical was optimized. The cost of this improvement will be the increase in instrument pressure, so it is suggested to monitor that the pressure does not exceed 80% of the maximum pressure supported by the system in order to not decrease its useful life.
In addition to the packed columns previously described, there are other kinds of columns called monolithic columns. Monolith technology can be imagined as a single porous “particle” filling the entire volume of the column without any of the inter-particle spaces typical of packed columns. This forces the mobile phase to circulate completely through the stationary phase. Silica monolithic columns are characterized by higher porosities than packed particle columns, with greater column efficiency, higher permeability, and, consequently, they allow for working with a higher flow of mobile phase. However, not everything is advantageous, as higher porosity implies a lower amount of silica in the column, which will lead to less stationary phase after the corresponding chemical modification (which provides functionality to the column). This will result in lower retention for analytes [11].
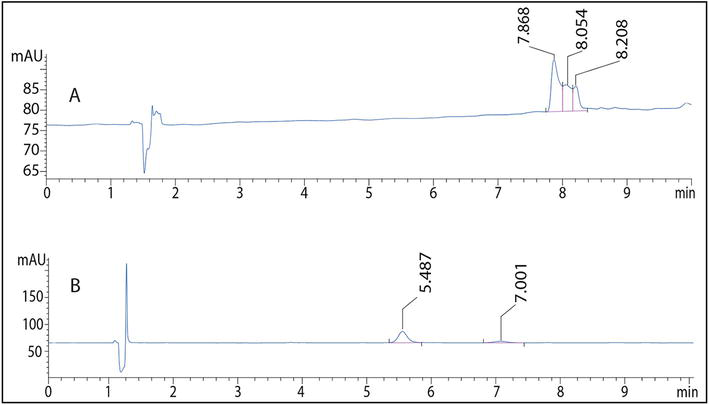
In the case of radiopharmaceuticals, monolithic columns can be useful when packed columns easily saturate and present a tailing effect. If saturation occurs, there is also a risk of radioactive material accumulation within the column, increasing exposure to the analyst who handles the instrument, which can be avoided with the use of a monolithic column. In Figure 4, Panel A shows the chromatogram of a sample of a peptide HYNIC-iPSMA using a C18 column of 150 x 4.6 mm, with a particle size of 2.7 μm and a pore size of 165 Å. Saturation of the column or two overlapping chromatographic peaks can be observed. Chromatogram in Panel B shows the same sample, with the same chromatographic conditions, but using a C18 monolithic column of 100 x 4.6 mm, with a mesopore size of 13 nm and macropores of 2 μm. At least two chromatographic peaks can be observed that were previously overlapped with the previous column.
Figure 4.
Chromatographic analysis of the precursor peptide HYNIC-iPSMA.
3.3 Selection of mobile phase
As mentioned in the previous section, it is recommended to perform a literature search for analysis methods of the original molecule, in order to have guidance on the mobile phase to be used. In many reverse-phase separations, a solvent mixture of water and a polar organic solvent such as acetonitrile, methanol or ethanol is employed. The retention time of the analyte can be manipulated by varying the water concentration. For example, in a C8 stationary phase column with a mobile phase composed of acetonitrile and water, the retention of steroids increases with increasing water proportion, improving the analysis resolution [8].
In analyses using ultraviolet absorption as a detection method, it is important to consider that each solvent has its own specific absorbance cut-off wavelength. Below this wavelength, the solvent itself absorbs the light. When choosing a solvent, its limit and where the desired analytes will absorb should be considered. If the analyte wavelengths are close, a different solvent should be chosen. The following list shows the UV cut-off wavelengths of some of the most used liquid chromatography solvents (Table 2).
Solvent
λ (Cut-off) [nm]
Acetonitrile
190
Water
191
Heptane
197
Ciclohexane
210
Ethanol
210
Methanol
210
Hexane
210
2-propanol
210
Tetrahydrofuran
220
Chloroform
245
Ethyl acetate
255
Dimethylsulfoxide
264
Toluene
286
Acetic acid
260
Acetone
330
Table 2.
Cut-off of the most used solvents in liquid chromatography.
3.4 Selection of detection wavelength
Most radiopharmaceuticals analyzed by RP-HPLC contain chromophore groups that are detected with UV-Visible detectors. Therefore, it is convenient to identify the wavelength of maximum absorption of the analyte to maximize the sensitivity of the method under construction. For this purpose, the best option is to have a diode array detector (DAD) that allows analyzing the absorbance spectrum of each chromatographic peak separated by the analysis column.
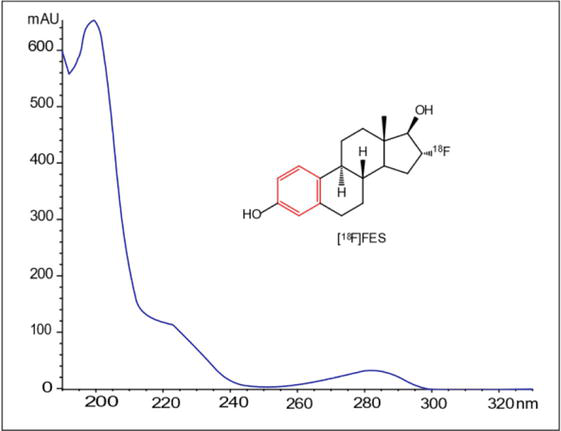
In radiopharmaceuticals such as [18F]FES, (recently approved by FDA like Cerianna), where the limited amount administered is only 5 μg per patient injection, it is important to have a method with high sensitivity [12, 13]. Figure 5 shows the absorbance spectrum of a sample of the radiopharmaceutical [18F]FES obtained with a diode array detector. In the represented structure, the main chromophore can be observed in red as the aromatic ring in conjugation. Although the absorption region between 260 and 290 nm may be more selective and some authors use it for quantification [14, 15, 16, 17], it is possible to increase the sensitivity of the method by using the band from 225 to 235 nm, taking care not to approach the cut-off zone of the solvents used in the mobile phase.
Figure 5.
[18F]FES absorption spectrum obtained by liquid chromatography using a diode array detector.
3.5 Consider the effect of the matrix
During the development of the chromatographic method, it is important to know the matrix of the finished product, as it could act as an interferent during the HPLC analysis, either by a change in the sample pH shifting retention times, or a difference in pH between the mobile phase and the sample containing buffer salts, which could cause the crystallization of these salts inside the HPLC system, obstructing the equipment and generating complications during the analysis. In the synthesis of PET radiopharmaceuticals, sodium ascorbate or citrate buffer solutions are commonly used to regulate the final solution pH to around 7. Therefore, the presence of these salts should be considered during the chromatographic method development.
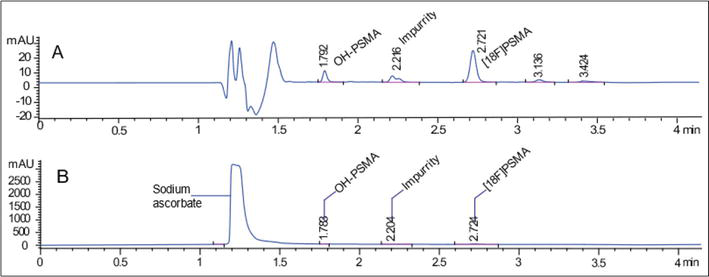
For example, the effect of the matrix can be observed in the last step of the synthesis of [18F]PSMA-1007, where 400 mg of sodium ascorbate is added with the purpose of reducing the radiation-induced degradation that becomes noticeable in activities produced above 20 GBq [10]. Figure 6, Panel A shows the chromatogram of an injection of freshly synthesized [18F]PSMA-1007 without the presence of ascorbic acid, where it is easy to visualize [18F]PSMA-1007 and its impurities. Meanwhile, the chromatogram of Figure 6, Panel B shows a sample of a new synthesis with sodium ascorbate at a concentration of 20 mg/mL, where a large peak of sodium ascorbate can be appreciated, which masks the analytes that need to be quantified.
Figure 6.
Matrix effect of sodium ascorbate in a [18F]PSMA-1007 synthesis sample.
4. Aspects to consider in the validation of methods for radiopharmaceuticals in HPLC
The validation of an analytical method aims to establish by means of scientific studies that a method is suitable for its intended use. In validation, some analytical properties or characteristics of the method that account for its reliability to be applied are determined. One of the most used guidelines for validation is produced by the International Conference of Harmonization of Technical Requirements for Registration of Pharmaceuticals for Human Use and Validation of Analytical Procedures, Text, and Methodology [18] and considers the study of the following analytical properties for method validation. Additionally, the European Association of Nuclear Medicine provides a validation guide focused on the validation of radioanalytical methods used in the quality control of radiopharmaceuticals [2].
4.1 Determination of the linearity or determination range
This corresponds to the most reliable concentration range for measuring the analyte. This range is between the concentration corresponding to the method’s limit of quantification and the maximum concentration delivered by the limit of linearity. In the case of radiopharmaceuticals, the specifications are usually provided as a maximum injectable mass for a patient in a maximum injection volume (Vmax), which will result in a maximum allowable concentration (Cmax). This Vmax volume is defined by the radiopharmaceutical producer and may depend on its presentation (single-dose syringes or multi-dose vials). When a calibration curve is constructed, Cmax should be at the center of the calibration curve, since, in the linear regression model, the least uncertainty is found at the center of the calibration curve.
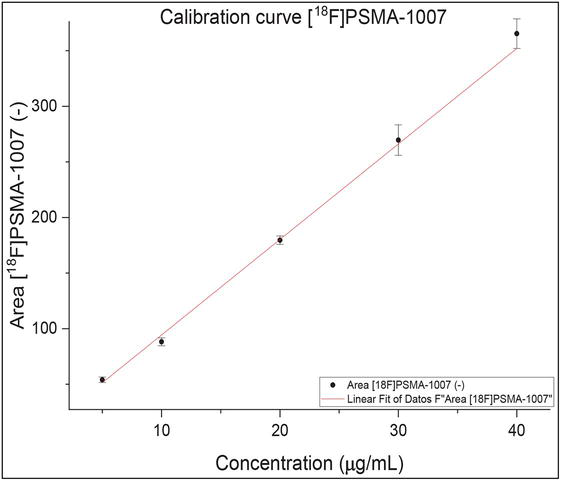
To illustrate, the radiopharmaceutical [18F]PSMA-1007 has a maximum injectable limit of 100 μg per patient injection. In this case, it has been defined that Vmax will be 5 mL, resulting in a Cmax of 20 μg/mL. Therefore, a calibration curve was constructed that includes points 5, 10, 20, 30, and 40 μg/mL, where six replicates were injected to build the calibration curve, as shown in Figure 7.
Figure 7.
Calibration curve for [18F]PSMA-1007.
Visually, the data fit the linear model, and its Pearson’s R coefficient value is 0.9980. However, none of these criteria is conclusive to ensure the linearity of the method. To ensure that the data fits the linear model, it is suggested to perform a Lack of Fit test in some statistical software [19]. Since it is a hypothesis test, for the example in Figure 7, the p-value obtained for this data was 0.5135; given that this p-value>0.05, then there is no evidence against the null hypothesis, and it can be concluded that the linear model is appropriate for modeling the calibration data for [18F]PSMA-1007.
4.2 Selectivity
Specificity or selectivity is the ability of an analytical method to measure an analyte accurately and specifically without interference from impurities, degradation products, additives, or coproducts. A chromatographic method is specific if it can separate the component of interest from other components in the formulation [3]. Using the example of the chromatographic analysis of [18F]PSMA-1007 in Figure 6, Panel A, it is possible to verify the separation of each of the sample’s components.
The separation of the individual components of the sample demonstrates the method’s selectivity. To do so, it is necessary to inject each component of the sample beforehand to determine its retention time and, therefore, its elution order. During the development of an analytical method and once the elution order has been established, it is important not to make significant changes to the chromatographic method that involve drastic polarity changes (such as changing the solvent of the mobile phase or column), as this can change the elution order of the sample’s components.
4.3 Precision
Precision is the degree of agreement among a group of results and is represented as the dispersion of these results around their mean. Precision is usually expressed as variance, standard deviation, or coefficient of variation (CV) of a series of measurements. In the case of detecting impurities with a standard solution, such as OH-PSMA in the synthesis of [18F]PSMA-1007, multiple analyses of OH-PSMA at different concentrations within the previously determined linear range are necessary. A CV value less than 10% demonstrates the precision of the method [3].
4.4 Accuracy
Accuracy expresses the closeness between the accepted value as the reference value (certified reference material) and the found value (average value) obtained by applying the analysis procedure a certain number of times. Accuracy is usually expressed in terms of relative error.
To properly determine the accuracy of a measurement in a chemical purity analysis by HPLC in radiopharmaceuticals, it is essential to have certified reference material for impurities and a cold standard of the radiopharmaceutical. Usually, in the chemical purity analysis of PET radiopharmaceuticals, the criterion is used that impurities have the same molar extinction coefficient as the radiopharmaceutical. This criterion is an approximation based on the assumption that the precursor used has a high degree of purity, that the synthesis coproducts are structurally similar, and that the chromophoric groups have not degraded. Despite the widespread use of this practice, from a strictly analytical point of view, it is an error because it does not use a certified reference material for each impurity. Finally, in multistep syntheses where more than one synthesis precursor is used, it is more complex to make this approximation, as it is more likely that one of the precursors does not have the same molar extinction coefficient as the main analyte.
4.5 Robustness
It is the ability of a method to not be affected by small, intentionally made changes in method parameters. An HPLC method is considered robust when the results are not affected by small variations in mobile phase pH, mobile phase composition, flow rate, or changes in supplier or batch of the separation columns used [3].
4.6 Recovery
Sometimes, certain precursor radioisotopes of the radiopharmaceutical (e.g., [18F]Fluoride or [99mTc]NaTcO4) can become retained in the HPLC injection system, tubing, precolumn, or column [2]. To evaluate the recovery, the two simplest methods to perform are:
Compare the injected activity with the eluted activity by collecting eluted fractions and measuring them with a dose calibrator.
Remove the column and precolumn and perform a second chromatographic run, comparing the peak areas of the two chromatograms while correcting for decay. However, this method does not take into account the activity that may be retained by the tubing or the injector.
4.7 Calculation of detection and quantification limits
There are different ways to calculate the detection limit (LOD), defined as the lowest amount of analyte detectable, and the quantification limit (LOQ), defined as the lowest amount of analyte quantifiable. One of the ways to calculate the LOD and LOQ of a method according to statistical criteria is based on the ratio between the magnitude of the measurement signal and the background noise produced by the instrument or the analytical blank. For example, the detection limit defined by IUPAC is the concentration of analyte that produces a signal that can be statistically differentiated from an analytical blank and is calculated by measuring the response of at least ten independent analytical blanks from which the mean (Yb) and standard deviation (σb) are determined. According to IUPAC, the detection limit is:
YLD=Yb+3σbE2
A concentration CLD corresponds to a signal YLD, which is achieved by graphic extrapolation on the calibration curve.
Despite the simplicity of calculating the limit of detection using the IUPAC methodology, its application in liquid chromatography is challenging, as determining the blank area value requires selecting a region of the chromatogram corresponding to the analyte’s retention time (radiopharmaceutical) that corresponds to the baseline without any apparent signal. Therefore, a practical way to calculate the limit of detection and quantification is to prepare a calibration curve with concentrations below the last point on the calibration curve with at least three points and six replicates at each level [20]. Then, to calculate the LOD and LOQ using Eqs. (3) and (4), respectively, where Sa is the standard deviation of the intercept at low concentrations, a is the intercept of the low concentration curve, b is the slope of the calibration curve at high concentrations, and n is the number of replicates.
5. The frontier: Use of liquid chromatography coupled to mass detectors in radiopharmaceuticals
Liquid chromatography coupled to mass detectors (LC-MS) is an analytical technique that involves the chromatographic separation of analytes, followed by their detection based on mass spectrometry. Although its use is relatively new, its sensitivity, selectivity, and precision have made it a technique of choice for detecting quantities of micrograms or even nanograms in a sample. This high sensitivity can be interesting in the analysis of radiopharmaceuticals due to the low quantities of radioactive molecules present in the formulations.
Unlike HPLC with UV detectors, as mentioned above, in LC-MS, the mobile phase carrying the separated analytes is not allowed to reach the mass spectrometer. While a conventional HPLC system operates at ambient pressures, the mass spectrometer operates under vacuum, and both systems (HPLC and MS) are coupled through an interface. During an analysis, the mobile phase elutes through the column toward the interface, the solvent is evaporated with heat, and the analyte molecules are vaporized and ionized. This is a crucial step since the mass spectrometer is only capable of detecting and measuring the ions in the gas phase. Since the analyte ions are generated at atmospheric pressure in the interface, the process is called atmospheric pressure ionization (API), and the interface is known as an API ion source. Electrospray ionization (ESI), electron ionization (EI), and matrix-assisted laser desorption/ionization (MALDI) are the most used ionization sources in LC-MS analysis.
In such a detector, analyte ions are introduced into the mass spectrometer, where they are subjected to electric and/or magnetic fields. The flight paths of the ions are altered by varying the applied fields, ensuring their separation from one another based on their mass-to-charge values, m/Z. After separation, the ions can be collected and detected by a variety of mass detectors, where the most common analyzer is the quadrupole type. It is possible to couple two mass analyzers that function in series, which allows for the precise identification and quantification of different types of samples. These triple quadrupole QQQ or TQMS (Triple Quadrupole Mass Spectrometer) and quadrupole time-of-flight QTOF mass spectrometers are the most commonly used tandem mass detectors. The combination of liquid chromatography (LC) with tandem mass detectors (MS/MS) gives rise to LC-MS/MS.
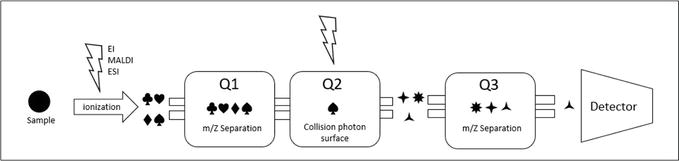
Figure 8 shows a working scheme of a triple quadrupole detector, where the sample gets to an ionization source after being separated in the HPLC system. For samples with medium to high polarity and high molecular weights, an ESI source is commonly used. Once the sample is ionized, it is separated in the first quadrupole (Q1), and one of the produced ions is selected and further fragmented in the second quadrupole (Q2), which is used as a collision cell to obtain new fragments. These are then selected in the third quadrupole (Q3) and finally detected at the end of the spectrometer.
Figure 8.
Operating diagram of a triple quadrupole mass spectrometer TQ or QqQ.
In the field of radiopharmacy, in radiolabeling processes that involve complex chemical synthesis, impurities are usually produced, some of which can be identified by the coincidence of the retention time with a reference standard for such impurities or they may be residues of the precursor. However, the identity of other impurities that normally occur in very low quantities can only be classified as a coproduct. Their quantification is approximated by assuming that they have the same molar extinction coefficient as the analyte of interest [10, 17], and their chemical structure can only be speculated through careful analysis of the reaction. LC-MS/MS is a technique that provides complementary information for the identification of these impurities since, together with the separation provided by the chromatographic column, tandem analyzers can provide the fragmentation patterns of the components of the sample, which help to elucidate the structure of these impurities and quantify them.
On the other hand, LC-MS/MS has been used to characterize and evaluate the specific activity of rapidly decaying radiopharmaceuticals such as those using carbon-11 [21]. Specific activity is the ratio between the amount of a compound (mol) in radioactive and nonradioactive form (isotopologues) at a specific time when the measurement is made. The precise determination of specific activity is critical in radiocompounds that will bind to low-density protein targets such as neurotransmitter receptors, enzymes, or in specific cases where the radiopharmaceutical is pharmacologically very potent, such as dopamine, nicotinic, or opioid receptor radiotracers [21, 22, 23, 24].
Usually, in routine practice, this measurement is made using HPLC systems with UV detectors coupled to a radiometric detector. However, the accuracy of these detectors is vulnerable to errors in instrumental settings. LC-MS/MS has been demonstrated to be an autonomous, rapid, and reliable tool for measuring specific activity in radiocompounds present in trace amounts by tracking the radiolabeled fragments while also identifying the position of radiolabeling in the prepared tracer.
Currently, in routine radiopharmaceutical practice, thin-layer chromatography (TLC) and the use of a radio-TLC scanner are the gold standard for evaluating the radiochemical purity in radiopharmaceuticals. This is due to the simplicity of the technique, low solvent consumption, and its robustness. With this technique and the use of a cold standard, it is also possible to determine the identity and chemical purity of a radiopharmaceutical using developers such as ultraviolet light, sublimated iodine, or sulfuric acid. However, the separation capacity of chromatographic plates and the sensitivity of the developers used are not always convenient for determining impurities present in radiopharmaceuticals. On the other hand, as the development of radiopharmaceuticals aims at molecules that interact with specific biological targets and the synthesis processes become more complex, generating coproducts with similar polarities to the radiopharmaceutical. Therefore, it is necessary to use a technique with better separation capacity, such as high-performance liquid chromatography (HPLC). With the appropriate choice of mobile phase, a separation column that considers the physicochemical properties of the analyte, and a detection wavelength that maximizes method sensitivity, it is possible to separate and quantify the target analyte from its impurities even though they have similar polarities. By adding the use of a cold standard, it is possible to determine the identity of a radiopharmaceutical, and due to the superior separation and detection capacity of HPLC, it is possible to visualize coproducts and other impurities that are present at low concentration levels.
From a quality assurance standpoint, it is necessary to verify that analytical methods that use TLC or HPLC for the determination of radiochemical purity, identity, and chemical purity have the conditions to generate accurate and reproducible results through validation of the method. The validation process includes the evaluation of linearity, selectivity, precision, accuracy, robustness, and calculation of the limit of detection and quantification. Validation should include detailed documentation of the analysis method and procedures used for sample preparation, as well as the training and qualification of personnel performing the analysis.
In the field of radiopharmaceutical research, it is possible to use chromatographs that are coupled to mass spectrometers that are used as detectors. An LC-MS/MS can be used for the identification and quantification of compounds based on their mass-to-charge ratio (m/Z). By identifying and quantifying charged analyte fragments produced in a tandem mass detector, it is possible to obtain structural information on impurities produced during a radiolabeling reaction. It should be noted that a triple quadrupole mass detector itself is not a suitable tool for determining the complete structure of a molecule; theoretical knowledge of the radiolabeling reaction is required beforehand to have a chemical criterion for proposing an analyte structure. In order to elucidate a structure, it is convenient to combine LC-MS/MS with other techniques such as nuclear magnetic resonance spectroscopy (NMR), infrared spectroscopy (IR), and molecular modeling provided by computational chemistry. On the other hand, in some specific cases, it is possible to use a triple quadrupole mass detector as a complementary tool to determine the radiochemical purity of a radiopharmaceutical. For example, if the mass of the radioactive fragment of interest is known and radioactive impurities with different masses are suspected, a triple quadrupole mass detector could help identify and quantify impurities in the sample.
1.Current good manufacturing practice for positron emission tomography drugs. Federal Register. Food and Drug Administration. 2009;74:65409
2.Gillings N, Todde S, Behe M, Decristoforo C, Elsinga P, Ferrari V, et al. EANM guideline on the validation of analytical methods for radiopharmaceuticals. EJNMMI Radiopharmacy and Chemistry. 2020;5(1):7. DOI: 10.1186/s41181-019-0086-z
3.Lodi F, Boschi F. Quality control of PET radiopharmaceuticals. In: Khalil M, editor. Basic Science of PET Imaging. 1st ed. Cham: Springer; 2016. pp. 105-126. DOI: 10.1007/978-3-319-40070-9_5
4.Skoog D, Holler J, Nieman T. Principios de Análisis Instrumental. 5th ed. Madrid: McGraw-Hill; 2001. p. 824
5.USP 40 NF 35. Farmacopea de Estados Unidos. Fludesoxiglucosa F 18, Rockville: Inyección; 2017. pp. 4673-4675
6.USP 38 NF 33. Farmacopea de los Estados Unidos. Pertecnetato de Sodio Tc 99m, Rockville: Inyección; 2015. pp. 5881-5882
7.Thompson S, Scott P. Equipment and instrumentation for radiopharmaceutical chemistry. In: Lewis J, Windhorst A, Zeglis B, editors. Radiopharmaceutical Chemistry. 1st ed. Switzerland: Springer; 2019. pp. 481-499. DOI: 10.1007/978-3-319-98947-1_27
8.Skoog D, Holler J, Nieman T. Principios de Analisis Instrumental. 5th ed. Madrid: McGraw-Hill; 2001. pp. 803-807
9.European Pharmacopoeia (Ph. Eur.) Supplement 10.5. European Directorate for Quality of Medicines & Healthcare. Strasbourg: PSMA-1007 (18F) Injection; 2021. pp. 5725-5727
10.Cardinale J, Martin R, Remde Y, Schäfer M, Hienzsch A, Hübner S, et al. Procedures for the GMP-compliant production and quality control of [18F]PSMA-1007: A next generation Radiofluorinated tracer for the detection of prostate cancer. Pharmaceuticals [Internet]. 2017;10(4):77. DOI: 10.3390/ph10040077
11.Nuñez O. Columnas monolíticas de base sílice: Propiedades, preparación, modificaciones químicas y aplicaciones en cromatografía de líquidos. Cromatografía y técnicas afines. 2008;29(2):59-77
12.CERIANNA (Fluoroestradiol F 18) Injection, for Intravenous Use Initial U.S. Approval: 2020 [Internet]. Available from: https://www.accessdata.fda.gov/drugsatfda_docs/label/2020/212155s000lbl.pdf [Accessed: April 28, 2023]
13.Updated Specifications for IND #79,005[F-18]FES [F-18]Fluoroestradiol [Internet]. Available from: https://imaging.cancer.gov/programs_resources/cancer-tracer-synthesis-resources/docs/FES_spec_sheet.pdf [Accessed: April 28, 2023]
14.Kumar P, Mercer J, Doerkson C, Tonkin K, McEwan J. Clinical production, stability studies and PET imaging with 16-α-[18F]fluoroestradiol ([18F]FES) in ER positive breast cancer patients. Journal of Pharmacy and Pharmaceutical Sciences. 2007;10(2):256-265
15.Bispo A, Nascimento LTC, Costa FM, Da Silva JB, Mamede M. Development of an HPLC method for the radiochemical purity evaluation of [18F]fluoroestradiol. Brazilian Journal of Radiation Sciences. 2019;7(2A):01-09. DOI: 10.15392/bjrs.v7i2A.746
16.Yilmaz B, Kadioglu Y. Determination of 17 β-estradiol in pharmaceutical preparation by UV spectrophotometry and high-performance liquid chromatography. Arabian Journal of Chemistry. 2017;10(1):S1422-S1428. DOI: 10.1016/j.arabjc.2013.04.018
17.Oh SJ, Chi DY, Mosdzianowski C, Kil HS, Ryu JS, Moon DH. The automatic production of 16alpha-[18F]fluoroestradiol using a conventional [18F]FDG module with a disposable cassette system. Applied Radiation and Isotopes. 2007;65(6):676-681. DOI: 10.1016/j.apradiso.2006.06.016
18.International Conference of Harmonization of Technical Requirements for Registration of Pharmaceuticals for Human Use and Validation of Analytical Procedures, Text, and Methodology (ICH Q2R1). Nov 2005
19.Brüggemann L, Quapp W, Wennrich R. Test for non-linearity concerning linear calibrated chemical measurements. Accreditation and Quality Assurance. 2006;11(12):625-631. DOI: 10.1007/s00769-006-0205-x. DOI: 10.1186/2191-219x-3-3
20.Sanabri L, Marinez J, Baenay. Validación de una metodología analítica por HPLC-DAD para la cuantificación de cafeína en un ensayo de permeación in vitro empleando mucosa oral porcina. Revista Colombiana de Ciencias Químicas y Farmacéuticas. 2017;46(2):202-219
21.Shetty HU, Morse CL, Zhang Y, Pike VW. Characterization of fast-decaying PET radiotracers solely through LC-MS/MS of constituent radioactive and carrier isotopologues. EJNMMI Research. 2013;3(3):1-8. DOI: 10.1186/2191-219x-3-3
22.Kung M-P, Kung HF. Mass effect of injected dose in small rodent imaging by SPECT and PET. Nuclear Medicine and Biology. 2005;32:673-678. DOI: 10.1016/j.nucmedbio.2005.04.002
23.Mizrahi R, Houle S, Vitcu I, Ng A, Wilson AA. Side effects profile in humans of (11)C-(+)-PHNO, a dopamine D(2/3) agonist ligand for PET. Journal of Nuclear Medicine. 2010;51(3):496-497. DOI: 10.2967/jnumed.109.072314
24.Madsen K, Marner L, Haahr M, Gillings N, Knudsen GM. Mass dose effects and in vivo affinity in brain PET receptor studies--a study of cerebral 5-HT4 receptor binding with [11C]SB207145. Nuclear Medicine and Biology. 2011;38(8):1085-1091. DOI: 10.1016/j.nucmedbio.2011.04.006
Written By
Roberto Mercado, Silvia Lagos and Ethel Velásquez
Submitted: 05 May 2023Reviewed: 09 May 2023Published: 26 November 2023
 Open access peer-reviewed chapter