Open Access is an initiative that aims to make scientific research freely available to all. To date our community has made over 100 million downloads. It’s based on principles of collaboration, unobstructed discovery, and, most importantly, scientific progression. As PhD students, we found it difficult to access the research we needed, so we decided to create a new Open Access publisher that levels the playing field for scientists across the world. How? By making research easy to access, and puts the academic needs of the researchers before the business interests of publishers.
We are a community of more than 103,000 authors and editors from 3,291 institutions spanning 160 countries, including Nobel Prize winners and some of the world’s most-cited researchers. Publishing on IntechOpen allows authors to earn citations and find new collaborators, meaning more people see your work not only from your own field of study, but from other related fields too.
To purchase hard copies of this book, please contact the representative in India:
CBS Publishers & Distributors Pvt. Ltd.
www.cbspd.com
|
customercare@cbspd.com
The main objective of this study is to understand the influence of various chemical reactions that participate on NO creation or reduction in N2/O2 mixed gas induced by negative corona discharge under different O2 concentrations (5%, 10%, 15%, 20% and 25%). The basic chemistry of NO evolution that is presented in this study is based on a comprehensive collection of processes that were gathered into 150 specific chemical reactions involving 25 molecular, excited, atomic, and charged entities. Without the diffusion and convective factors, the density was computed using the continuity equation over a range of electric reduction fields between 50 and 90 Td (1Td = 10−21 V.m2), at different points in the ranges 10−9–10−4 s. The outcomes of our numerical simulations demonstrate the impact of various chemical processes on NO production and decrease, including: N(2D) + O2 → NO + O and: NO + O + N2 → NO2 + N2 respectively. Our research has shown that at 50 and 70 Td, nitrogen oxide generation is dominated by an O2 concentration of 5%, whereas at 90 Td, it is dominated by an O2 concentration of 10%. These outcomes are true for both reactions.
Theoretical Physics Laboratory, Faculty of Sciences, Department of Physics, University of Tlemcen, Algeria
Abdel Karim Ferouani*
Theoretical Physics Laboratory, Faculty of Sciences, Department of Physics, University of Tlemcen, Algeria
Higher School of Applied Sciences, ESSA-Tlemcen, Tlemcen, Algeria
Mohammed Sahlaoui
Theoretical Physics Laboratory, Faculty of Sciences, Department of Physics, University of Tlemcen, Algeria
Higher School of Applied Sciences, ESSA-Tlemcen, Tlemcen, Algeria
Mostefa Lemerini
Theoretical Physics Laboratory, Faculty of Sciences, Department of Physics, University of Tlemcen, Algeria
*Address all correspondence to: inesmedjahdi@yahoo.com and ferouani_karim@yahoo.fr
1. Introduction
When building and enhancing combustion systems, the emission of nitrogen oxides continues to be one of the main environmental problems [1, 2, 3, 4, 5]. There is a lot of research being done on gas discharge plasmas and how they might be used in other fields (physics, chemistry, biology...) [6, 7, 8, 9, 10]. They can be used for reforming the poisonous pollutants, such as NOX, SOX, COX, etc. These studies are based on the numerical equations for the reduction of NOX gases in reactors. Discharges in N2/O2 mixtures can differ considerably from discharges in pure N2 or O2 in a number of characteristics (principally, in chemical and ionic composition). Theoretical modeling of kinetic processes in N2/O2 discharges has been developed in several works [11, 12, 13, 14, 15].
For a better understanding of the processes taking place in the atmosphere and in a range of modern plasma technologies, the non-equilibrium kinetics of low pressure plasmas in N2/O2 mixtures is a crucial area of research. Understanding the operation of plasma reactors used for chemical synthesis and surface treatments of diverse materials, in particular, requires knowledge of the volume and surface kinetics of active species like N, O, N(2D), or NO [16, 17, 18, 19, 20, 21]. On the subject of discharges in oxygen or air, various authors presented theoretical and experimental works [22, 23, 24, 25]. Others were interested to study electron swarm parameters in N2/O2 mixtures which are of great interest in atmospheric physics, pollution control or for application as electrical insulation media [26, 27, 28, 29]. These study at investigating the physical behavior of N2 and O2 mixtures in order to predict and optimize their electric strength.
I Stefanović et al. [30], have studied kinetics of ozone and nitric oxides in dielectric barrier discharges in O2/NOx and N2/O2/NOx mixtures. They have measured various concentrations of NO, NO2, NO3, N2O5, and O3 by classical absorption spectroscopy in dielectric barrier discharges in flowing O2/NOx and N2/O2/NOx mixtures. They have reported on a comparison of the measured concentrations with a zero-dimensional numerical kinetic model. They have shown that their model accurately describes the kinetics of ozone and the nitric oxides in the DBD in oxygen and dry air with small admixtures of NOx. Xing Fan et al. [31], have been developed a coaxial dielectric barrier discharge (DBD) reactor for plasma and plasma-catalytic conversion of dilute N2O in N2 and N2/O2 mixtures at both room and high temperature (300°C). They show that N2O conversion increases with the increase of discharge power and decreases with the increase of O2 content. They also show that increasing the inlet N2O concentration from 100 to 400 ppm decreases the conversion of N2O under an N2 atmosphere but increases that under an N2/O2 atmosphere. They have concluded that concentrating N2O in the N2/O2 mixture could alleviate the negative influence of O2 by increasing the involvement of plasma reactive species (e.g., N2(A3Σ+) and O(1D)) in N2O conversion. Haefliger et al. [32], have studied experimentally derived rate coefficients for electron ionization, attachment and detachment as well as ion conversion in pure O2 and N2/O2 mixtures. Four ion species and seven rate coefficients make up the model they are utilizing. They compared their findings to a number of sources, and most rate coefficients showed good agreement. They demonstrate that the waveforms’ informative content is sufficient to differentiate between the two detaching ions, O andO−, and their method may be used to analyze other gases or mixes that undergo electron detachment and ion conversion. For estimating the critical electric field strength of the mixtures, they propose a criterion based on the eigenvalues of the matrix describing the interaction of electrons and ions. Yamamoto et al. [33] developed a method for the breakdown of NOx pollutants that involved a chemical reactor coupled with plasma discharge. Since the plasma nitrogen monoxide was transformed into nitrogen dioxide, the reduction mechanisms’ action resulted in the transformation of nitrogen dioxide into nitrogen. They looked at three different plasma reactor models, and they noticed that nearly all of the nitrogen dioxide was breaking down. Mei-Xiang et al. [34] investigated metal catalyst and plasma discharge combination for simultaneous removal of NOx and dust from diesel exhaust. During the plasma creation, the temperature for combustion falls and the efficiency of NOx to NO conversion is reduced. Wang et al. [35] employed the DBD method to reform carbon dioxide inside the plasma reactor and create nonthermal plasma. Separate studies on the reformation of carbon dioxide by catalytic and nonthermal plasma were conducted. They discovered that employing a DBD reactor significantly reduces CO2 concentration over time compared to other techniques. Abedi-Varaki et al. [36] studied the temporal fluctuations of the number density and reaction rate of the nitrogen monoxide molecules and other generated species inside the DBD plasma reactor using a zero-dimensional model.
In this way, the aim of the present study is to simulate various values of O2 concentrations (5%, 10%,15%, 20% and 25%), the temporal evolution of 25 chemical species (electrons e, molecules N2, O2, O3, atoms N, O, nitric oxides NO, N2O, NO2, NO3, N2O5, positive ions (O+, O2+,O4+,N+, N2+,NO+), negative ions (O−, O2−, O3−, O4−,NO2−,NO3−) and metastables species N(2D), O(1D). These different species react following 150 selected chemical reactions. The time varied from 10−9 to 10−4 s. In this numerical simulation we suppose various effects induced by the passage of a corona discharge in a mixed gas. For the sake of simplification, we assume that the gas has no convective movement gradients and the temperature remains constant.
The basic formulas used in the present work consists of a system of equations that takes into account the variation of the density and the chemical kinetics of the environment. We developed a zero order numerical code to resolve the transport equations for neutral and charged particles. The algorithm is based on the time integration of the system of equations under consideration the variation of the density and the chemical kinetics of the environment. The system of the chemical kinetics equations can be described by a system of ordinary differential equations (i.e., the algorithm is defined by time integration) of the following form:
dNidt=∑j=1jmaxSijwherej=1,…,jmaxE1
where:
Sij=Gij−LijE2
Ni show the vector of species densities, i = 1 up to 25 thought about in the plasma and Sij the source term vector related to the contributions from various processes and dependent on the reaction coefficients. Gij and Lij stand for the gain and loss of species i as a result of chemical reactions from j = 1 to jmax = 150, respectively. The solution of such a system requires the knowledge of the initial concentrations. The total density N of the gas is given by the ideal gas law:
P=NkbTE3
Where P displays the pressure, kb Boltzmann constant and T the absolute temperature. The source term Sij of the density conservation factored in the gas’s reactivity Eq. (1).
Gij=∑μKμTninjμE4
Lij=∑νKνTninjE5
Kμ(T) and Kν (T) are the reaction’s coefficients μ or ν and (ninj) is the product of the species i and j interaction densities with the reaction μ or ν. This Arrhenius formula is satisfied by these coefficients.
KμT=A.exp−θμTE6
KνT=B.exp−θνTE7
Where A and B are the constants factor and θμ and θνare the reactions activation energy and T is the species absolute temperature.
The chemical kinetics involves 25 different chemical species: electrons (e), molecules N2, O2, O3, atoms N, O, nitric oxides NO, N2O, NO2, NO3, N2O5, positive ions (O+, O2+,O4+,N+, N2+,NO+), negative ions (O−,O2−, O3−, O4−,NO2−,NO3−), metastable species N(2D), O(1D). These different species react following 150 selected chemical reactions, the main ones are given in Table 1.
Chemical reactions
Rate coefficients
R1
N(2D) + O2 → NO + O
k1 = 0.97 × 10⁻¹¹
R2
N + O2 → NO + O
k2 = 0.44 × 10⁻¹¹
R3
O3− + N → NO + O2 + e
k3 = 4.31 × 10⁻⁷
R4
O2+ + N2 → NO + NO+
k4 = 1.0 × 10⁻¹⁷
R5
O2− + NO+ → NO + O2
k5 = 4.0 × 10⁻⁷
R6
N2O5 + NO2−→ NO + NO3− + NO3
k6 = 7.0 × 10⁻¹⁰
R7
O(1D) + NO2 → NO + O2
k7 = 0.14 × 10⁻⁹
R8
N+ + NO2 → NO + NO+
k8 = 5.00 × 10⁻¹⁰
R9
O3 + N2+ → N2 + O + O2+
k9 = 1.00 × 10⁻¹⁰
R10
NO + O + N2 → NO2 + N2
k10 = 2.5 × 10⁻¹⁰
R11
NO + N → N2 + O
k11 = 0.32 × 10⁻¹⁰
R12
NO + O3− → NO3− + O
k12 = 1.0 × 10⁻¹⁰
R13
NO + O(1D) → O2 + N
k13 = 1.5 × 10⁻¹⁰
R14
NO + O3 → NO2 + O2
k14 = 0.18 × 10⁻¹¹
R15
NO + O → N + 2O
k15 = 0.18 × 10⁻¹¹
R16
NO + O3− → NO2− + O2
k16 = 2.6 × 10⁻¹²
R17
NO + O4− → NO3− + O2
k17 = 2.5 × 10⁻¹⁰
R18
NO + O2+ → NO+ + O2
k18 = 3.0 × 10⁻¹⁰
R19
NO + O+ → NO+ + O
k19 = 1.0 × 10⁻¹²
R20
NO + O− → NO2 + e
k20 = 2.6 × 10⁻¹⁰
R21
O4+ + O− → O2 + O3
k21 = 4.00 × 10⁻⁷
R22
N2O + O+ → N2 + O2+
k22 = 2.00 × 10⁻¹¹
R23
O4− + O → O3− + O2
k23 = 4.00 × 10⁻¹⁰
R24
O4+ + NO → NO+ + 2O2
k24 = 1.00 × 10⁻¹⁰
R25
e + O2 → O + O(1D) + e
k25 = 3.2 × 10⁻¹¹
R26
e + N2 → N + N + e
k26 = 2.0 × 10⁻¹¹
Table 1.
The primary plasma processes that produce the primary species involved in NO reduction and production, as well as their rate coefficients (rate coefficients are in units of cm3·molecule−1·s−1 for two body reactions, and cm6. Molecule−1·s−1 for three body reactions). They are taken from the literature [37, 38, 39, 40].
In this section we will analyze the effects of important chemical reactions that participated on creation or reduction of NO specie. In our work, we have found that the following reactions are the most influential on creating NO:
N2D+O2→NO+OE8
N+O2→NO+OE9
O3−+N→NO+O2+eE10
O2++N2→NO+NO+E11
O2−+NO+→NO+O2E12
and the others following reactions are the most influential on reducing NO:
NO+O+N2→NO2+N2E13
NO+N→N2+OE14
NO+O3−→NO3−+OE15
NO+O1D→O2+NE16
NO+O3→NO2+O2E17
So, we proposed to represent only the most important reactions namely (R1) and (R10). For that, we analyze for each electric reduced field (50, 70 and 90 Td), the evolution of density and reaction rate between 10−9 and 10−4 s, under different O2 concentrations: 5%, 10%,15%, 20% and 25%.
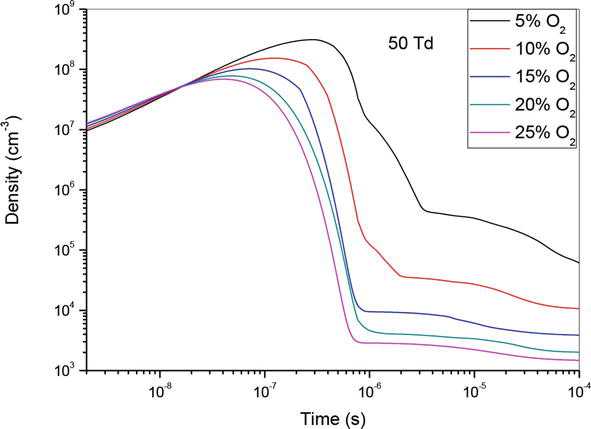
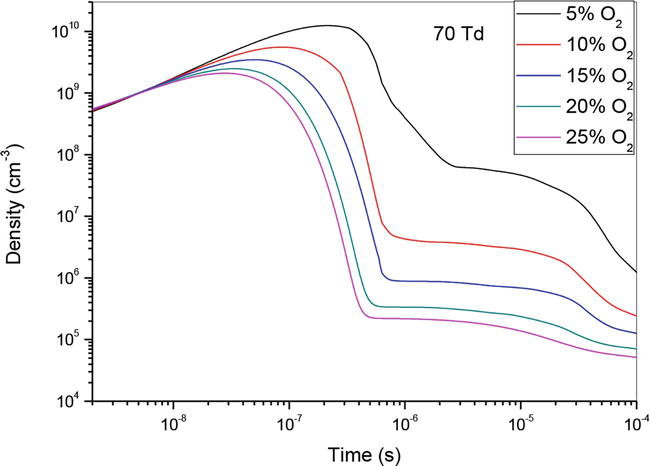
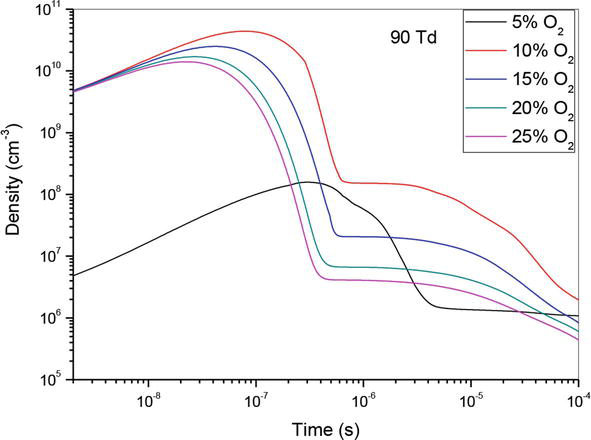
Figures 1–3, show the temporal evolution of density of N(2D) specie which participated on the creation of nitrogen oxide in N2/O2 mixture at 50Td under different O2 concentrations: 5%, 10%,15%, 20% and 25%. As illustrated on these curves, the evolution of NO density depends of O2 concentrations. However, we notice that when the O2 concentration increases NO density decreases, except for the value 90Td where we note a decrease in the density at the concentration 5%. Globally, we observe on these three figures, a first step which goes up to 4 × 10⁻⁷ s where the density increases, and a second stage which goes up to 10−4 s where the density decreases. We also notice that the gap between the different curves decreases when the oxygen concentration increases.
Figure 1.
Temporal evolution of N(2D) density that participate in the creation of NO specie in the mixture N2/O2 at 50Td under different O2 percentages: 5%, 10%,15%, 20% and 25%.
Figure 2.
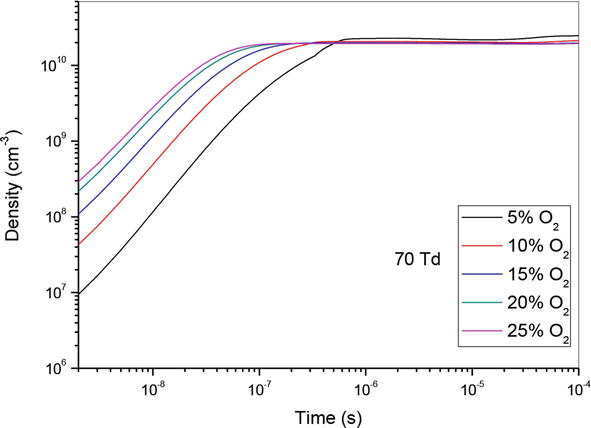
Temporal evolution of N(2D) density that participate in the creation of NO specie in the mixture N2/O2 at 70Td under different O2 percentages: 5%, 10%,15%, 20% and 25%.
Figure 3.
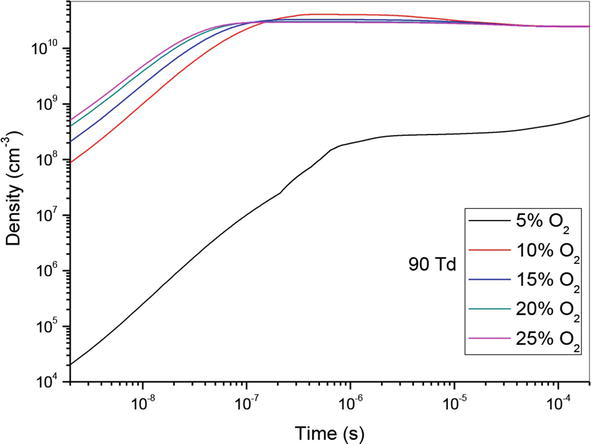
Temporal evolution of N(2D) density that participate in the creation of NO specie in the mixture N2/O2 at 90Td under different O2 percentages: 5%, 10%,15%, 20% and 25%.
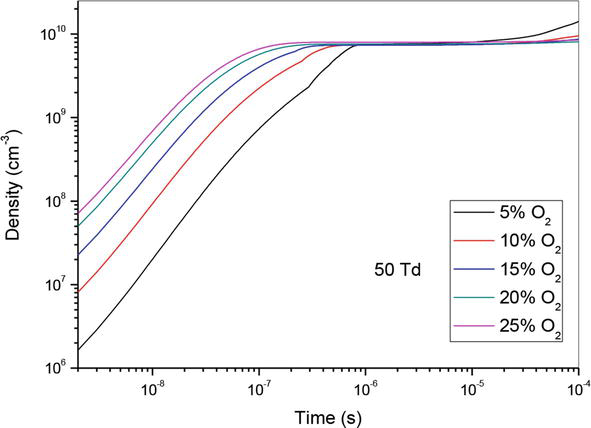
So, in Figures 4–6, we have represented the temporal evolution of O density of the same O2 concentrations as before. We note firstly an increase of density until 10−6 s, followed by stabilization. Secondly, we observe that the rise of O2 concentration induces the increase of atomic oxygen density.
Figure 4.
Temporal evolution of O density that participate in the creation of NO specie in the mixture N2/O2 at 50Td under different O2 percentages: 5%, 10%,15%, 20% and 25%.
Figure 5.
Temporal evolution of O density that participate in the creation of NO specie in the mixture N2/O2 at 70Td under different O2 percentages: 5%, 10%,15%, 20% and 25%.
Figure 6.
Temporal evolution of O density that participate in the creation of NO specie in the mixture N2/O2 at 90Td under different O2 percentages: 5%, 10%,15%, 20% and 25%.
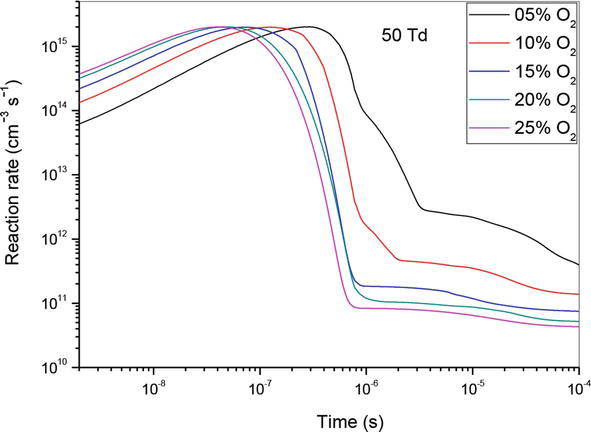
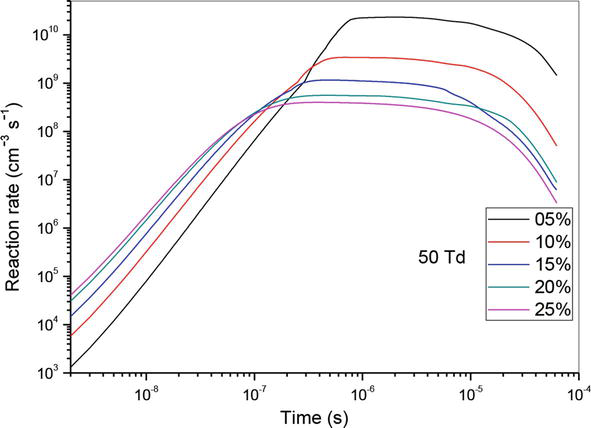
Let us go on to analyze the reaction rate with the same values as before. We have represented in Figures 7–9, the temporal evolution of reaction rate of (R1): N(2D) + O2 → NO + O, that participate in the production of NO specie in N2/O2 mixture at 50, 70 and 90 Td, under five various O2 concentrations: 5%, 10%, 15%, 20% and 25%. Let us start with 50 Td. We can say through curves represented in Figure 7, that the effect of the reaction passes by three stages:
Between 10−9 and 10−7 s, the influence of the reaction increases with the increase of the O2 concentrations and his domination is obtained for 25%.
From 10−7 to 10−6 s, the reaction impact decreases quickly while the O2 concentrations increases and his domination is obtained for 5%.
From 10−6 to 10−4 s, the reaction’s impact lessens but only somewhat.
Figure 7.
Temporal evolution of reaction rate of (R1): N(2D) + O2 → NO + O, which contributed in the creation of NO specie in N2/O2 mixture at 50Td, under various O2 concentrations: 5%, 10%,15%, 20% and 25%.
Figure 8.
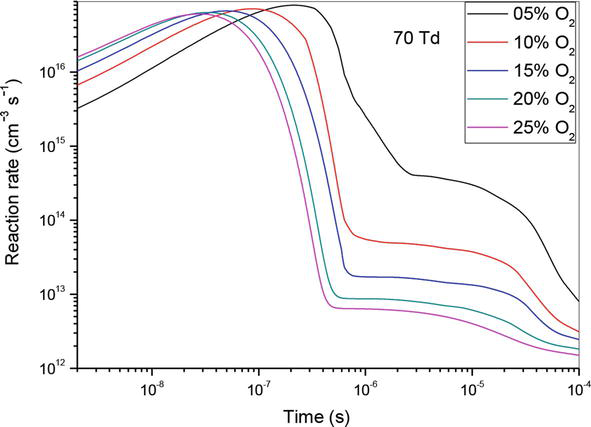
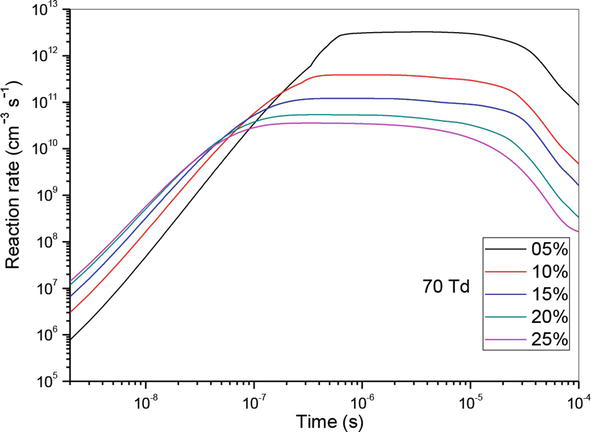
Temporal evolution of reaction rate of (R1): N(2D) + O2 → NO + O, which contributed in the creation of NO specie in N2/O2 mixture at 70Td, under various O2 concentrations: 5%, 10%,15%, 20% and 25%.
Figure 9.
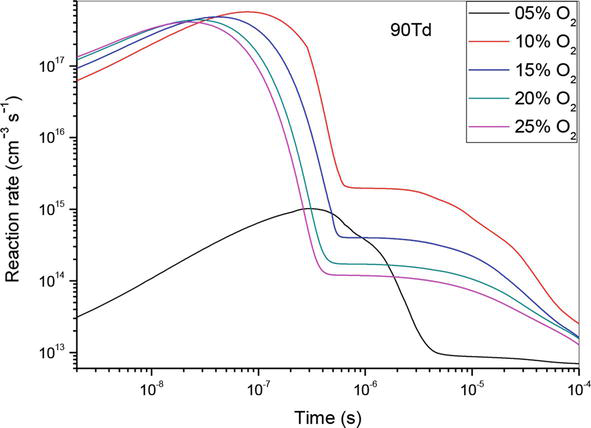
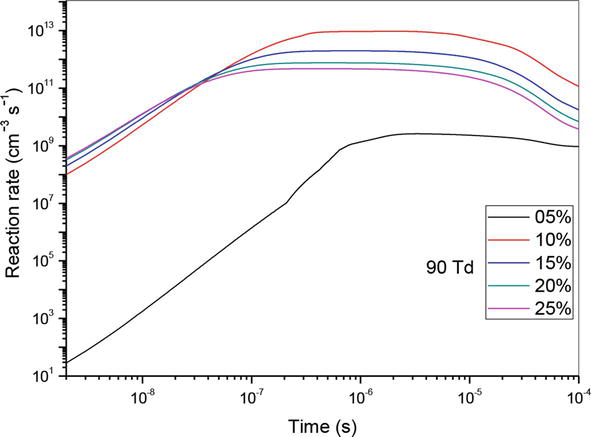
Temporal evolution of reaction rate of (R1): N(2D) + O2 → NO + O, which contributed in the creation of NO specie in N2/O2 mixture at 90Td, under various O2 concentrations: 5%, 10%,15%, 20% and 25%.
Let us examine what occurs when the electric reduced field is increased to 70 Td. Figure 8 presents the findings. We see that the curves have the same form as those previously obtained for 50 Td, but the average reaction time is shorter because of the energy injected into the gas, which is more significant.
To wrap up our research, we have demonstrated in Figure 9, the temporal evolution of reaction rate of (R1) which contribute to NO production at 90Td. As before, we observe the same effect for the reaction (R1), excepted the value 5%. Indeed, at this value the reaction rate does not have a great influence on the nitrogen oxide production. So, we can say that at 90 Td it’s 10% of O2 concentration that becomes dominant.
Let us now analyze the influence of reaction (R10) which is the principal reaction in the consumption of nitrogen oxide. For this reason, we have shown in Figures 10–12 the evolution of the reaction rate for three values of the reduced electric field (50, 70 and 90 Td), and five values of O2 concentrations (5%, 10%, 15%, 20% and 25%). We notice that NO, can react with the oxidizing radical such as O to form especially NO2. We note firstly that the effectiveness of these concentrations is higher at the end than at the beginning. Secondly, we observe two stages of evolution:
At 50 and 70 Td, and between 10−9 and 4 × 10⁻⁷ s, plus the value of the O2 concentrations increases more reaction is effective.
At 50 and 70 Td, and between 4 × 10⁻⁷ and 10−4 s, the phenomenon reverses and we observe plus the O2 concentration increases, the effect of the reaction decreases.
At 90 Td, the phenomena are the same as described before, with the exception of 5%, where the reaction’s influence is much weaker than it is at other concentrations. In our opinion, the synthesis of the oxygen atom is insignificant at this energy level and low concentration when compared to other concentrations 10, 15, 20 and 25%.
Figure 10.
Temporal evolution of reaction rate of (R10): NO + O + N2 → NO2 + N2, reaction that participate in the reduction of NO specie in N2/O2 mixture at 50Td, under various O2 concentrations: 5%, 10%,15%, 20% and 25%.
Figure 11.
Temporal evolution of reaction rate of (R10): NO + O + N2 → NO2 + N2, reaction that participate in the reduction of NO specie in N2/O2 mixture at 70Td, under various O2 concentrations: 5%, 10%,15%, 20% and 25%.
Figure 12.
Temporal evolution of reaction rate of (R10): NO + O + N2 → NO2 + N2, reaction that participate in the reduction of NO specie in N2/O2 mixture at 90Td, under various O2 concentrations: 5%, 10%,15%, 20% and 25%.
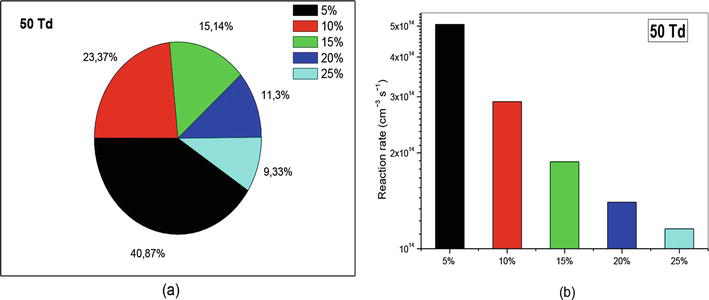
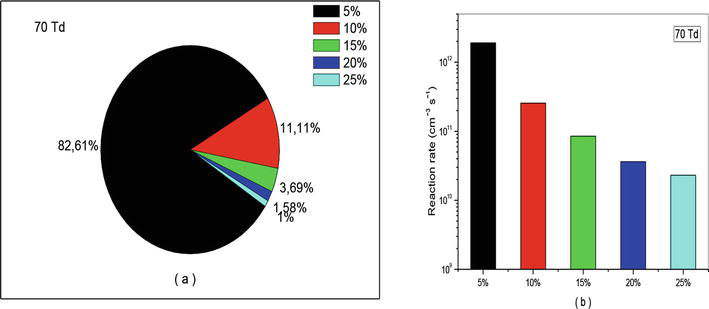
To highlight our results, we chose to represent them as a percentage and histogram representations. So, we have represented in the Figures 13–18 the percentage of the two reactions that participated on the creation and reduction of nitrogen oxide to get an idea about their impact in this conversion (At left: (a) with percentage representation; At right (b) with histogram representation). First of all, let us see Figure 13(a) where we have highlighted percentages for each O2 concentration at 50 Td. We notice that at the concentration 5%, nitrogen oxygen is crated almost four times more than when the concentration is at 25%.
Figure 13.
Representation of reaction rate of (R1): N(2D) + O2 → NO + O, that participate in the creation of NO specie in N2/O2 mixture at 50Td under various O2 concentrations (5%, 10%, 15%, 20%, and 25%).
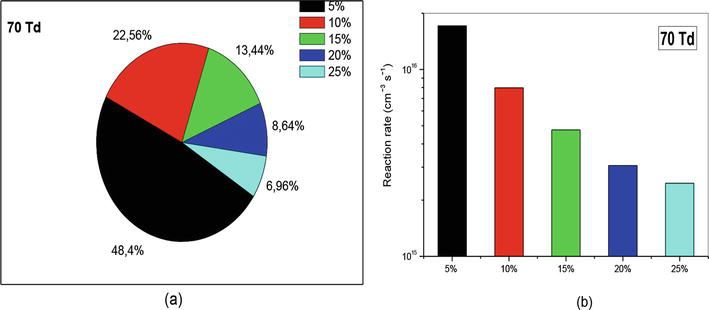
Figure 14.
Representation of reaction rate of (R1): N(2D) + O2 → NO + O, that participate in the creation of NO specie in N2/O2 mixture at 70Td under various O2 concentrations (5%, 10%, 15%, 20%, and 25%).
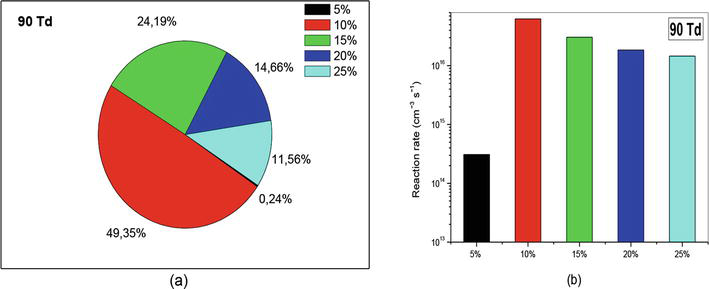
Figure 15.
Representation of reaction rate of (R1): N(2D) + O2 → NO + O, that participate in the creation of NO specie in N2/O2 mixture at 90Td under various O2 concentrations (5%, 10%, 15%, 20%, and 25%).
Figure 16.
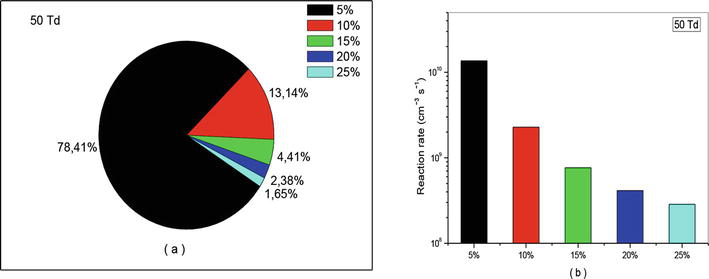
Representation of reaction rate of (R10): NO + O + N2 → NO2 + N2, that participate in the creation of NO specie in N2/O2 mixture at 50Td under various O2 concentrations (5%, 10%, 15%, 20%, and 25%).
Figure 17.
Representation of reaction rate of (R10): NO + O + N2 → NO2 + N2, that participate in the creation of NO specie in N2/O2 mixture at 70Td under various O2 concentrations (5%, 10%, 15%, 20%, and 25%).
Figure 18.
Representation of reaction rate of (R10): NO + O + N2 → NO2 + N2, that participate in the creation of NO specie in N2/O2 mixture at 90Td under various O2 concentrations (5%, 10%, 15%, 20%, and 25%).
Move us on to the next Figure 14(a), where we have represented the percent influence for 70 Td. We observe also almost the same phenomenon as before. Indeed, we note that the creation of NO specie is still important for the concentration 5%, where we get 48.4%, against 6.96% for the concentration 25%. These results are also verified on the Figures 13(b) and 14(b), where we can say the phenomenon of NO creation dominates when the O2 concentration equals 5%.
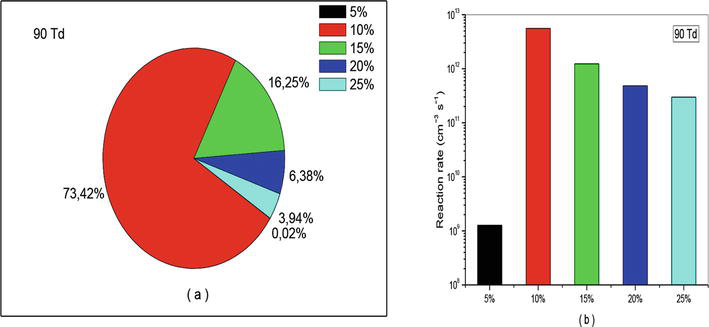
Now let us see what happens when we increase the reduced electric field to 90 Td. The results are given in the Figure 15(a) and (b). We clearly observe that when the concentration equals 5%, the creation is totally negligible (0.24%) compared to the other concentrations. Now, it’s the 10% concentration that takes over and becomes dominant over all other concentrations.
Let us continue our analysis with reaction (R10) which is responsible for consumption of nitrogen oxide. The effects of this reaction have been represented in Figures 16–18 with percentage (a) and (b) with diagram of different reactions rate. We observe also on these figures the same effect as that observed in the case of creation. The only difference lies in the intensity of the values. For example, at 50 and 70 Td we found in average 80% instead of 44%, and at 90Td we get 73.42% against 49.35%. These results are also verified on Figures 16(b),17(b) and 18(b).
In this study, a zero-dimensional model is considered for numerical studies of NO creation and reduction in N2/O2 mixture under various O2 concentrations (5%, 10%,15%, 20% and 25%). In particular, we have analyzed in the ranges 10−9–10−4 s the influence of chemical reactions, which actively participate in the conversion of nitrogen oxide specie at 50, 70 and 90Td. N(2D) and O are the two species on which we have concentrated.
The obtained data demonstrate that nitrogen oxide conversion varies with oxygen concentration. In fact, it has been found that the rise and fall of various species varies and are highly influenced by the values of O2 concentrations. These findings enable us to recognize the crucial function that the reaction has in NO conversion, and they may be summed up as follows:
N(2D) specie produces most of the NO through the following reaction:
N(2D) + O2 → NO + O.
The mechanism of NO reduction is due mainly by O specie through the reaction:
NO + O + N2 → NO2 + (N2)
We observe that the influence of the reaction (R1) was acquired for the low O2 concentration of 5% at 50 and 70 Td for creation. In fact, we discovered an average of 44%, compared to 10% at 90 Td, where we got close to 50%.
In terms of reduction, we also see that at 50 and 70 Td, the reaction’s effect (R10) was attained for the low O2 concentration of 5%, although we had typically attained 80%. The influence of this reaction was discovered for 90 Td at a concentration of 10%, which is equal to 73.42%.
Finally, the acquired data unmistakably demonstrate the significance of chemical processes and oxygen concentrations in the generation or removal of nitrogen oxide.
The work of Pr Abdel Karim Ferouani was supported by DGRSDT, Algerian Ministry of Higher Education and Research, under Project PRFU-code A11N01EP130220230001.
References
1.Glarborg P, Miller JA, Ruscic B, Klippenstein SJ. Modeling nitrogen chemistry in combustion. Progress in Energy and Combustion Science. 2018;67:31-68. DOI: 10.1016/j.pecs.2018.01.002
2.Zhang Y, Mathie O, Petersen EL, Bourque G, Curran HJ. Assessing the predictions of a NOx kinetic mechanism on recent hydrogen and syngas experimental data. Combustion and Flame. 2017;182:122-141. DOI: 10.1016/j.combustflame.2017.03.019
3.Ferouani AK, Lemerni M, Belhour S, Askri S. Simulacion numerica de la evolucion radial y axial del campo electrico reducido en la conversion de oxidos de nitrogeno. Revista Cubana de Física. 2020;37:108-116
4.Glarborg P. Hidden interactions-trace species governing combustion and emissions. Proceedings of the Combustion Institute. 2007;31:77-98. DOI: 10.1016/j.proci.2006.08.119
5.Abian M, Alzueta MU, Glarborg P. Formation of NO from N2/O2 mixtures in a flow reactor: Toward an accurate prediction of thermal NO. International Journal of Chemical Kinetics. 2015;47:518-532. DOI: 10.1002/kin.20929
6.Hatakeyama K, Tanabe S, Hayashi Y, Matsumoto H. NOX decomposition by discharge plasma reactor. Journal of Advanced Sciences. 2001;13:459-462. DOI: 10.2978/jsas.13.459
7.Yoshida K, Rajanikanth BS, Okubo M. NOX reduction and desorption studies under electric discharge plasma using a simulated gas mixture: A case study on the effect of corona electrodes. Plasma Science and Technology. 2009;11:327-333. DOI: 10.1088/1009-0630/11/3/15
8.Balogh RM, Ionel I, Stepan D, Rabl HP, Pfaffinger A. NOX reduction using selective catalytic reduction (SCR) system-α variation test. Termotehnica. 2011;2:32-42
9.CreyghtonY, Pulsed Positive Corona Discharges: Fundamental Study and Application to Flue Gas Treatment [Thesis]. Technische University of Eindhoven Netherlands; 1994
10.Dujko S, Ebert U, White RD, Petrović ZL. Boltzmann equation analysis of electron transport in a N2/O2 streamer discharge. Japanese Journal of Applied Physics. 2011;50(8S1):08JC01. DOI: 10.1143/JJAP.50.08JC01
11.Batina J, Noël F, Lachaud S, Peyrous R, Loiseau JF. Hydrodynamical simulation of the electric wind in a cylindrical vessel with positive point-to-plane device. Journal of Physics D: Applied Physics. 2001;34:1510-1524. DOI: 10.1088/0022-3727/34/10/311
12.Ono R, Oda T. Visualization of streamer channels and shock waves generated by positive pulsed corona discharge using laser Schlieren method. Japanese Journal of Applied Physics. 2004;43:321-237. DOI: 10.1143/JJAP.43.321
13.Eichwald O, Yousfi M, Hennad A, Benabdessadok MD. Coupling of chemical kinetics, gas dynamics, and charged particle kinetics models for the analysis of NO reduction from flue gases. Journal of Applied Physics. 1997;82:4781-4794. DOI: 10.1063/1.366336
14.Dorai R, Hassouni K, Kushner MJ. Interaction between soot particles and NOX during dielectric barrier discharge plasma remediation of simulated diesel exhaust. Journal of Applied Physics. 2000;88:6060-6071. DOI: 10.1063/1.1320004
15.Loiseau JF, Batina J, Noël F, Peyrous R. Hydrodynamical simulation of the electric wind generated by successive streamers in a point-to-plane reactor. Journal of Physics D: Applied Physics. 2002;35:1020-1031. DOI: 10.1088/0022-3727/35/10/310
16.Bouzar M, Ferouani AK, Lemerini M, Hocini AK. Zero-dimensional model description of the effect of NOx removal in N2/O2/H2O/CO2 mixtures in a nonuniform field. High Temperature Material Processes: An International Quarterly of High-technology Plasma Processes. 2017;21:225-237. DOI: 10.1615/HighTempMatProc.2018025371
17.Chang JS. Physics and chemistry of plasma pollution control technology. Plasma Sources Science and Technology. 2008;17:045004. DOI: 10.1088/0963-0252/17/4/045004
18.Ferouani AK, Lemerini M, Merad L, Houalef M. Numerical modelling point-to-plane of negative corona discharge in N2 under non-uniform electric field. Plasma Science and Technology. 2015;17:469-474. DOI: 10.1088/1009-0630/17/6/06
19.Ferouani AK, Lemerini, Belhour S. Numerical modelling of nitrogen thermal effects produced by the negative dc corona discharge. Plasma Science and Technology. 2010;12:208-211. DOI: 10.1088/1009-0630/12/2/15
20.Flitti A, Pancheshnyi S. Gas heating in fast pulsed discharges in N2–O2 mixtures. The European Physical Journal-Applied Physics. 2009;45:21001. DOI: 10.1051/epjap/2009011
21.Zhao L, Adamiak K. EHD flow in air produced by electric corona discharge in pin–plate configuration. Journal of Electrostatics. 2005;63:337-350. DOI: 10.1016/j.elstat.2004.06.003
22.Ferouani AK, Lemerini M, Sahlaoui M, Askri S, Khaldi MFZ, Boumellah Y. The influence of radical N, O and O3 in the reduction of nitrogen oxides in a corona discharge. Journal of Fundamental and Applied Sciences. 2021;13:931-941. DOI: 10.4314/jfas.v13i2.16
23.Capitelli M, Ferreira CM, Gordiets BF, Osipov AI. Plasma Kinetics in Atmospheric Gases. Springer Science et Business Media; 2013. p. 31. DOI: 10.1007/978-3-662-04158-1
24.Pancheshnyi S. Effective ionization rate in nitrogen–oxygen mixtures. Journal of Physics D: Applied Physics. 2013;46:155201. DOI: 10.1088/0022-3727/46/15/155201
25.Zhao H, Lin H. Dielectric breakdown properties of N2–O2 mixtures by considering electron detachments from negative ions. Physics of Plasmas. 2016;23:073505. DOI: 10.1063/1.4956466
26.Hoesl A, Haefliger P, Franck CM. Measurement of ionization, attachment, detachment and charge transfer rate coefficients in dry air around the critical electric field. Journal of Physics D: Applied Physics. 2017;50:485207. DOI: 10.1088/1361-6463/aa8faa
27.Itikawa Y. Cross sections for electron collisions with nitrogen molecules. Journal of Physical and Chemical Reference Data. 2006;35:31-53. DOI: 10.1063/1.1937426
28.Itikawa Y. Cross sections for electron collisions with oxygen molecules. Journal of Physical and Chemical Reference Data. 2009;38:1-20. DOI: 10.1063/1.3025886
29.Bekstein A, Yousfi M, Benhenni M, Ducasse O, Eichwald O. Drift and reactions of positive tetratomic ions in dry, atmospheric air: Their effects on the dynamics of primary and secondary streamers. Journal of Applied Physics. 2010;107:103308. DOI: 10.1063/1.3410798
30.Stefanović I, Bibinov NK, Deryugin AA, Vinogradov IP, Napartovich AP, Wiesemann K. Kinetics of ozone and nitric oxides in dielectric barrier discharges in O2/NOx and N2/O2/NOx mixtures. Plasma Sources Science and Technology. 2001;10:406-416. DOI: 10.1088/0963-0252/10/3/303
31.Fan X, Kang S, Li J, Zhu T. Conversion of dilute nitrous oxide (N2O) in N2 and N2–O2 mixtures by plasma and plasma-catalytic processes. RSC Advances. 2018;8:26998-27007. DOI: 10.1039/C8RA05607B
32.Haefliger P, Hösl A, Franck CM. Experimentally derived rate coefficients for electron ionization, attachment and detachment as well as ion conversion in pure O2 and N2–O2 mixtures. Journal of Physics D: Applied Physics. 2018;51:355201. DOI: 10.1039/C8RA05607B
33.Yamamoto T, Yang CL, Beltran MR, Kravets Z. Plasma-assisted chemical process for NO/sub x/control. IEEE Transactions on Industry Applications. 2000;36:923-927. DOI: 10.1109/28.845073
34.Mei-Xiang P, Lin H, Shangguan WF, Huang Z. Simultaneous catalytic removal of NOX and diesel PM over La0.9K0.1CoO3 catalyst assisted by plasma. Journal of Environmental Sciences. 2005;17:220-223. DOI: 10.1109/28.845073
35.Wang XQ, Chen W, Guo QP, Li Y, Lv GH, Sun XP, et al. Characteristics of NOX removal combining dielectric barrier discharge plasma with selective catalytic reduction by C2H5OH. Journal of Applied Physics. 2009;106:013309. DOI: 10.1063/1.3160294
36.Abedi-Varaki M, Ganjovi A, Shojaei F, Hassani Z. A model based on equations of kinetics to study nitrogen dioxide behavior within a plasma discharge reactor. Journal of Environmental Health Science and Engineering. 2015;13:69-78. DOI: 10.1186/s40201-015-0228-5
37.Kossyi IA, Kostinsky AY, Matveyev AA, Silakov VP. Kinetic scheme of the non-equilibrium discharge in nitrogen-oxygen mixtures. Plasma Sources Science and Technology. 1992;1:207-220. DOI: 10.1088/0963-0252/1/3/011
38.Atkinson R, Baulch DL, Cox RA, Hampson RF, Kerr JA, Rossi MJ, et al. Photochemical and heterogeneous data for atmospheric chemistry: Supplement V. IUPAC Subcommittee on gas Kinetic data evaluation for atmospheric chemistry. Journal of Physical and Chemical Reference Data. 1997;26:521-1011. DOI: 10.1063/1.556011
39.Rosocha LA, Anderson GK, Bechtold LA, Coogan JJ, Heck HG, Kang M, et al. Non-Thermal Techniques for Pollution Control, Part B. Berlin: Springer-Verlag; 1993. p. 281. DOI: 10.1007/978-3-642-78476-7_21
40.Eichwald O, Guntoro NA, Yousfi M, Benhenni M. Chemical kinetics with electrical and gas dynamics modelization for NOx removal in an air corona discharge. Journal of Physics D: Applied Physics. 2002;35:439-450. DOI: 10.1088/0022-3727/35/5/305
Written By
Ines Sarah Medjahdi, Abdel Karim Ferouani, Mohammed Sahlaoui and Mostefa Lemerini
Submitted: 26 May 2023Reviewed: 07 June 2023Published: 19 February 2024
 Open access peer-reviewed chapter