Open Access is an initiative that aims to make scientific research freely available to all. To date our community has made over 100 million downloads. It’s based on principles of collaboration, unobstructed discovery, and, most importantly, scientific progression. As PhD students, we found it difficult to access the research we needed, so we decided to create a new Open Access publisher that levels the playing field for scientists across the world. How? By making research easy to access, and puts the academic needs of the researchers before the business interests of publishers.
We are a community of more than 103,000 authors and editors from 3,291 institutions spanning 160 countries, including Nobel Prize winners and some of the world’s most-cited researchers. Publishing on IntechOpen allows authors to earn citations and find new collaborators, meaning more people see your work not only from your own field of study, but from other related fields too.
To purchase hard copies of this book, please contact the representative in India:
CBS Publishers & Distributors Pvt. Ltd.
www.cbspd.com
|
customercare@cbspd.com
A study on socio-economic condition and challenges encountered by the farmers was done in purposively selected five districts of West Bengal, India. About 5000 respondents were randomly chosen for this study. The study of various socioeconomic indicators suggests that most goat farmers in these districts were illiterate and belong to the lower economic status. It had been noted that women were primarily involved in raising goats, and their financial situation was precarious. Most of these farmers had educational levels below the 10th standard and were engaged in domestic labor. The majority of these farmers had not had any training in scientific animal husbandry techniques; therefore, offering appropriate training in this area could be beneficial for their ability to support themselves. Given that these farmers have limited land holding capacity, goat farming could be a potential alternative to improve their financial situation. As a whole promotion of goat husbandry could be an ideal intervention to improve the socioeconomic condition of these farmers whose livelihood was in stake. It has been observed that various obstacles, such as a lack of training initiatives and educational opportunities, were the main hindrances for improving the socioeconomic well-being of farmers in the selected districts of West Bengal.
Biotech-KISAN Hub, Directorate of Research, Extension and Farms, West Bengal University of Animal and Fishery Sciences, India
Keshab Chandra Dhara*
Biotech-KISAN Hub, Directorate of Research, Extension and Farms, West Bengal University of Animal and Fishery Sciences, India
*Address all correspondence to: adfwbuafs@gmail.com
1. Introduction
The rural economy’s backbone remains to be agriculture and related activities, particularly raising livestock, which is crucial for the socio-economic advancement, generating revenue, and general well-being of rural farmers of West Bengal. In the rural sector, livestock is crucial for boosting household income and creating productive employment. West Bengal’s economic activity has seen fundamental changes throughout the previous few decades. Agriculture and related industries’ share in the labour force is dwindling. India has the world’s richest animal wealth, yet the productivity of the livestock industry is low [1]. Another explanation for it can be variations in the socio-economic circumstances of the livestock farmers. Studying the socio-economic situation of the rural livestock farmers is important in this context.
Post-Green Revolution, with input-intensive agriculture, India has transformed from a food-deficit nation into a food-surplus one. Animal husbandry is an integral part of rural India’s symbiotic system of livestock production and constructs a significant part of the livestock wealth of the country. The socio-economic structure of the nation and the economy are both significantly influenced by animal husbandry. In India, cattle and poultry are an essential component in the rural economy, providing farmers with additional income. More processed foods, especially meat, are becoming more popular in terms of consumer preferences. The sector has enormous potential to increase farmer’s income because of its rapid growth. So, the need for livestock rearing for alternative livelihood is the major priority of this day.
India is predicted to raise millions out of poverty due to its high development trajectory. Although India is currently ranked 132 out of 188 nations according to the latest report (Human Development Report, 2022) by United Nations Development Programme, though many of its residents’ quality of life does not currently align with this growth story. A detailed examination of the data reveals significant variability in India’s living conditions. Significant differences exist inter-state and inter-district levels. India can advance in the Human Development Index by improving the districts that have made relatively less progress towards reaching the important social outcome. The Transformation of Aspirational Districts Programme aims to quickly and efficiently transform these districts. Institutional support (crop insurance, electronic markets, artificial insemination, animal vaccination, etc.) ultimately enables a large number of Indian youths to take up industry-relevant skill training that will help them in securing a better livelihood. It has always been believed that change happens when it begins at the grassroots. Innovative ideas, strategies, practices, and methods should be used to develop the 117 aspirational districts of India with a concentrated effort to transform these districts. In West Bengal, as per NITI Aayog (National Institution for Transforming India), the five Aspirational Districts (Nadia, Murshidabad, Birbhum, Maldah, South Dinajpur) are only under “Lower Gangetic Plains Region” under 15 agro-climatic zones in India.
Black Bengal goat is a very useful small livestock in this area distributed in almost every household in this area. It is also a great source of income for the poor people of this region. Small-scale Goat farming has a very important role in reducing unemployment and poverty. The costs of rearing Black Bengal goats are lower with scientific practices. This creates small-scale enterprise which has tremendous potential in this area in terms of nutritional security, gainful self-employment, and economic upliftment. More than 85% of the population of this region is non-vegetarian and chevon or chicken is preferred by most of the people. Improvement of Black Bengal Goat production is necessary to benefit the rural community and smallholder farmers. India has a large population of goats (16.7% of the world’s total) and a diverse genetic group [2]. In India, there are 23 recognised goat breeds [3]. On the other side, West Bengal, with 10.7% of the national total, has the second-highest goat population in the nation (148.90 lakhs) [4]. Poor people in India who live in a variety of climatic conditions depend heavily on goats for their livelihood. Goat keeping creates employment in rural areas at a rate of 4.2% annually [5]. Due to their accessible market demand, goats are seen as fixed deposits for the poorest of the poor, providing funds as and when necessary [6]. Goat management is done with domestic waste and requires only a small cost. Thus, they do not need to incur any more managerial expenses. The primary way that rural women are able to significantly contribute to the financial needs of themselves and their families is through goat rearing. Goat keeping is a highly essential function for women in rural communities.
Based on criteria including poverty, poor health, educational attainment, socio-economic characteristics, etc., the NITI Aayog has designated various districts throughout the nation as aspirational districts in light of the socio-economic development status. Five aspirational districts (Nadia, Murshidabad, Birbhum, Maldah, Dakshin Dinajpur) have been recognised in West Bengal by NITI Ayog. The State can improve its ranking in the Human Development Index by improving these districts that have made substantially less progress toward reaching the important social outcome. The position that each farmer holds in relation to the prevailing average standards, material ownership, social engagement, and other criteria is referred to as their socio-economic status [7]. In light of this context, an effort has been made to study the socio-economic situation and barriers experienced by the farmers in West Bengal’s several aspirational districts. Knowledge is the body of information that a person or a society possesses and is an intimate acquaintance with facts [8]. Adoption of any new or enhanced technology or methods is acquired from knowledge. An evaluation of the farmers’ existing knowledge and adoption level is necessary prior to the implementation of various entrepreneurship development programs in the study area.
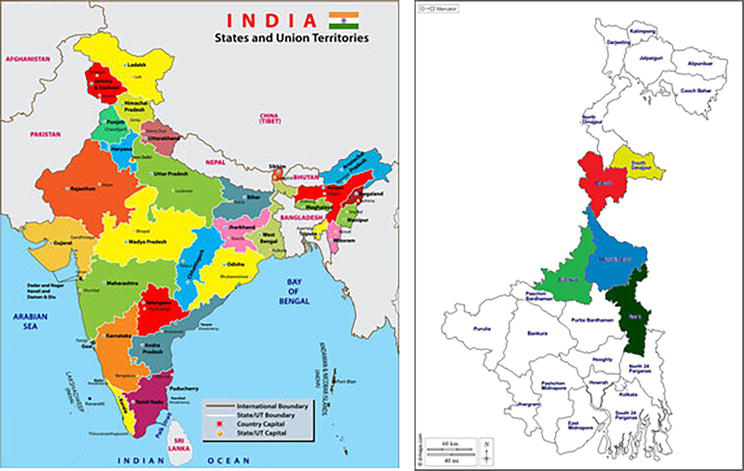
As per NITI Aayog, Government of India, the aspirational districts under Lower Gangetic Plains Region in West Bengal are Birbhum, Nadia, Maldah, South Dinajpur, and Murshidabad, where this study was conducted (Figure 1).
Figure 1.
Study area map. Source: Government of India.
3.2 Sampling design
The five aspirational districts (identified by the NITI Aayog, Government of India) in West Bengal were purposively selected for this study because of their socio-economic condition, level of poverty, poor health, and educational status. Five Blocks were purposively selected from each District. These blocks are Ilambazar from Birbhum District, Haringhata from Nadia District, Bamongola from Maldah District, Kusmandi from South Dinajpur District, and Murshidabad-Jianganj from Murshidabad District. A total of 5000 respondents were randomly selected with a sample of 1000 farmers from each block of each district. The socio-economic status of randomly selected 5000 farmers from the Nadia, Murshidabad, Birbhum, Maldah, and Dakshin Dinajpur districts of West Bengal state was done between January 2020 to September 2022 under the Department of Biotechnology, Government of India, project entitled “Establishment of Biotech KISAN Hub” at West Bengal University of Animal and Fishery Sciences to ascertain the problems of the local farmers for linking available Science and Technology to the farmers of Aspirational Districts of West Bengal to provide a suitable and alternative solution for their better livelihood.
3.3 Methodology used
All the selected variables were assessed either using a pre-existing scale or by creating a schedule. The socio-economic profile of the livestock farmers, including their caste, religion, level of education, family size, occupation, and annual income, has been studied. A pre-tested structured interview schedule was used to get the data. For a better understanding of the results, statistical techniques such as Percentage Analysis, Chi-Square Test, Standard Error of the Mean, Spearman Correlation Coefficient, and Analysis of Variance (ANOVA) have been measured. These tests were conducted using statistical tool, SPSS (Statistical Package for the Social Sciences), Version 20. Responses were collected between January 2020 to September 2022.
As identified by NITI Aayog, the present study was carried out among 5000 farmers in five aspirational districts of West Bengal (Birbhum, Nadia, Maldah, South Dinajpur, and Murshidabad) in order to evaluate their socio-economic and demographic condition as well as the difficulties they face. This was done in order to identify the issues affecting the local farmers in the area. The analytical studies are shown in the following manner:
4.1 Demographic profile of the farmers
4.1.1 Gender
In the demographic study and in raising livestock, gender is a key factor. It has been noted that the majority of farmers (63.20%) engaged in livestock farming or animal husbandry activities. The Spearman correlation test showed that age, marital status, occupation, caste, and education are all positively and significantly (P < 0.01) linked with gender. Age and land ownership have a negative (P < 0.01) correlation with gender. This observation differs from the previous findings [9] since their study was conducted in a different location and the farmers were chosen on purpose. As a result, there is a clear contrast between this observation and prior findings.
4.1.2 Age
The data showed that the majority of farmers were in the 30–60 year age bracket, which is the most active age group (67.21%) and that they were most interested in raising goats. According to survey analysis, the percentage of young farmers, or those under 30 years old, was 26.00%, and the percentage of farmers over 60 years old was 6.79% (Table 1). The most active respondent groups were 67.25% in Birbhum, 66.98% in Nadia, 67.26% in Maldah, 67.26% in South Dinajpur, and 67.30% in the Murshidabad area. Age and occupation are highly and positively (P < 0.01) correlated factors, as are family income, education, and type of housing. Age has a negative (P < 0.01) correlation with marital status, religion, family size, and landholding. This result was consistent with previous studies [10, 11].
Characters
Category
Birbhum
Nadia
Malda
South dinajpur
Murshidabad
Overall
Chi-square value
(%)
(%)
(%)
(%)
(%)
(%)
Sex
Male
36.76
36.8
36.8
36.79
36.87
36.8
66.64**
Female
63.24
63.2
63.2
63.21
63.13
63.2
Age
Young group (up to 30 years)
25.98
26.15
26.02
25.95
25.88
26
94.92**
Most active group (30–60 years)
67.25
66.98
67.26
67.26
67.3
67.21
Elder group (above 60 years)
6.76
6.86
6.73
6.79
6.82
6.79
Religion
Hindu
91.37
45.92
50.51
88.93
23.99
61.96
160.44**
Muslim
8.63
54.08
49.49
11.07
76.01
38.04
Marital status
Married
87.65
87.57
87.56
87.62
87.63
87.61
182.49**
Unmarried
9.61
9.59
9.64
9.64
9.47
9.59
Widow/widower
2.75
2.84
2.79
2.74
2.9
2.8
Gross family income/month
Below Rs. 2000
38.04
46.04
12.06
17.98
43.94
32
145.83**
Rs. 2001–5000
41.96
29.94
59.9
47.98
30.05
41.87
Rs. 5001–10,000
14.02
17.99
18.02
24.05
14.02
17.5
Rs. 10,001 and above
5.98
6.04
10.03
10
11.99
8.63
Occupation
Labour
33.14
50.3
16.24
48.81
23.61
34.73
88.44**
Caste occupation
1.96
2.13
2.03
2.62
3.54
2.43
Migrants labour
11.57
13.25
13.96
13.57
18.31
13.98
Business
4.31
4.02
3.05
1.19
3.66
3.29
Service
4.02
3.2
7.11
2.02
7.83
4.74
Cultivation
45
27.1
57.61
31.79
43.06
40.84
Caste
General
65.39
37.51
53.43
48.33
14.27
44.9
102.94.**
Schedule caste
14.51
6.51
4.95
26.19
6.06
11.9
Schedule tribe
11.57
4.02
2.79
12.38
1.52
6.77
Other backward caste
8.53
51.95
38.83
37.98
78.16
41.31
Education of the respondent
Illiterate
0.98
2.01
5.96
6.19
4.04
3.69
117.28**
Can read only
20.59
6.04
4.06
17.98
11.62
12.51
Can read and write
28.04
9.94
25.89
18.1
16.67
20.02
Primary
15.69
15.74
35.91
13.69
20.33
19.88
Middle school
15.49
35.98
12.06
12.14
20.08
19.09
High school
9.71
22.37
4.06
21.9
17.93
15.08
Graduate
9.51
7.93
12.06
10
9.34
9.73
Family type
Nuclear family
51.96
15.98
39.34
21.79
9.97
28.87
171.19**
Joint family
48.04
84.02
60.66
78.21
90.03
71.13
Family size
Small
51.76
17.16
13.96
20.71
10.61
24.29
221.92**
Medium
48.24
82.84
86.04
76.9
89.39
75.24
House type
No house
5.98
6.51
10.03
4.52
6.06
6.56
202.94**
Hut
4.02
26.86
14.47
14.76
9.97
13.65
Kutcha house
25.98
25.33
33.12
35.6
27.27
29.29
Mixed house
59.51
35.27
33.5
39.05
49.12
44.01
Pucca house
1.96
1.3
4.82
4.05
4.29
3.2
Mansion
2.55
4.14
4.06
2.02
3.28
3.17
Land
No land/land less
16.47
35.98
15.99
22.02
44.95
26.58
105.84**
Up to 1 hectare
45.98
35.03
32.74
45
20.08
36.41
Up to 2 hectares
25.59
26.04
43.4
25
25
28.73
Above 2 hectares
11.96
2.37
7.87
7.98
9.97
8.17
Training received
Not received
15.78
12.9
14.09
18.57
17.93
15.85
89.96**
Received
84.22
87.1
85.91
81.43
82.07
84.15
Farm power
No drought animal
72.75
72.78
72.84
72.74
72.73
72.79
117.28**
1–2 drought animals
19.22
18.22
19.54
19.17
19.19
19.21
3–4 drought/1 or more prestige animal
4.8
5.33
4.82
4.76
4.8
4.81
5–6 Drought animals/tractors
3.14
3.2
3.17
3.21
3.16
3.2
Material possession
Bullock cart
30.78
30.77
30.84
30.83
30.81
30.81
145.83**
Cycle
96.27
96.21
96.32
96.31
95.45
96.27
Radio
34.22
34.2
34.26
34.29
34.22
34.26
Television
69.71
69.7
72.59
69.76
69.7
69.73
Table 1.
Demographic and socio-economic characteristics of farmers of aspirational districts of West Bengal (N = 5000).
**P < 0.01; *P < 0.05.
4.1.3 Religion
The findings showed that Hinduism is practiced by the majority of farmers (61.96%) (Table 1). Most respondents (91.37%) in Birbhum district, followed by South Dinajpur district (88.93%) and Maldah district (50.51%), were of the Hindu religion. Additionally, it was noted that the majority of respondents in the districts of Murshidabad (76.01%) and Nadia (54.08%) identified as Muslims. According to the chi-square test (Table 1), the observational difference between the various religions was statistically significant (P < 0.01). Due to the location of their studies, this observation differs from the previous findings [10, 12]. Additionally, because the farmers were chosen purposively, any differences or similarities between what has been observed and past results are clearly a natural occurrence.
4.1.4 Marital status
It is observed that altogether, 87.61% of respondents were married, compared to only 9.59% who were single and 2.80% who were widowed. Similar trends were seen in all of the districts. The findings indicated that the majority of respondents (87.65%) in the Birbhum district, followed by those in Murshidabad (87.63%), South Dinajpur (87.62%), Nadia (87.57%), and Maldah (87.56%), were married. According to the chi-square test (Table 1), the difference in observation of different marital statuses was statistically significant (P < 0.01). The majority of farmers were found to be older than 30 years old, therefore the present result of marital status was a natural occurrence in the study area.
4.1.5 Gross family income
According to the present study, the average farmer’s family income is between Rs. 2001 and Rs. 5000 per month, followed by 32% of respondents who earn less than Rs. 2000 per month and 17.50% of respondents who earn between Rs. 5001 and Rs. 10,000 per month. The results also showed that the income of farmers earning more than Rs. 10,001 is quite low (8.63%). In Maldah (59.60%), South Dinajpur (47.98%), and Birbhum district (41.96%), the majority of respondents belong to the monthly income group of Rs. 2001–5000, whereas in Nadia (46%), and Murshidabad district (44%) the majority of respondents belong to the monthly income group of below Rs. 2000. It had been noted that the majority of farmers in the districts of Maldah, South Dinajpur, and Birbhum were comparably more prosperous than those in the other two districts. The difference in value between the different monthly income groups of these farmers had a highly significant effect, according to the chi-square test (Table 1) (P < 0.01). Given that the majority of farmers (73.87%) had monthly incomes of less than Rs 5000, attention may be focused on helping these farmers to improve their financial situation. Numerous research conducted in this field revealed that the majority of farmers in rural India belonged to low-income categories. However, there are regional and individual differences in economic condition.
4.1.6 Occupation
The majority of farmers (40.84%) work primarily in agriculture, with the remainder working as labourers (34.73%) and migratory workers (13.98%). Aout 43.06% of respondents in Murshidabad district, 57.61% in Maldah district, and 45% in Birbhum district stated that their primary occupation was farming. 50.30% of respondents worked as labour in the Nadia district, while 48.81% did so in the South Dinajpur district. According to the results of the chi-square test (Table 1), there were statistically significant differences in the observations of the various occupations. While occupation is negatively correlated with family size, landholding, and training obtained (P < 0.01), it is positively correlated with education level, caste, family income, and house type (P < 0.05) (Table 2). This observation differs with previous studies [13, 14] which may have had a smaller sample size. Such findings were also made by some previous studies [10, 11, 15]. Due to their lower annual income of Rs. 30,000, the farmers’ ability to support themselves was at risk, so it was imperative to find an alternative arrangement. The key aim of the policy-making authorities is to take concrete action in this regard while also ensuring the living conditions of these farmers and inclusive growth for them.
Sex
Age
Marital status
Religion
Occupation
Education Status
Caste
Family type
Family size
family income
Land holding
Training
House type
Sex
1
−0.248**
0.356**
0.111
0.280**
0.361**
0.171**
−0.054
−0.065
0.002
−0.239**
0.003
0.082
Age
1
−0.375**
−0.278**
0.336**
−0.187*
0.132
−0.009
−0.257**
0.179**
−0.307**
0.344**
0.174**
Marital status
1
0.405**
0.011
0.323**
0.182*
0.229**
−0.154
0.308**
0.073
0.064
−0.167
Religion
1
−0.077
0.083
0.069
0.566**
−0.023
0.321**
0.122**
0.119**
−0.098**
Occupation
1
0.832**
0.590**
0.055
−0.373**
0.451**
−0.599**
−0.212**
0.127*
Education status
1
0.530**
0.012
0.010
0.118
−0.125*
0.014
0.107
Caste
1
0.054
0.089
0.112**
−0.265**
0.017
0.109
Family type
1
−0.510
0.455**
0.077
0.089
−0.211**
Family size
1
−0.326**
0.476**
−0.117**
0.389
Family income
1
−0.180**
0.128*
0.086
Land holding
1
−0.054
−0.079
Training
1
0.509
House type
1
Table 2.
Spearman correlation coefficient of socio-economic characteristics of the farmers of aspirational districts of West Bengal (N = 5000).
**P < 0.01. *P < 0.05.
4.1.7 Caste
According to the observations, the majority of farmers belong to General Caste (44.9%), followed by OBC (41.31%) and Scheduled Caste (11.9%), only (6.77%) of farmers are ST (Table 1). The majority of respondents in the districts of Birbhum (65.39%), Maldah (53.43%), and South Dinajpur (48.33%) fell into the general category. In contrast, 51.95% of respondents in the Nadia district and 78.16% of respondents in the Murshidabad district identified as OBC. According to the results of the chi-square test (Table 1), there were statistically significant differences in the observations of the various castes. The results of this study are consistent with some previous studies [10, 12] but they are not consistent with other studies [16], who also claimed that the SC prefers the general trend of goat farming, which may be related to the location of their study.
4.1.8 Educational level
The study of the data showed that only 9.73% of farmers received graduation degree, whereas the majority of farmers can read and write (20.02%), have completed elementary school (19.88%), and middle school (19.09%) (Table 1). The findings (Table 1) showed that the majority of respondents (28.04%) in the Birbhum district can read and write. Among the sample respondents in the study area, the majority of respondents in the Nadia district (52%) had completed middle school, the majority in the Maldah district (35.91%) had completed primary level, the majority in the South Dinajpur district (21.90%) had completed high school, and the majority in the Murshidabad district (20.08%) had completed middle school. According to the results of the chi-square test (Table 1), there were statistically significant differences in the observations of people with different levels of education. Farmers’ education levels have a 0.01 significance level positive correlation with caste and a 0.05 significance level negative correlation with land ownership (Table 2). This study’s majority of farmers (62.8%) had lower educational levels, which is a rather clear finding. Previous studies [10, 12] have noted also a similar tendency. However, some studies [16] have made a different observation, which may have been caused by a different sample size and location.
4.1.9 Family type
Analysis of the data showed that only 28.87% of the farmers were from nuclear families, whereas the majority of farmers (71.13%) came from joint families (Table 1). Most families with their entire family reside together in the village area. 90.03% of respondents in the Murshidabad district, 84.02% in the Nadia district, 78.21% in the South Dinajpur district, and 60.66% in the Maldah district belonged to a mixed family. However, the majority of responders (51.96%) came from nuclear families exclusively in the Birbhum district. The variation is extremely significant, according to the chi-square test (P < 0.01) (Table 1). It appears that family type has a 0.01 significance level of negative correlation with housing type but a 0.01 significance level of positive correlation with family income (Table 2). The results show that many economically active joint family members were eager to share more money from raising animals because these activities can support their living as a secondary source of income. Due to larger landholdings and alternative occupations, the annual family income for farmers in joint families is higher than for those in nuclear families overall. The results of previous studies [10, 17] are very similar to the findings of this study.
4.1.10 Family size
In the present study, it was found that 75.24% of farmers had families with a medium size. The remaining farmers (24.29%) had small family sizes. The majority of respondents had medium-sized families in Murshidabad (89.39%), Maldah (86.04%), Nadia (82.84%), and South Dinajpur district (76.90%). Only in Birbhum district (51.76%), most respondents have small families. The difference in value between the varied family sizes of these farmers had a highly significant effect, according to the chi-square test (Table 1) (P < 0.01).
4.1.11 House types
According to the comprehensive observations, the majority of the farmer’s houses were mixed houses (44.01%), followed by kutcha houses (29.59%), and pucca homes (3.20%) (Table 1). In every district, the pattern is consistent. Mixed-house respondents were found in Birbhum district 59.51%, Murshidabad district 49.12%, South Dinajpur district 39.05%, Nadia district 35.27%, and Maldah district 33.50%. The chi-square test (Table 1) demonstrated that the variation in value between the various housing types for these farmers had a highly significant effect (P < 0.01). Given that this is the most common circumstance in rural West Bengal, these results are consistent with other studies [12].
4.1.12 Landholding
The study of the data showed that the majority of farmers (36.41%) had land that was up to 1 hectare in size, while 28.73% had land that was up to 2 hectares, 26.58% had no land, and just 8.17% had land that was beyond 2 hectares. In the districts of Birbhum and South Dinajpur, respectively, 45.78% and 45% of respondents own up to one hectare of land. 43.40% of respondents in the Maldah district have land holdings of up to 2 hectares. While landless farmers predominated (36% of the population) in the districts of Murshidabad (44.95%) and Nadia (35.98%), respectively. The chi-square test revealed that the variation in these farmers’ landholding capacities had a highly significant impact (P < 0.01). The majority of farmers (62.99%) were found to be either landless or marginal, which offers some hope that they will make enough effort to enhance livestock farming and secure their livelihood. These results were supported by previous findings [12]. Different opinions may exist in this regard, which may be caused by the impact of different regions.
4.1.13 Training
According to the present study, the majority of farmers (84.15%) had received training in animal husbandry, with only 15.85% of farmers receiving no such training (Table 1). According to the results of the chi-square test, the variations are statistically significant (P < 0.01) (Table 1). Giving training is an important strategy to help the agricultural community find alternative sources of income, as seen in the present study, where training obtained was positively correlated with age and religion at the 0.01 significance level (Table 2), as well as with family income at P < 0.05 level (Table 2). It was evident in the present survey that livestock can help farmers make a living.
4.1.14 Farm power
The analysis of the data showed that the majority of farmers (72.79%) did not have any drought animals, while 19.21% of farmers did have one or two (Table 1). The majority of respondents in Birbhum (72.75%), Nadia (72.78%), Maldah (72.84%), South Dinajpur (72.74%), and Murshidabad district (72.73%) had no drought animals, while only a small percentage had one or two drought animals. According to the chi-square test (Table 1), the farmers’ varying farm power values had a very significant impact (P < 0.01).
4.1.15 Material possession
In the present study, it was found that 69.73% of farmers had televisions in their homes, with the majority of farmers (96.27%) having their own cycles(Table 1). In the Birbhum district, 96.27% of respondents stated having access to a cycle, while 69.71% reported having television and 34.22% having radio. In the Nadia district, 96.21% of participants answered owning a cycle, while 69.70% noted owning a television and 34.20% claimed owning a radio. In the Maldah district, 96.32% of respondents stated owning a cycle, while 72.59% reported owning a television and 34.26% reported owning a radio. In the South Dinajpur district, 96.31% of respondents stated owning a cycle, while 69.76% claimed owning a television and 34.29% claimed owning a radio. In the Murshidabad district, 95.45% of respondents stated owning a cycle, while 69.70% stated owning a television and 34.22% stated owning a radio. According to the chi-square test (Table 1), these farmers’ disparate material possessions had a highly significant impact (P < 0.01).
4.2 Socio-economic status
Table 3 has summarised the analysis of the 5000 livestock farmers’ economic conditions in West Bengal’s five aspirational districts (Nadia, Murshidabad, Birbhum, Maldah, and Dakshin Dinajpur). Additionally, analysis of variance was performed too to determine the effects of the kind of dwelling, ownership of land, employment, and training in animal husbandry techniques. According to the survey, farmers with larger landholdings have considerably (P < 0.01) higher monthly family incomes from agriculture, animal husbandry, and other sources (service/business) than those with smaller landholdings. According to the survey, farmers with mixed-house types, pucca houses, or mansions make significantly (P < 0.01) more money from agriculture, animal husbandry, or other sources (service/business) for their families than those with no homes or kutcha houses. Farmers with mansions make an average monthly income of Rs. 10,398.15, compared to Rs. 3123.84 for farmers without homes. It demonstrates that those with superior economic returns also possess better material goods. An important factor that affects the farmer’s financial growth is training. When compared to those who received no training, the agricultural community’s economic returns were considerably (P < 0.01) higher. Another significant factor that affects the farmer’s economic growth is the farmer’s occupation (Table 4). When compared to those who work in agriculture (Rs. 6849.30), the service sector (Rs. 11,004.85), the business sector (Rs. 7900.36), or as labour (Rs. 3123.84), people who are employed in these occupations are thought to have greater total monthly incomes (P < 0.01) (Table 5).
Different factors
From agriculture (Rs)
From animal husbandry (Rs)
From other (service/businesses) (Rs)
Total income (Rs)
Overall
2024.95 ± 16.05
971.98 ± 12.36
4059.62 ± 12.66
7056.55 ± 13.63
Districts
Birbhum
2240.52 ± 19.23
1075.45 ± 14.81
4055.34 ± 15.70
7371.31 ± 16.91
Nadia
2018.09 ± 15.88
968.68 ± 12.22
4237.99 ± 12.41
7224.76 ± 13.36
Maldah
2026.23 ± 16.148
972.59 ± 12.46
3849.84 ± 12.91
6848.66 ± 13.91
South Dinajpur
1857.67 ± 13.13
891.68 ± 10.11
4086.87 ± 6.59
6836.23 ± 7.09
Murshidabad
1930.79 ± 13.74
926.78 ± 10.58
4054.66 ± 10.38
6912.23 ± 11.18
Sex
Male
2260.19 ± 19.54
1068.20 15.05
4949.50 ± 15.95
7311.29 ± 17.18
Female
1698.09 ± 4.69
866.02 ± 3.61
2884.22 ± 4.00
5448.33 ± 4.31
Age
Young group (up to 30 years)
2046.49 ± 17.10
982.32 ± 13.16
3849.84 ± 13.67
6878.65 ± 14.72
Most active group (30–60 years)
2285.33 ± 19.85
1290.54 ± 15.28
4866.41 ± 16.61
8442.28 ± 17.89
Elder group (above 60 years)
1977.73 ± 15.26
949.31 ± 11.75
4153.23 ± 11.90
7080.26 ± 12.82
Religion
Hindu
2228.85 ± 18.93
1069.85 ± 14.58
4234.82 ± 15.44
7533.53 ± 16.63
Muslim
1671.90 ± 4.33
802.51 ± 3.33
3678.18 ± 23.95
6152.60 ± 25.80
Marital status
Married
2127.54 ± 17.71
1021.22 ± 13.63
4042.33 ± 14.43
7191.09 ± 15.54
Unmarried
1996.30 ± 15.57
537.73 ± 11.99
3613.31 ± 12.15
6147.34 ± 13.09
Widow/widower
1836.46 ± 12.82
910.56 ± 9.87
3178.49 ± 4.26
5925.51 ± 4.59
Family type
Nuclear family
1467.56 ± 3.72
749.01 ± 2.86
4495.56 ± 3.09
6712.13 ± 3.32
Joint family
2431.48 ± 20.15
1167.11 ± 15.52
4234.82 ± 16.89
7833.41 ± 18.19
Education
Illiterate
2041.58 ± 16.79
873.85 ± 12.93
2615.60 ± 13.42
5531.02 ± 14.45
Farmers’ education up to middle school (class 10)
2107.28 ± 17.40
1069.85 ± 13.40
3926.84 ± 14.18
7103.97 ± 15.27
Farmers’ education more than middle school (class 10)
1931.98 ± 14.44
980.85 ± 11.12
7356.37 ± 11.14
10269.19 ± 12.00
Training
Training received
2191.86 ± 18.62
1052.09 ± 14.34
4471.04 ± 15.19
7714.99 ± 16.36
Training not received
1702.03 ± 5.73
719.72 ± 4.41
4311.82 ± 5.55 (3606)
6733.57 ± 5.98 (3606)
Occupation
Labour
598.77 ± 2.41
480.85
2054.22
3123.84
Caste occupation
1655.25 ± 3.95
840.12 ± 3.04
5002.28 ± 6.65 (1040)
7497.65 ± 7.17 (1040)
Migrants labour
1702.03 ± 5.13
719.72 ± 3.95
4311.82 ± 3.59
6733.57 ± 3.87
Business
1902.86 ± 13.43
849.19 ± 10.34
5148.31 ± 14.20
7900.36 ± 15.30
Service
1931.98 ± 14.35
980.85 ± 11.05
8092.02 ± 10.89
11004.85 ± 11.72
Cultivation
2105.62 ± 17.13
1055.14 ± 13.19
3688.54 ± 13.92 (1750)
6849.30 ± 15.00 (1750)
Caste
General
2155.15 ± 18.01
1040.72 ± 13.87
5002.28 ± 14.68 (1924)
8198.15 ± 15.82 (1924)
Schedule caste
1958.33 ± 14.65
719.72 ± 11.28
4311.82 ± 11.39
6989.87 ± 12.27
Schedule tribe
1722.12 ± 6.70
934.18 ± 5.16
3533.11 ± 11.98
6189.41 ± 12.90
Other backward caste
1731.68 ± 8.02
880.48 ± 6.18
4865.17 ± 4.75
7477.33 ± 5.11
House Type
No house
588.77 ± 2.20
480.85 ± 1.69
2054.22 ± 2.22
3123.84 ± 2.40
Hut
1805.62 ± 12.52
905.14 ± 9.64
2988.75 ± 3.89
5699.51 ± 4.19
Kutcha house
1958.33 ± 14.96
719.72 ± 11.52
4001.82 ± 11.65
6679.87 ± 12.54
Mixed house
1722.12 ± 7.94
934.18 ± 6.11
3533.11 ± 28.40
6189.41 ± 30.59
Pucca house
1931.47 ± 14.04
988.25 ± 10.81
5837.17 ± 10.63
8756.89 ± 11.45
Mansion
2155.15 ± 18.32
1040.72 ± 14.11
7202.28 ± 14.94
10398.15 ± 16.09
Land Holding
No land/land less
1029.25 ± 2.68
719.72 ± 2.07
3012.21 ± 1.99
4761.17 ± 2.15
Up to 1 hectare
1698.24 ± 4.83
934.18 ± 3.72
3533.11 ± 3.28
6165.53 ± 3.53
Up to 2 hectares
2031.45 ± 16.49
1018.25 ± 12.69
5837.17 ± 13.17
8886.87 ± 14.18
Above 2 hectares
2550 ± 20.4
1040.72 ± 15.75
6801.128 ± 17.17
10391.85 ± 18.49
Table 3.
Monthly economic return (in rupees) (Mean ± SEM) of the farmers of aspirational districts of West Bengal (N = 5000).
SOV
df
From agriculture
From animal husbandry
From other (service/businesses)
Total income
From agriculture
From animal husbandry
From other (service/businesses)
Total income
Mean square
F value
Sex
1
26.8
44.8
62.7
44.8
1.14
1.62
5.56**
1.14
Age
2
81.1
57.9
46.2
51.8
3.32
1.12
4.10*
1.32
Religion
1
68.8
56.7
23.5
47.6
2.89
1.81
1.99
1.21
Marital status
2
78.2
39.5
125.9
81.13
3.64*
1.03
11.87**
2.76
Family type
1
96.7
67.5
109.3
117.4
6.98**
2.84
9.70**
2.99
Education
2
55.9
78.6
158.4
104.9
2.52
2.48
17.38**
2.67
Training
1
63.7
187.43
197.0
142.29
2.54
6.89**
14.89**
3.66*
Occupation
5
164.3
93.7
233.5
169.7
5.10*
3.05
29.55**
4.02**
Caste
3
66.4
38.7
22.1
32.21
1. 49
1. 80
1.79
0.87
House Type
5
89.34
88.71
212.31
133.3
3.97*
3.14*
19.51**
3.39*
Land Holding
3
761.6
167.32
81.4
310.5
28.52**
6.40**
7.35**
7.90**
Error
5424
32.654
29.576
13.026
28.226
Table 4.
ANOVA of monthly economic return of different category of the farmers under aspirational districts of West Bengal.
**P < 0.01; *P < 0.05.
Category
Different factors
Adoption index
Adoption level (%)
(Mean ± SEM)
Low
Medium
High
Chi square value
(<5.00)
(>5.00–6.5)
(>6.5)
Overall
5.95 ± 1.05
58.35
32.80
8.85
72.14**
Districts
Birbhum
5.57 ± 0.93
62.10
28.30
9.60
60.44**
Nadia
5.20 ± 1.16
57.86
31.46
10.67
Maldah
6.02 ± 1.01
60.66
29.37
9.96
South Dinajpur
6.07 ± 0.99
46.97
39.60
13.43
Murshidabad
6.01 ± 1.03
54.08
34.29
11.63
Age
Young group (up to 30 years)
6.09 ± 0.92
52.71
35.31
11.98
82.49**
Most active group (30–60 years)
5.90 ± 1.03
56.45
32.52
11.03
Elder group (above 60 years)
5.88 ± 0.93
55.07
33.55
11.38
Religion
Hindu
5.86 ± 1.01
58.28
31.15
10.57
75.33**
Muslim
5.12 ± 1.13
57.83
31.49
10.68
Marital Status
Married
5.41 ± 0.96
58.67
30.86
10.47
64.84**
Unmarried
5.19 ± 1.05
60.35
29.61
10.04
Widow/widower
5.45 ± 1.28
58.36
31.09
10.55
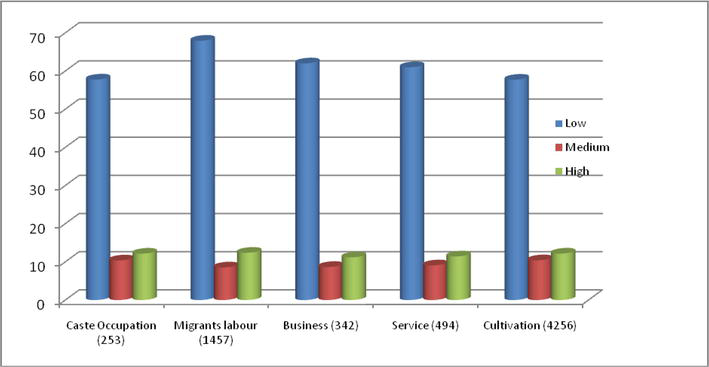
Occupation
Labour
5.99 ± 0.72
46.59
39.88
13.53
68.94**
Caste occupation
5.06 ± 1.00
61.34
28.87
9.79
Migrants labour
5.46 ± 0.98
56.95
38.40
4.65
Business
5.04 ± 1.10
61.49
28.75
9.75
Independent
5.55 ± 0.89
57.60
31.66
10.74
Cultivation
5.95 ± 1.09
62.18
28.24
9.58
Caste
General
5.82 ± 1.02
58.59
30.92
10.49
67.28**
Schedule caste
5.52 ± 0.97
57.83
31.49
10.68
Schedule tribe
5.37 ± 0.88
58.97
30.64
10.39
Other backward caste
4.74 ± 1.06
63.78
27.04
9.17
Education of the farmers
Illiterate
5.04 ± 1.05
61.49
28.75
9.75
74.44**
Can read only
5.29 ± 1.02
59.58
30.18
10.24
Can read and write
5.41 ± 1.06
58.67
30.86
10.47
Primary
5.72 ± 1.02
56.30
32.63
11.07
Middle school
5.85 ± 1.04
55.30
33.37
11.32
High school
6.09 ± 0.86
53.47
34.74
11.79
Graduate
6.22 ± 1.12
60.12
29.78
10.10
Family type
Nuclear family
5.85 ± 1.12
55.33
33.35
11.31
104.22**
Joint family
5.96 ± 1.06
49.97
37.36
12.67
Family Size
Small
5.66 ± 0.99
47.17
39.45
13.38
79.94**
Medium
5.59 ± 1.00
47.82
38.96
13.22
Large
5.57 ± 1.11
48.01
38.82
13.17
House Type
No house
5.49 ± 0.97
42.22
43.14
14.63
47.84**
Hut
5.72 ± 0.92
43.81
41.96
14.23
Kutcha house
5.55 ± 1.08
48.20
38.68
13.12
Mixed house
6.02 ± 1.01
43.81
41.96
14.23
Pucca house
6.09 ± 0.87
43.16
42.44
14.40
Mansion
5.32 ± 1.04
50.34
37.08
12.58
Land Holding
No land/land less
5.54 ± 1.07
48.29
38.61
13.10
77.74**
Up to 1 hectare
5.92 ± 1.09 (1560)
44.74
41.26
14.00
Up to 2 hectares
6.45 ± 1.09
39.77
44.97
15.26
Above 2 hectares
7.63 ± 0.92
34.35
49.02
16.63
Training
Training received
7.89 ± 1.08
42.24
39.82
17.94
87.22**
Training not received
5.42 ± 1.01
56.95
38.40
4.65
Table 5.
Adoption index (mean ± SEM) and adoption level of the farmers of aspirational districts of West Bengal (N = 5000).
**P < 0.01; *P < 0.05.
4.3 Adoption level of the farmers in the aspirational districts
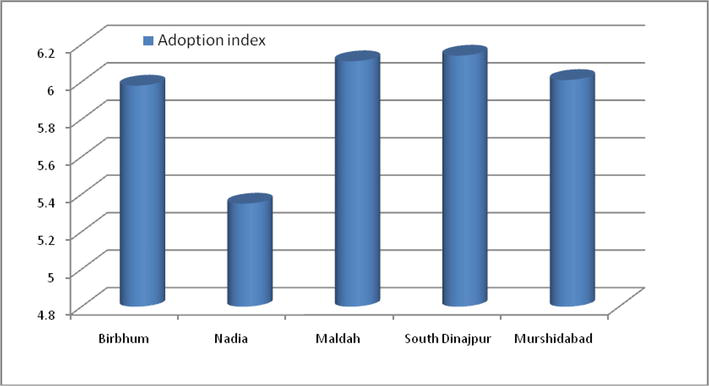
4.3.1 Adoption index of the farmers in the aspirational districts
With regard to improved farm practices of animal husbandry, such as vaccination against contagious diseases, cultivation of green fodder, deworming for parasitic disease, feeding of concentrate mixture, feeding of green fodder, feeding of urea and molasses treated straw, feeding of colostrum to new-born kid, castration by bradizzo castrator, value addition of milk and meat, Adoption Index (mean and standard error of mean [SEM]) [18] has been generated among the farmers in the Aspirational Districts of West Bengal. Analysis of variance in respect of gender, age of the farmers, religion, marital status, occupation, caste, education, family type, family size, house type, training received, and land-holding capacities have been assessed and depicted in Table 6.
SOV
df
Mean square from
F value
Sex
1
10.92
1.16
Age
2
8.07
0.86
Religion
1
10.13
1.07
Marital status
2
15.00
1.59
Family type
1
12.98
1.38
Education
2
44.49
4.72**
Training
1
130.51
13.84**
Occupation
5
43.54
4.62**
Caste
3
18.05
1.91
House type
5
15.28
1.62
Land holding
3
40.83
4.33**
Error
4254
9.43
Table 6.
ANOVA of adoption index of different category of the farmers of aspirational districts of West Bengal.
**P < 0.01; *P < 0.05.
It had been observed that education, training received, occupation and landholding had highly (P < 0.01) significant effect on adoption index. It had been appeared that adoption index among the farmers of South Dinajpur district (6.14 ± 0.99) was significantly higher than the other four districts namely Maldah (6.11 ± 1.01), Murshidabad (6.01 ± 1.03), Birbhum (5.98 ± 0.93), and Nadia (5.35 ± 1.16). The result indicated that the farmers of South Dinajpur district were more adapted to improved animal husbandry practices. The farmers who were graduate or had higher educational degree were having significantly (P < 0.01) higher adoption index (7.41 ± 1.09) in comparison to those with lower educational level. Similarly, who were worked as labour and engaged in cultivation having significantly (P < 0.01) higher adoption index than other occupations.
Farmers, who had received training, were significantly (P < 0.01) higher adoption index (8.65 ± 1.06) in comparison to those who had not received any training (6.54 ± 1.08). It was clear that the farmers who had received training were more familiar with new methods of animal husbandry. These farmers, therefore, favored the deployment of improved technology. The adoption of more advanced technologies was chosen by the farmers in terms of land-holding patterns.
The adoption index of farmers with land holdings larger than 2 acres was considerably (P < 0.01) higher (8.35 ± 0.93) than that of landless (6.34 ± 1.02), marginal (7.81 ± 1.07), and small farmers (6.89 ± 1.06) groups in the study. Farmers with land, especially agricultural land larger than 2 acres, preferred to raise animals as a form of secondary income. Their ability to raise livestock scientifically required improved technology, which is why the adoption rate was comparatively higher. Other variables like age, religion, education, caste, marital status, family size, and type of housing had no significant impact on those farmers’ adoption rates.
4.3.2 Adoption level of the farmers in the aspirational districts
A major indicator of how important the improved technology was to these farmers was the adoption rate. The value was shown in Table 5 and the adoption level was divided into three categories: low, medium, and high. In comparison to the other four districts, it was found that the majority of farmers in Birbhum district (67.07%) had a larger percentage of low adoption levels. Unmarried person engaged in cultivation (66.27%) were also having higher frequency of low-level adoption in comparison to married person (64.45%). Farmers of other backward caste were having higher frequency of low level of adoption (67.46%) in relation to other caste (General caste 62.35%). Illiterate (67.25%) persons were also having higher frequency of low-level adoption in comparison to higher educated persons (65.37%).
The chi-square test (Table 5) found that the difference in value in adoption level of these farmers based on different category had a highly significant effect (P < 0.01). The adoption of technology by mainly small and marginal farmers in the underdeveloped districts (Aspirational Districts) of West Bengal was the prime focus of the present study. The result had showed low level of adoption among these farmers who indicated their lacking in application of improved animal husbandry practices. The present study conducted mainly with small and marginal farmers in the underdeveloped districts (Aspirational Districts) of West Bengal.
4.3.3 Relationship between independent variables with adoption level of farmers in the aspirational districts
Table 7 provides the correlation coefficients for each personal and socio-economic characteristic with the respondents’ adoption level. Overall, it was found that seven independent variables—religions, occupations, education, family type, house type, land holding, and training—showed highly significant correlation (P < 0.01) with the adoption level of farmers in five Aspirational Districts in West Bengal. Caste, however, showed a significant correlation with this variable at the 0.05 level of probability. The adoption rate of farmers in five aspirational districts in West Bengal was not significantly correlated with the other three variables, district, age, or marital status. Marital status had a negative correlation with adoption index, but it was not statistically significant.
Factors
Districts
Age
Religion
Marital status
Occupation
Caste
Education of the farm ers
Family type
Training
House type
Land holding
Adoption index
Districts
1.00
−0.158*
0.142*
−0.640**
0.383**
0.301**
−0.628**
0.08
0.09
0.234**
−0.12
0.10
Age
1.00
0.01
0.164**
−0.11
−0.396**
0.150*
0.12
0.11
−0.03
0.10
0.07
Religion
1.00
−0.269**
0.403**
0.127*
0.333**
0.418**
0.11
−0.07
0.03
0.362**
Marital status
1.00
−0.358**
−0.223**
0.528**
−0.12
0.10
−0.218**
0.317**
−0.06
Occupation
1.00
0.444**
0.01
0.353**
0.245**
−0.01
0.353**
0.440**
Caste
1.00
−0.153*
0.07
−0.08
0.07
0.203**
0.162*
Education of the farmer
1.00
0.267**
0.41**
−0.337**
0.401**
0.273**
Family type
1.00
0.11
0.06
0.125*
0.356**
Training
1.00
−0.05
0.248**
0.256**
House type
1.00
−0.323**
−0.269**
Land holding
1.00
0.373**
Adoption index
1.00
Table 7.
Spearman correlation of adoption index with different factors among the farmers of aspirational districts of West Bengal (N = 5000).
**P < 0.01; *P < 0.05.
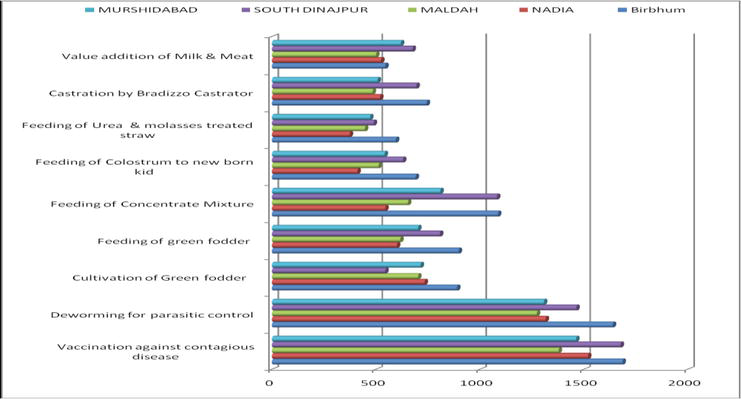
4.3.4 Adoption level of different technologies among the farmers in the aspirational districts
Adoption level of different technologies is depicted here (Table 8 and Figure 2). Hence in future days, comprehensive farmers’ trainings and awareness programmes need to be generated for improvement of their livelihood through livestock rearing. In South Dinajpur vaccination (82.14%) had highest adoption level followed by Murshidabad district (75.96%) and Nadia districts (73.97%), Maldah (71.97%) and Birbhum (67.68%). Cultivation of Green fodder adoption level have higher frequency in Murshidabad (37.12%) in comparison to other districts namely Maldah (36.69%), Birbhum (35.73%), Nadia (35.72%), and South Dinajpur (26.69%). Value addition of Milk and Meat frequency have higher adoption level in South Dinajpur Districts (33.10%) followed by Murshidabad (32.19%), Maldah (26.15%), Nadia (25.55%), and Birbhum (21.88%) (Figure 3).
Category
Birbhum
Nadia
Maldah
South Dinajpur
Murshidabad
Overall
(%)
(%)
(%)
(%)
(%)
(%)
Vaccination against contagious disease
67.94
73.96
71.95
82.14
76.01
74.14
Deworming for parasitic control
66.08
64.02
66.5
71.67
67.93
67.19
Cultivation of green fodder
35.88
35.74
36.68
26.67
37.12
34.42
Feeding of green fodder
36.18
29.23
32.23
39.52
36.49
34.8
Feeding of concentrate mixture
43.82
26.51
34.14
52.98
42.05
40.09
Feeding of colostrum to newborn kid
27.84
20
26.78
30.83
28.16
26.74
Feeding of urea and molasses treated straw
24.02
18.22
23.35
23.93
24.49
22.82
Castration by bradizzo castrator
30
25.33
25.13
34.05
26.39
28.31
Value addition of milk and meat
21.96
25.56
26.14
33.1
32.2
27.51
Table 8.
Adoption of different technologies among the farmers of aspirational districts of West Bengal (N = 5000).
Figure 2.
Adoption index among the farmers of different aspirational districts (developed by the authors).
Figure 3.
Adoption of different technologies among the farmers of aspirational districts of West Bengal (developed by the authors).
4.4 Knowledge level of the farmers in the aspirational districts
4.4.1 Knowledge index of the farmers in the aspirational districts
Knowledge Score (Mean and SEM) generated using standard practice [19] among the farmers in the Aspirational Districts of West Bengal in relation to improved farm practices of animal husbandry had been depicted in Table 9. Table 10 shows the analysis of variance by religion, age of the farmers, marital status, caste, occupation, and education of the farmers, as well as by family size, family type, land holding capacities, and house type. All the factors, including districts, marital status, age of the farmers, occupation, religion, caste, education, family type, house type, family size, and land holding capacities, had not been shown to have a significant impact on knowledge scores (Table 10). However, it showed that South Dinajpur had the lowest Knowledge Score (30.16 ± 3.03) and Nadia district had the highest knowledge score (37.37 ± 3.55) among farmers, compared to Birbhum (35.07 ± 2.85), Maldah (34.18 ± 3.09), and Murshidabad (33.51 ± 3.15).
Category
Different factors
Knowledge score
Knowledge level (%)
(Mean ± SEM)
Low
Medium
High
Chi square value
(<30.00)
(>30.00–35)
(>35)
Overall
34.98 ± 3.22
59.15
31.75
9.10
64.14**
Districts
Birbhum
35.07 ± 2.85
62.10
28.30
9.60
62.85**
Nadia
37.37 ± 3.55
57.86
30.00
12.00
Maldah
34.18 ± 3.09
60.00
30.00
9.96
South Dinajpur
30.16 ± 3.03
48.00
39.60
12.00
Murshidabad
33.51 ± 3.15
54.08
34.29
11.63
Age
Young group (up to 30 years)
34.09 ± 2.82
53.29
34.88
11.83
104.33**
Most active group (30–60 years)
33.85 ± 3.15
53.66
34.60
11.74
Elder group (above 60 years)
34.28 ± 2.85
53.03
35.08
11.90
Religion
Hindu
34.78 ± 3.09
52.34
35.59
12.07
74.28**
Muslim
33.45 ± 3.46
54.16
34.23
11.61
Marital status
Married
32.89 ± 2.94
54.93
33.65
11.42
57.58**
Unmarried
33.45 ± 3.21
54.16
34.23
11.61
Widow/widower
34.74 ± 3.92
52.40
35.55
12.06
Occupation
Labour
33.97 ± 2.20
53.45
34.76
11.79
59.66**
Caste occupation
35.01 ± 3.06
52.03
35.82
12.15
Migrants labour
33.63 ± 3.00
61.18
26.46
12.37
Business
32.22 ± 3.37
55.85
32.97
11.18
Independent
34.08 ± 2.72
53.30
34.87
11.83
Cultivation
35.04 ± 3.34
51.98
35.85
12.16
Caste
General
34.85 ± 3.12
52.25
35.66
12.10
64.65**
Schedule caste
33.36 ± 2.97
54.29
34.13
11.58
Schedule tribe
32.98 ± 2.69
54.81
33.75
11.45
Other backward caste
35.19 ± 3.24
51.78
36.01
12.21
Education of the farmers
Illiterate
35.55 ± 3.21
51.29
36.37
12.34
58.36**
Can read only
33.61 ± 3.12
53.94
34.39
11.67
Can read and write
33.65 ± 3.24
53.89
34.43
11.68
Primary
33.07 ± 3.12
54.68
33.84
11.48
Middle school
33.76 ± 3.18
53.74
34.54
11.72
High school
34.03 ± 2.63
53.37
34.82
11.81
Graduate
36.2 ± 3.43
50.40
37.04
12.56
Family type
Nuclear family
33.75 ± 3.43
53.75
34.53
11.71
98.25**
Joint family
35.1 ± 3.24
53.27
34.89
11.84
Family size
Small
33.77 ± 3.03
60.28
29.85
9.87
58.22**
Medium
35.45 ± 3.06
54.16
34.23
11.61
House type
No house
33.28 ± 3.40
54.40
34.05
11.55
44.22**
Hut
33.65 ± 2.97
53.89
34.43
11.68
Kutcha house
34.06 ± 2.82
53.33
34.85
11.82
Mixed house
34.77 ± 3.30
52.35
35.58
12.07
Pucca house
36.5 ± 3.09
49.98
37.35
12.67
Mansion
37.1 ± 2.66
49.16
37.96
12.88
Land holding
No land/land less
33.36 ± 3.18
54.29
34.13
11.58
47.64**
Up to 1 hectare
34.52 ± 3.27
52.70
35.32
11.98
Up to 2 hectares
36.02 ± 3.34
51.88
35.93
12.19
Above 2 hectares
36.24 ± 3.34
50.34
37.08
12.58
Training
Training received
33.21 ± 2.82
62.10
28.30
9.60
45.88**
Training not received
37.07 ± 3.30
52.71
35.31
11.98
Table 9.
Knowledge score (mean ± SEM) and knowledge level of the farmers of aspirational districts of West Bengal (N = 5000).
**P < 0.01; *P < 0.05.
SOV
df
Mean square from
F value
Sex
1
12.96
1.13
Age
2
12.42
1.08
Religion
1
20.03
1.75
Marital status
2
41.40
3.62
Family type
1
8.44
0.74
Education
2
26.64
2.33
Training
1
5.19
0.45
Occupation
5
12.76
1.11
Caste
3
26.15
2.28
House type
5
25.37
2.22
Land holding
3
27.01
2.36
Error
4254
11.45
Table 10.
ANOVA of knowledge score of different category of the farmers of aspirational districts of West Bengal.
**P < 0.01 *P < 0.05.
The findings suggested that farmers in the Nadia district knew more about modern methods of animal husbandry. More intriguingly, it was found that farmers with agricultural land holdings larger than 2 acres (36.24 ± 3.34), and Pucca Houses (36.5 ± 3.09), or mansions (37.1 ± 2.66), had higher knowledge level about animal husbandry. These results were regarded as a natural phenomenon of a higher knowledge score since they considered modern technology. Farmers who had land, especially agricultural land area larger than 2 acres, and were financially stable, preferred raising animals as a source of additional family income. Improved technology for raising livestock scientifically is crucial for increasing economic gain, because of that their Knowledge Score was comparatively higher. The Knowledge Score of those farmers was unaffected by other variables such as age, religion, occupation, education, caste, marital status, family size, or type of housing.
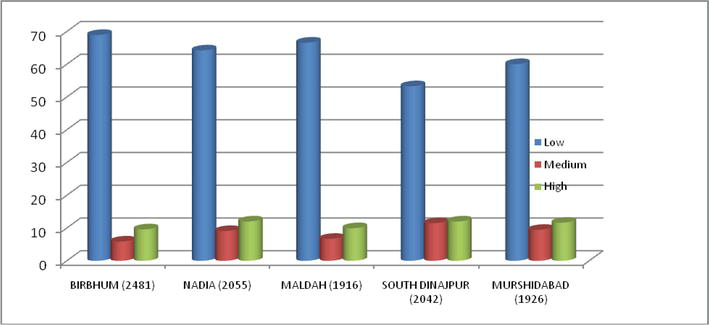
4.4.2 Knowledge level of the farmers in the aspirational districts
Level of knowledge (Table 9) is an important factor to assess utilisation of the improved technology among farmers. The farmers engaged in livestock farming were classified into three level of knowledge namely low (<30), medium (>30 –35), and high (>35). The result of knowledge level of these three groups namely low, medium, and high and the value was depicted in Table 9.
It had been observed that majority of farmers in Birbhum district (62.10%) were having a higher percentage of low knowledge levels in comparison to other four districts. In Nadia districts (57.86%) farmers had low level of knowledge followed by medium (30%) and high (12%) level of knowledge in improved livestock farming practices. In Maldah district (60%) farmers had low level of knowledge followed by medium (30%) and high (9.96%) level of knowledge in improved livestock farming practices. Most interestingly, the farmers of South Dinajpur district had less low level of knowledge (48%) but higher medium (39.60%) and high (12%) level of knowledge which indicated that these farmers were befitted for improved animal farming practices.
In comparison to other farmers, those who owned agricultural land larger than 2 acres and Pucca House or another mansion tended to have higher or medium levels of knowledge about animal husbandry. In addition to the farmers’ education, financial stability was a key aspect in learning information. The chi-square test (Table 9) showed a highly significant effect (P < 0.01) of the difference in value in knowledge level of these farmers based on distinct categories (Table 10).
In order to create an effective work plan for a sustainable livelihood through livestock rearing, it was necessary to examine the level of livestock farming expertise among the farmers in these aspirational districts. The result showed low level of knowledge among these farmers which indicate their lacking in application of improved animal husbandry practices.
4.4.3 Relationship between independent variables with the knowledge level of farmers
Table 11 provides the correlation coefficients for each personal and socio-economic characteristic with the respondent’s knowledge level (Figure 4). The study indicated that, generally, out of 11 independent variables, family type, occupation, and religion showed highly negative correlation (P < 0.01) with knowledge level of farmers in five districts (Figure 5). The two variables marital status and training showed highly positive correlation whereas the remaining variables namely, age, caste, education, house type, and land holding did not establish any significant relationship with the knowledge level of farmers in five Aspirational Districts in West Bengal (Figure 6).
Factors
Districts
Age
Religion
Marital status
Occupation
Caste
Education of the farm women
Family type
Training
House type
Land holding
Knowledge level
Districts
1.0
−0.16*
0.142*
−0.640**
0.383**
0.301**
−0.628**
0.01
−0.290**
0.234**
−0.1
−0.137*
Age
1.0
0.02
0.164**
−0.1
−0.396**
0.150*
0.1
0.1
0.01
0.1
0.001
Religion
1.0
−0.269**
0.403**
0.127*
0.333**
0.418**
0.170**
−0.1
0.0
−0.336**
Marital status
1.0
−0.358**
−0.223**
0.528**
−0.1
0.245**
−0.218**
0.317**
0.220**
Occupation
1.0
0.444**
0.01
0.353**
0.1
0.0
0.353**
−0.242**
Caste
1.0
−0.153*
0.1
0.01
0.1
0.203**
−0.109
Education of the farm women
1.0
0.267**
0.407**
−0.337**
0.401**
−0.108
Family type
1.0
0.608**
0.1
0.125*
−0.258**
Training
1.0
−0.1
0.248**
0.358**
House Type
1.0
−0.323**
0.094
Land Holding
1.0
0.024
Knowledge level
1.0
Table 11.
Spearman correlation of knowledge level of the farmers of aspirational districts of West Bengal.
*P < 0.05; **P < 0.01.
Figure 4.
Knowledge level among the farmers of different aspirational districts (developed by the authors).
Figure 5.
Knowledge level among the farmers of different occupation (developed by the authors).
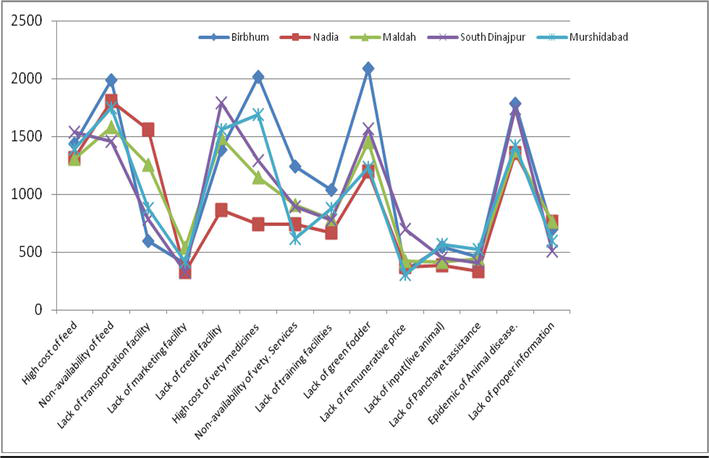
Figure 6.
Constrains among the farmers of aspirational districts of West Bengal (developed by the authors).
4.5 Constraints perceived by the farmers in aspirational districts of West Bengal
In the aspirational districts of West Bengal, the farmers who raise livestock face a number of challenges, which have been evaluated and are shown in Table 12. Overall, constraints show that non-availability of feed (82.22%), epidemic of animal diseases (73.54%), lack of credit facility (68.28%), lack of green fodder (72.30%), and high cost of feed ingredients (67.89%) were the major constraints, while lack of input (22.68%), lack of Panchayat assistant (20.89%), lack of remunerative price (20.12%), lack of marketing facility (18.60%), lack of training facility (38.83%), and lack of proper information (31.48%) were the minor constraint.
Factors
Birbhum
Nadia
Maldah
South Dinajpur
Murshidabad
Overall
%
%
%
%
%
%
1. High cost of feed
57.94
64.02
67.89
80
71.97
67.89
2. Non-availability of feed
80
88.05
81.98
72.02
89.9
82.22
3. Lack of transportation facility
24.02
75.98
66.5
36.67
44.07
48.26
4. Lack of marketing facility
16.08
15.98
28.05
15.95
18.06
18.6
5. Lack of credit facility
55.98
42.01
77.66
87.98
81.94
68.28
6. High cost of veterinary medicines
81.37
35.98
55.96
64.05
85.98
65.2
7. Non-availability of veterinary Services
50
40
47.97
47.98
30.05
43.57
8. Lack of training facilities
41.96
30.06
39.97
37.98
43.94
38.83
9. Lack of green fodder
84.02
57.99
76.02
76.79
64.02
72.3
10. Lack of remunerative price
13.73
18.11
21.45
32.62
15.91
20.12
11. Lack of input (live animal)
22.06
20
26.02
22.14
23.61
22.68
12. Lack of Panchayet assistance
18.53
16.33
25.25
20
25.38
20.89
13. Epidemic of animal disease
71.96
66.04
71.95
84.05
73.99
73.54
14. Lack of proper information
28.04
36.45
39.21
24.17
30.68
31.48
Table 12.
Constraints among the farmers of aspirational districts of West Bengal (N = 5000).
The constraints in the various aspirational districts varied accordingly. In the case of Murshidabad districts, the highest constraints were observed to be the lack of feed availability (89.90%), followed by the high cost of veterinary medicine (85.98%) and a lack of credit facilities (81.94%), while a lack of marketing facilities (18%) and the lack of veterinary services (30%) were found to be less of a constraining factor. However, a similar observation has not been recorded in South Dinajpur. Lack of credit facilities (87.98%) and an animal disease epidemic (84%) were reported to be important obstacles in South Dinajpur, while a lack of green fodder was found to be a big obstacle for farmers in Birbhum district.
It was clear that there was not enough land in Birbhum district to grow fodder, and there were a lot of farmers who needed finance in order to expand their farming operations. For improved livelihood, emphasis may be placed on the production of feed and fodder for animal farming. The study closely resembles an observation made by other study [12] who identified a similar set of constraints among goat farmers in six different agro-climatic zones in West Bengal. Since lack of quality input, lack of marketing facilities were considered to be an area-specific constraints faced by the goat farmers under their studies which is not to be a problem in West Bengal.
In conclusions, the livestock rearing is a significant contributor in rural economy and plays vital role to raise socio-economic status of the rural people. According to the observations, the majority of livestock farmers in aspirational districts are from the most active age group, have less education, and are of lower socio-economic level. The majority of them live in mixed dwellings and have up to one hectare of land. For most farmers to maintain their security of livelihood, cultivation was their primary occupation. According to the findings, most farmers were married and involved in livestock rearing.
It had been observed that education, training received, occupation and landholding had highly significant effect on adoption index. It had been appeared that adoption index among the farmers of South Dinajpur district was significantly higher than the other four districts namely Maldah, Murshidabad, Birbhum, and Nadia. The result indicated that the farmers of South Dinajpur district were more adapted to improved animal husbandry and fishery practices. It had been observed that majority of the farmers of Birbhum district had low adoption level in comparison to other four districts.
Hence, a comprehensive human resource development (HRD) programme should be conducted for better livelihood generation. Adoption index among the farmers needs to be assessed for sustainable livelihood driven work plan as promising endeavour in future. Considering this scenario, a suitable plan needs to be promoted for better livelihood of the farmers in various aspirational districts of West Bengal with a linkage of available science and technology. In future, a comprehensive farmers’ training and demonstration programmes are needed to be conducted in this area for livelihood improvement of the farmers. The adoption level of the farmers about livestock farming needs to be assessed for formulation of proper policies to enhance sustainable livelihood in these districts of West Bengal.
The study on knowledge index of farmers in various aspirational districts of West Bengal explore that, improved technology for scientific livestock rearing is essential for economic gain of stakeholders and farmers. Results of the study revealed that knowledge score among the farmers of Nadia district was highest and in South Dinajpur was lowest than the other three districts namely Birbhum, Maldah, and Murshidabad. Study also revealed that the farmers of Nadia district were having more knowledge about improved animal husbandry practices. Therefore, special attention must be given before implementing any livestock-related entrepreneurial programme among them.
Finally, it also depicted various constraints like lack of training facilities and education, etc. These were the major drawbacks for the upliftment of the socio-economic status of the farmers in the selected districts of West Bengal. It is clear from the findings of the study that farmers use livestock as a secondary job to supplement their income. Therefore, it is observed that small ruminants play an essential role in generating jobs, revenue, capital, and assets. It is crucial to adopt advanced technology and to provide the facilities required for better practices in order to increase the breed’s capacity for production.
The rural poor can use livestock raising as an alternative source of income and as a significant way to meet their financial needs. In order to improve the socio-economic situation of these districts, the Government should take steps to provide appropriate training and assistance, and region-specific policies should be created to support this livelihood sector.
We are thankful to the Department of Biotechnology (DBT), Government of India, for funding the “Establishment of Biotech KISAN Hub” initiative as well as for their prompt assistance and collaboration throughout the study process. We also extend our profound gratitude to the Directorate of Research, Extension and Farms, West Bengal University of Animal and Fishery Sciences for their advice, assistance, and ongoing encouragement.
References
1.Bhattacharjee S, Dhara K, Ghosh S, Das P, Giri A, Sarkar B, et al. Study on socio-economic status and constraints faced by the livestock farmers of the aspirational districts of West Bengal, India. International Journal of Research and Innovation in Social Science (IJRISS). 2021;V(VII):331-340. Available from: https://www.rsisinternational.org/journals/ijriss/Digital-Library/volume-5-issue-7/331-340.pdf
2.FAOSTAT. Production data. 2010. Available from: www.faostat.org
3.NBAGR. National Bureau of Animal Genetic Resources, Indian Council of Agricultural Research. 2014. Available from: www.nbagr.res.in
4.Department of Animal Husbandry, Dairying and Fisheries, Ministry of Agriculture. 20th All India Livestock Census. New Delhi: Govt. of India; 2019
5.Dhara KC, Ray N, Roy S, Samanta AK, Senapati PK. Improvement of reproductive performances of Black Bengal goat through selection under field condition. Journal of Animal and Veterinary Advances. 2008;7:599-603
6.Sahoo AK, Pan S, Tantia MS, Ahlawat SPS. Bengal goat. Kolkata, Karnal: National agricultural technology project (Mission Mode) West Bengal University of Animal and Fishery Science, National Bureau of Animal Genetic Resources; 2004. pp. 1-63
7.Trivedi G. Measurement and analysis of socio-economic studies of rural families. New Delhi: Indian Agricultural Research Institute; 1963. [Ph.D. Thesis]
8.Bhattacharjee S, Dhara K, Ghosh S, Das P, Giri A, Sarkar B, et al. Study on knowledge level of the livestock farmers of aspirational districts of West Bengal, India. International Journal of Livestock Research. 2022;12(1):19-26. https://dx.doi.org/10.5455/ijlr.2021111.1111811
9.Sathyanarayan K et al. A benchmark analysis on livestock activities. Mysore Journal of Agricultural Sciences. 2010;44(3):664-667
10.Dhara KC, Ray N, Goswami A, Bandopadhyay PK. Socio-economic status of the goat farmers in Nadia district of West Bengal. International Journal of Livestock Research. 2016;6(9):29-37
11.Tudu NK, Goswami KK. Demographic profile and management practices of tribal goat farmers in Nadia district of West Bengal. Indian Journal of Applied Research. 2015;5(2):764-766
12.Goswami A, Roy N, Mazumdar AK, Duttagupta R. Behavioural study of the livestock owners to enhance the productivity in saline belt of Sundarban, West Bengal. IndianJournal of Animal Health. 2014;39(2):42-46
13.Samanta AK, Rai B, Senapati PK. Black Bengal Goat. Kolkata, Farah, Uttar Pradesh: AICRP on Goat improvement; Black Bengal Field Unit, West Bengal University of Animal and Fishery Sciences, and Central Institute for Research on Goats; 2009. pp. 1-66
14.Nandi D, Roy S, Bera S, Kesh SS, Samanta AK. The rearing system of Black Bengal goat and their farmers in West Bengal, India. Veterinary World. 2011;4:254-257
15.De A, Goswami A, Mazumder D. Adoption behaviour of livestock farmers in Paschim Medinipore district of West Bengal, India. International Journal of Current Microbiology and Applied Sciences. 2014;3(8):666-672
16.Roy M, Sarkar U, Datta S, Senapati PK, Bera S, Pakhira MC, et al. Socio-economic studies of Black Bengal goat rearing in different agroclimatic zones of West Bengal. International Journal of Pure & Applied Biosciences. 2018;6(1):300-304
17.Smitha S, Mathew J, Venkatachalapathy RT. Socio economic profile of farmers and rearing system of Malabari goats in Central Kerala. Journal of Veterinary and Animal Sciences. 2018;49(1):63-66
18.Dasgupta S. Relative predictability of five indices of adoption of recommended farm practices. Sociologia Ruralis. 1968;8(1):21. DOI: https://doi.org/10.1111/j.1467-9523.1968.tb00569.x
19.Goswami A. The impact of extension education on the social, psychological and administrative behaviour of the livestock owners of the Sundarbans, West Bengal. University of Kalyani, West Bengal; 2010. [Ph.D. thesis]
Written By
Sreetama Bhattacharjee and Keshab Chandra Dhara
Submitted: 16 December 2022Reviewed: 02 January 2023Published: 31 March 2023
 Open access peer-reviewed chapter