Open Access is an initiative that aims to make scientific research freely available to all. To date our community has made over 100 million downloads. It’s based on principles of collaboration, unobstructed discovery, and, most importantly, scientific progression. As PhD students, we found it difficult to access the research we needed, so we decided to create a new Open Access publisher that levels the playing field for scientists across the world. How? By making research easy to access, and puts the academic needs of the researchers before the business interests of publishers.
We are a community of more than 103,000 authors and editors from 3,291 institutions spanning 160 countries, including Nobel Prize winners and some of the world’s most-cited researchers. Publishing on IntechOpen allows authors to earn citations and find new collaborators, meaning more people see your work not only from your own field of study, but from other related fields too.
While most females experience some mood and/or somatic symptoms premenstrually, premenstrual syndrome (PMS) is less common. Despite the clinical advantages of identifying those with PMS, there are few validated brief self-report questionnaires to assess PMS. Allen et al. (1991) developed the 10-item Premenstrual Assessment Form – Short Form (PAF-SF) to address this concern, but there is a dearth of research assessing its psychometric properties. In the proposed chapter, we will: 1) identify conceptually relevant subscales on the PAF-SF through factor analysis; 2) assess the internal consistency of the identified subscales; and 3) assess construct validity by testing how identified subscales relate to theoretically associated traits and mental health diagnoses including trait anxiety on the State-Trait Anxiety Inventory and a premenstrual dysphoric disorder (PMDD) diagnosis on the Structured Clinical Interview for DSM-5. We will discuss the importance of these results in the context of providing care to females with PMS or PMDD.
Dalhousie University, Halifax, Canada and University of Manitoba, Canada
Sherry H. Stewart
Dalhousie University, Canada
*Address all correspondence to: joycek1@mymanitoba.ca
1. Introduction
Menstrual cycle-related fluctuations in mood, behavior, and physical symptoms have been well-documented (e.g., [1–4]). The menstrual cycle can be broken down into five phases, consisting of the menstrual (days 1–5), follicular (days 6–12), ovulatory (days 13–14), luteal (days 17 – premenstrual phase), and premenstrual phases (five days prior to menstrual bleeding; [5–7]). Although all five menstrual cycle phases have been linked to changes in females’ mood, behavior, and physical symptoms [1–4], the premenstrual phase is of particular interest given considerable evidence for increases in depressed mood, risky behaviors (e.g., substance use), and pain during this phase [1–4, 8–10].
There are, however, marked individual differences in the degree of changes in mood, behaviors, and/or physical symptoms experienced in the five days prior to menstruation ([1–4, 8–10]). For those females experiencing more substantial changes during the premenstrual phase, there are two diagnoses that can be considered – premenstrual syndrome (PMS; prevalence rate of 47.8%; [11]) and premenstrual dysphoric disorder (PMDD; prevalence rate of 3–8%; [12, 13]). PMS and PMDD are two classifications along a spectrum of premenstrual symptoms. PMS is defined as moderate emotional, physical, and behavioral symptoms that occur premenstrually [14]. In contrast, PMDD is an affective disorder recognized in the Diagnostic and Statistical Manual of Mental Disorder, 5th Edition (DSM-5; [15]) that is associated with severe increases in emotional, physical, and behavioral symptoms premenstrually that impair the affected individual’s daily functioning. Given the high prevalence of PMS and the impairing nature of the symptoms comprising PMDD, it is critical that clinicians and researchers have access to measures that accurately assess individual differences in premenstrual symptoms.
Several self-report measures have been developed to assess premenstrual symptoms, such as the Premenstrual Assessment Form (PAF; [13]), the Menstrual Distress Questionnaire (MDQ; [16]), and the Premenstrual Symptoms Screening Tool (PSST; [17]). Many of these measures are shown to be both reliable and valid (e.g., [18]); however, they commonly pose two main issues in clinical and research settings which limits their usability. First, these measures are onerous for respondents given their length. For instance, the PAF has 95 items [13], the MDQ has 47 items [16], and the PSST has 19 items [17]. Second, scoring measures with many items can be problematic for researchers and clinicians given time-intensive requirements for scoring and/or the financial burden of purchasing expensive scoring software. For these reasons, brief measures are viewed as advantageous in both clinical and research settings because they provide informative data in a timely fashion while also enabling researchers and clinicians to simultaneously utilize additional measures to gather other pertinent information. While there is clearly a need for brief questionnaires to assess premenstrual symptom severity since PMDD has been in the Diagnostic and Statistical Manual for a decade, we must ensure the strong psychometric properties of brief questionnaires to guarantee they have not sacrificed good measurement in the search for brevity and usability.
To address the above limitations of existing premenstrual symptom measures, Allen et al. [19] developed a shortened 10-item version of the PAF, i.e., the Premenstrual Assessment Form – Short Form (PAF-SF). The PAF-SF assesses severity of premenstrual affective and somatic changes on a 6-point scale. Items are summed for a total PAF-SF (all 10 items) and three subscale scores (i.e., affect [four items], water retention [three items], and pain [three items]), making the PAF-SF a measure with broad coverage of premenstrual symptomatology, yet with few items, helping to reduce burden on respondents, researchers, and clinicians alike.
To develop this measure, Allen et al. [19] selected the 20 items from the original PAF [13] that were most frequently reported to change in the week prior to menstruation. These 20 items were administered to a sample of 217 females with regular menstruation in a smoking cessation trial at two time points: baseline and 6-month follow-up. The 20 items were subject to principal component analysis (PCA) with Varimax rotation which identified three factors: affective, water retention, and pain premenstrual symptoms. Allen et al. [19] trimmed items that did not show salient loadings in this PCA or that did not contribute to internal consistency to produce their final 10-item measure. They conducted preliminary analyses to establish the good psychometric properties of the 10-item total scale and its three subscales (i.e., internal consistencies, test-retest reliability, and criterion-related validity in relation to a measure of nicotine withdrawal symptoms). However, Allen et al. [19] did not conduct a PCA on the final 10-item version of the scale, and specific internal consistency values for the resultant subscales were not reported. Given its brevity and broad symptom coverage, Allen et al.’s [19] preliminary analyses suggest that the PAF-SF might be a good brief measure to administer in clinical and research settings to assess premenstrual symptom severity.
However, beyond the original measure development and preliminary validation study [19], there is a dearth of research examining the psychometric properties of the PAF-SF. Further psychometric analyses in an independent sample are required to determine whether the three PAF-SF subscales suggested by Allen et al. [19] – affect, water retention, and pain – are structurally valid, internally consistent, and show validity in relation to other theoretically-related criterion variables. To achieve this, the current study: (1) identified empirically derived subscales on the PAF-SF using PCA; (2) assessed the internal consistency of the identified subscales; (3) assessed concurrent criterion-related validity of the identified subscales in relation to trait anxiety and specific dimensions of PMDD symptoms as assessed through a gold-standard structured clinical interview; and (4) assessed a form of validity called known groups validity, that measured each identified subscale’s ability to distinguish among groups of females with and without a provisional diagnosis of PMDD based on a gold-standard clinical interview.
We hypothesized [H1] that our exploratory factor analysis of the PAF-SF would reveal a three-factor solution with a good simple structure and factors reflecting affective, water retention, and pain symptoms, respectively [19]. We also hypothesized [H2] that subscales derived from the chosen factor structure would each show acceptable to excellent internal consistency. We further hypothesized that the factorially-derived subscales would show good concurrent criterion-related validity in terms of differential associations with our chosen criterion measures. Specifically, we expected [H3] only the PAF-SF affective subscale would be positively correlated with scores on a validated measure of dispositional anxiety. Given affective symptoms from the PAF-SF include anxiety symptoms [19], we reasoned there should be a strong overlap with a measure tapping the tendency to experience anxiety across situations. We also expected [H4] only the PAF-SF affective subscale would be positively correlated with a symptom count of affective PMDD symptoms endorsed on a gold-standard clinical interview for PMDD (i.e., the Structured Clinical Interview for DSM-5 Disorders; SCID-5; [20]). In contrast, we predicted [H5] only the PAF-SF water retention and pain subscales would be positively correlated with a symptom count of somatic PMDD symptoms endorsed on the SCID-5. Finally, we hypothesized that the factorially-derived PAF-SF subscales would show known group validity. More specifically, we expected [H6] females with a provisional PMDD diagnosis on the SCID-5 would show elevations on all PAF-SF subscales relative to those females without a provisional PMDD diagnosis.
Eighty-seven female cannabis users were originally recruited for a study on cannabis use across the menstrual cycle [21]. Eligibility criteria for the original study were as follows: (1) being between 19 and 45 years old, (2) owning/having access to a smartphone (with a data/texting plan), (3) having no known interference with their menstrual cycle (i.e., past six months or current pregnancy, use of hormonal contraceptives, immediate plans of conceiving, breastfeeding, hysterectomy, amenorrhea, or perimenopausal/postmenopausal), (4) having an average length menstrual cycle (i.e., 25–32 days), (5) not having a pain disorder diagnosis, (6) not prescribed medicinal cannabis, (7) not stopping hormonal contraceptive use within the three months prior to study participation, (8) using cannabis >4 times in the month prior to study involvement, and (9) not abstaining from, trying to abstain from, or in treatment for cannabis use. See Table 1 for sample demographics and clinical characteristics.
Demographic and clinical descriptives for the full sample (N = 87).
Categories are too small to report individually; however, this category consisted of: South East Asians, Blacks, South Asians, Arab/West Asians, Latin Americans, Native Canadians, and others.
Includes: college/university graduates, some post-graduate, and post-graduate degree.
Includes: some college/university, high school graduates, and some high school.
Self-reported menstrual cycle length.
Determined by the State-Trait Anxiety Inventory – Trait Subscale [22].
Determined by symptom count of affective and somatic premenstrual dysphoric disorder symptoms, respectively, endorsed on the Structured Clinical Interview for DSM-5 Disorders [20].
Percentage of the sample meeting DSM-5 diagnostic criteria for the premenstrual dysphoric disorder (PMDD) on the Structured Clinical Interview for DSM-5 Disorders [20].
2.2 Procedure
The study protocol was approved by an institutional research ethics board at Dalhousie University (REB #: 2017–4249) and is a secondary analysis of data collected by Joyce et al. [21]. Recruitment was done via advertisements in the community, on social media, in the local newspaper, and on the radio. The larger study was divided into five sessions; further information on the larger study protocol can be found in Joyce et al. [21]. Only sessions relevant to the current study are described here.
2.2.1 Telephone screening
Participants completed a telephone screening with K.M.J. to determine eligibility (see the above inclusion/exclusion criteria). If deemed eligible, they were scheduled for a baseline assessment where all data relevant to the present study were collected in person.
2.2.2 Baseline assessment
During the baseline assessment, participants provided informed consent, completed three self-report questionnaires (i.e., Demographics, 10-item PAF-SF [19], and State-Trait Anxiety Inventory – Trait Subscale [22]), and took part in a clinical interview, namely the PMDD module of the SCID-5 [20]. The SCID-5 interviews were conducted by K.M.J, a graduate student in psychiatry research at the time of data collection, who was trained and supervised by S.H.S., a licensed clinical psychologist1.
2.3 Materials
2.3.1 Premenstrual assessment form: Short form (PAF-SF)
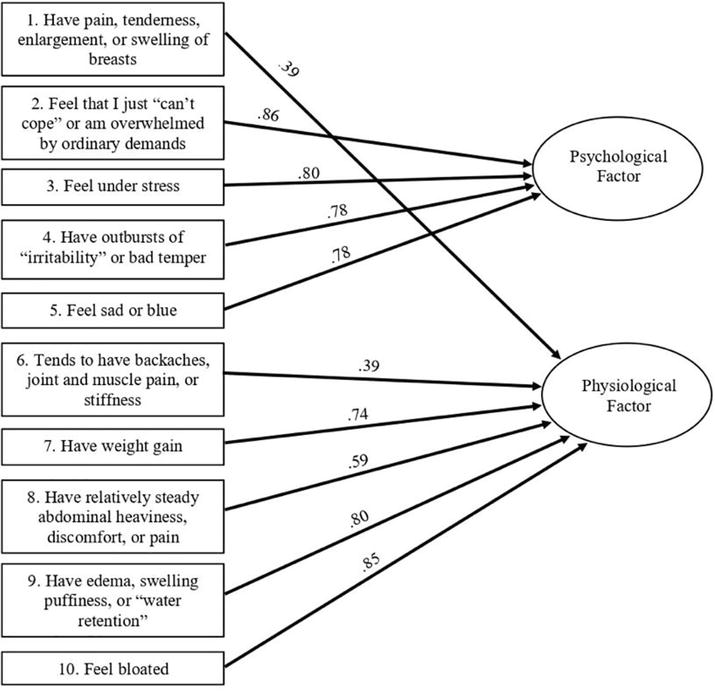
The PAF-SF contains 10 items pertaining to physiological and psychological changes experienced premenstrually (e.g., feeling bloated) [19]. For each item, the intensity of change experienced premenstrually was rated from 1 (“Not present at all or no change from usual level”) to 6 (“Extreme change – the degree of change in severity is so different from your usual state that it is very apparent to you OR even people who do not know you well might notice”). The PAF-SF total score has excellent internal consistency (α = .95), the total score and three proposed subscales (affect, water retention, pain) show acceptable test-retest reliability across a 6-month follow-up (r’s = .60–.70), and the total score shows criterion-related validity against a measure of nicotine withdrawal symptoms in a sample of smokers undergoing smoking cessation (r’s ~ .40; [19]). PAF-SF items are provided in Figure 1.
Figure 1.
Depiction of the two factors, that is, psychological and physiological symptoms, and items from the Premenstrual Assessment Form – Short Form [19] showing salient loadings (≥ .30) on each factor.
The STAI-T [22] was used to examine trait anxiety levels, i.e., the relatively stable aspect of anxiety proneness. The STAI-T consists of 20 items rated on a 4-point scale ranging from 1 (“Almost never”) to 4 (“Almost always”). The STAI-T involves 13 anxiety-present (e.g., “I feel nervous and restless”) and 7 anxiety-absent items (e.g., “I feel pleasant”); the latter are reverse-scored prior to the calculation of the STAI-T total score. Higher total scores on the STAI-T are indicative of elevated trait anxiety. The STAI has demonstrated good-to-excellent internal consistency across studies (α = .86–.95; [22–24]) and test-retest reliabilities have ranged between marginally acceptable-to-good (r’s = .69–.89; [23]). The trait subscale of the STAI is considered a valid measure of general negative affect (i.e., anxiety and depression) [25].
2.3.3 Structured clinical interview for DSM-5 disorders: Research version (SCID-5)
The SCID-5 is the gold-standard clinical interview for mood disorder diagnoses in research settings [20]. It was used in the present study for two purposes: (1) to identify the number of DSM-5 affective and somatic premenstrual-related symptoms endorsed, respectively, and (2) to divide participants into those with and without a provisional PMDD diagnosis for our known groups’ analysis of construct validity.2 The affective premenstrual symptom count on the SCID-5 included four questions pertaining to (a) mood swings; (b) irritability; (c) dysphoric mood; and (d) anxious mood (i.e., Criteria B1-B4, respectively, of the DSM-5 PMDD diagnostic criteria; [15]). The somatic premenstrual symptom count on the SCID-5 included four questions on: (a) fatigue; (b) increased appetite; (c) sleep disruptions; and (d) pain/water retention (i.e., Criteria C3-C5 and C7, respectively, on the DSM-5 PMDD diagnostic criteria; [15]). The SCID-5 [20] has good test-retest reliability over one week (r = .76) and very good-to-excellent inter-rater reliability (κ = .62–.82; [26]). While an analysis of the reliability and validity of PMDD diagnoses via the SCID-5 is currently lacking, Accortt et al. [27] have found that structured interviews for PMDD diagnoses have a high inter-rater agreement (ICC = .86–1.00) and reliability (κ = .96).
2.4 Data analysis
Descriptive statistics were used to characterize the sample on sociodemographic and clinical characteristics. We then compared our sample to norms on the clinical measures (i.e., mean PAF-SF total, mean STAI-T, proportion with provisional PMDD diagnoses).
Next, we conducted an exploratory PCA to examine the factor structure underlying the PAF-SF. An exploratory, as opposed to confirmatory, approach was used since the present study represents the first examination of the factor structure of the 10-item version of the PAF-SF. We utilized orthogonal (Varimax with Kaiser normalization) rotation to improve interpretability of the resultant factor solution and for consistency with the approach used by Allen et al. [19] with the 20-item version of the PAF-SF during test development. To determine the number of factors to retain, we considered the results of both the commonly used Kaiser’s [28] eigenvalue >1.0 rule and the more stringent parallel analysis criterion. Parallel analysis is a procedure that statistically determines the break in the scree plot [29, 30]. We compared obtained eigenvalues to mean eigenvalues generated using Monte Carlo simulations based on the study’s sample size (i.e., N = 87) and the number of variables (i.e., 10 PAF-SF items) [29].
For each factor solution, we calculated sample means and standard deviations (SD) on the associated subscales and examined resultant subscales’ inter-correlations and internal consistencies (Coefficient alphas). We considered alphas > .70 as acceptable and > .80 as good [30]. We used all information (i.e., simple structure [31], factor interpretability, internal consistency of subscales, parsimony) to select the most suitable factor solution. Subscale scores associated with the selected solution were used in all subsequent criterion-related and construct validity analyses.
To determine the criterion-related and construct validity of the factorially-derived PAF-SF subscales, a series of bivariate correlations were conducted to examine relationships between the PAF-SF subscales and (a) STAI-T scores, (b) PMDD affective symptom count from the SCID-5, and (c) PMDD somatic symptom count from the SCID-5. We used Cohen’s [32] convention of considering a correlation of r = .10 as a small correlation, r = .30 a moderate correlation, and r = .50 a large correlation. Finally, a pair of between-sample t-tests were used to compare those with and without a provisional SCID-5 diagnosis of PMDD on each subscale of the PAF-SF. We calculated effect sizes for these group differences using Cohen’s d and used Cohen’s [32] convention of considering a d = .20 as a small effect, d = .50 a moderate effect, and d = .80 a large effect size.
The mean (± SD) score on the PAF-SF total score in our sample of 32.3 ± 9.2 (see Table 1) was about half of a standard deviation above the sample mean of 27.4 ± 10.9 reported by Allen et al. [19] in the PAF-SF development sample at baseline. Just over one-quarter of the sample met SCID-5 [20] criteria for a provisional PMDD diagnosis (see Table 1), which is about three times higher than the rate of PMDD in the general population [12, 13]. The mean (± SD) STAI-T score was 45.5 ± 7.3 (see Table 1), which is comparable to the mean trait anxiety score in the general population of 44.4 ± 11.3 [33].
3.2 Factorial validity
We conducted a PCA to examine the underlying factor structure of the PAF-SF. We first tested assumptions. Given the Kaiser-Meyer-Olkin (KMO) measure of sampling adequacy was > .60 (i.e., .82) and given the significant Bartlett’s test of sphericity (χ2(45) = 321.82, p < .001), we determined that the PAF-SF data was suitable for PCA.
Kaiser’s [29] eigenvalues >1.0 criterion was first used to determine the number of factors to retain. It suggested a three-factor solution; obtained eigenvalues appear at the bottom of Table 2. The three factors together accounted for 67.0% of the variance in PAF-SF item scores. Table 2 shows PAF-SF item loadings on the three extracted factors following orthogonal (Varimax) rotation. Communality values (see Table 2) were strong ranging from .56 (item 8) to .78 (item 10) suggesting that the three factors together explained 56–78% of the variance in individual item scores. Salient loadings were considered those ≥ .30 and are shown in bold (see Table 2).
PAF-SF Item Content (original subscale)
Factor 1 Affect
Factor 2 Water Retention
Factor 3 Pain
Communality
1. Painful Breasts (Pain)
.11
.30
.71
.61
2. Overwhelmed (Affect)
.87
.02
−.04
.75
3. Feel Under Stress (Affect)
.80
.23
.00
.70
4. Irritable Outbursts (Affect)
.78
.25
−.01
.68
5. Feel Sad or Blue (Affect)
.77
.28
−.01
.68
6. Back/Joint/Muscle Pain (Pain)
.28
.48
−.59
.66
7. Weight Gain (Water Retention)
.21
.75
−.01
.61
8. Abdominal Pain (Pain)
.19
.64
−.34
.56
9. Water Retention (Water Retention)
.16
.78
.21
.68
10. Feel Bloated (Water Retention)
.20
.85
.16
.78
Table 2.
Results of the principal component analysis: Loadings of each Premenstrual Assessment Form – Short Form item on the orthogonally-rotated three-factor solution.
Factor 1 was labeled affect, as it showed salient positive loadings from all four intended affect items (Table 2). Factor 2 was labeled water retention, as it showed its three strongest positive salient loadings from the three intended water retention items; however, it showed salient positive loadings from all three intended pain items as well (Table 2). Factor 3 was labeled pain, as it showed salient loadings from all three intended pain items; however, one of these was a positive loading (Item 1) and the other two were unexpectedly negative loadings (Items 6 and 8; see Table 2). The simple structure for the rotated three-factor solution was poor: while there were no hyperplane items (i.e., items showing no salient loadings on any factor), three of the 10 items showed complex loadings (i.e., a salient loading on more than one factor). All three complex loadings were from the intended pain items which showed salient loadings on both the water retention and pain factors (i.e., Factors 2 and 3, respectively). Given that all items showed salient loadings on (at least) their intended factor, we calculated scores on the original PAF-SF subscales using the scoring suggested by Allen et al. [19]. Bivariate correlations between the three subscales ranged from r = .40 (affect – pain) to r = .49 (water retention – pain; see Table 3). While these were moderate to large inter-subscale correlations [34], they were somewhat lower than the inter-subscale correlations (r’s > .60) reported by Allen et al. [19]. Coefficient alpha values were good for the water retention and affect subscales (α = .83 and .85, respectively) but unacceptably low for the pain subscale (α = .45; [34]), inconsistent with H2. The unacceptably low alpha for the pain subscale was likely due to constituent items having salient loadings of different directions on Factor 3 (pain). Taken together, these results strongly suggest that the three-factor solution involves factor over-extraction; more specifically, separate pain and water retention factors do not appear to be justified.
1
2
3
4
5
1. Psychologicala
—
2. Physiologicala
.49*
—
3. Affectb
1.0*
.49*
—
4. Painb
.40*
.83*
.40*
—
5. Water Retentionb
.43*
.89*
.43*
.49*
—
Table 3.
Bivariate correlations between subscales were identified via two-factor and three-factor solutions from the principal component analysis.
An asterisk (*) denotes a significant correlation coefficient (p < .001).
The psychological and affect subscales, from the two- and three-factor solutions, respectively, include the same four Premenstrual Assessment Form – Short Form items.
A more stringent parallel analysis criterion for determining the number of factors to extract was then utilized. Comparing against mean eigenvalues, parallel analysis suggested two factors should be retained rather than the three suggested by the less stringent Kaiser’s [28] eigenvalues >1.0 criterion. The two factors together accounted for 56.8% of the variance in PAF-SF item scores. Table 4 shows PAF-SF item loadings on the two extracted factors following orthogonal (Varimax) rotation. Salient loadings ≥ .30 are shown in bold (see Table 4). There was a good simple structure [31] for the rotated two-factor solution: no hyperplane items, only one complex item, and each factor containing at least five salient loadings.
PAF-SF Item Content (original subscale)
Factor 1 Psychological
Factor 2 Physiological
Communality
1. Painful Breasts (Pain)
.01
.39
.15
2. Overwhelmed (Affect)
.86
.00
.74
3. Feel Under Stress (Affect)
.80
.21
.69
4. Irritable Outbursts (Affect)
.78
.23
.67
5. Feel Sad or Blue (Affect)
.78
.26
.67
6. Back/Joint/Muscle Pain (Pain)
.40
.39
.31
7. Weight Gain (Water Retention)
.15
.74
.61
8. Abdominal Pain (Pain)
.27
.59
.42
9. Water Retention (Water Retention)
.15
.80
.66
10. Feel Bloated (Water Retention)
.20
.85
.77
Table 4.
Results of the principal component analysis: Loadings of each Premenstrual Assessment Form – Short Form item on the orthogonally-rotated two-factor solution.
Notes: Salient loadings ≥ .30 are shown in bold.
While item 6 showed a complex loading on both factors, for subscale scoring purposes, it was included with Factor 2 (Physiological symptoms) given its superior conceptual fit with this factor.
Factor 1 was labeled psychological premenstrual symptoms, as it showed strong salient positive loadings from all four affect items and an additional moderate loading from one pain item (Table 4 and Figure 1). Factor 2 was labeled physiological premenstrual symptoms, as it showed strong positive salient loadings from all three water retention items as well as moderate positive salient loadings from all three pain items (see Table 4 and Figure 1). Communality values (see Table 4) were not as strong overall compared to the three-factor solution given the loss of one factor. They ranged from .15 (Item 1) to .77 (Item 10) suggesting that the two factors together explained 15–77% of the variance in individual item scores. The lowest communality values were for the intended pain items which ranged from .15 (Item 1) to .42 (Item 8); the remaining items all showed high communality values ranging from .61 (Item 7) to .77 (Item 10). The one pain item that showed the complex loadings (i.e., Item 6: back/joint/muscle pain) showed similarly sized moderate salient positive loadings on both the psychological and physiological factors. Since this item conceptually fit best with the physiological factor, it was included with the other Factor 2 items in scoring of the factorially-derived subscales. The two subscales were inter-correlated at r = .49, a large magnitude correlation (Table 3). Consistent with H2, internal consistencies for the resultant subscales ranged from acceptable (physiological subscale; α = .76) to good (psychological subscale; α = .85; [34]). The internal consistency of the physiological subscale remained essentially unchanged if the one cross-loading item (item 6) was removed (α = .75); thus, item 6 was retained in scoring the physiological subscale.
Given its superior simple structure and interpretability, the acceptable to good internal consistencies of the resultant subscales, and based on the principle of parsimony, the two-factor solution was chosen above the three-factor solution as the best representation of the factor structure underlying the PAF-SF. Bivariate correlations between all subscales identified using the PCAs are shown in Table 3.
3.3 Criterion-related validity
Bivariate correlations suggested significant convergent/discriminant relationships between the two PAF-SF subscales and various criterion measures. Consistent with H3, the PAF-SF was correlated with the STAI trait anxiety subscale only in the case of the psychological but not the physiological PAF-SF subscale. Specifically, higher scores on the psychological subscale of the PAF-SF were associated with significantly more trait anxiety (r = .47, p < .001) on the STAI trait anxiety subscale; the correlation was large in magnitude supporting the PAF-SF psychological subscale’s validity but not so large as to suggest redundancy with trait anxiety. Also consistent with H3, scores on the physiological subscale of the PAF-SF were not significantly related to scores on the trait anxiety subscale of the STAI (r = .14, p = .213; small magnitude correlation). Comparison of dependent-sample correlations revealed that the correlation between STAI-T and the PAF-SF was significantly stronger in the case of the psychological than the physiological PAF-SF subscale (z = 3.23, p = .001).
Consistent with H4, the PAF-SF subscales were also correlated with the affective symptom count on the SCID-5 PMDD module only for the psychological, but not the physiological PAF-SF subscale. A significant large magnitude positive correlation was observed between the number of affective symptoms endorsed on the SCID-5 and scores on the psychological subscale of the PAF-SF (r = .49, p < .001). In contrast, scores on the physiological subscale of the PAF-SF were not significantly related to affective symptom count on the SCID-5 PMDD module (r = .20, p = .062; small magnitude correlation). Comparison of dependent-sample correlations revealed that the correlation between SCID-5 PMDD affective symptom count and the PAF-SF was significantly stronger in the case of the psychological than the physiological PAF-SF subscale (z = 2.89, p = .002).
Partially consistent with H5, a significant positive correlation of moderate magnitude was observed between the number of somatic premenstrual-related symptoms endorsed on the SCID-5 and scores on the physiological subscale of the PAF-SF (r = .29, p = .008). But contrary to H5, scores on the psychological subscale of the PAF-SF were also significantly related to the somatic symptom count on the SCID-5 PMDD module with a correlation coefficient of similar moderate magnitude to that seen with the physiological subscale of the PAF-SF (r = .29, p = .007).
3.4 Construct validity: Known groups validation
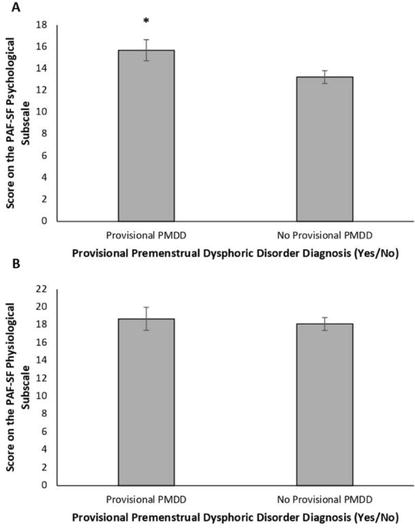
Partially consistent with H6, females with a provisional diagnosis of PMDD on the SCID-5 reported higher scores on the psychological subscale of the PAF-SF than those without a diagnosis (t85 = −2.25, p = .03; d = .52 [medium effect size]; see Figure 2A). However, inconsistent with H6, scores on the physiological subscale of the PAF-SF did not differ between PMDD groups (t85 = −.62, p = .54; d = .15 [small effect size]; see Figure 2B).
Figure 2.
Mean (A) psychological and (B) physiological subscale scores on the Premenstrual Assessment Form – Short Form (PAF-SF; [19]) in females with (n = 24) and without (n = 63) a provisional premenstrual dysphoric disorder (PMDD) diagnosis. Error bars represent standard errors. An asterisk (*) indicates significantly higher PAF-SF psychological subscale scores in females with a provisional PMDD diagnosis versus those without (p < .05).
One of the purposes of the present study was to examine the factorial validity of the 10-item PAF-SF since it had never been subject to factor analysis before. While in the initial test development and validation study, Allen et al. [19] did find support for a three-factor solution to an earlier 20-item version of the PAF-SF (i.e., affect, water retention, and pain factors), they further reduced the scale to 10-items but did not confirm the assumed three-factor structure of the reduced scale. In the present study, the traditional Kaiser’s [28] eigenvalues >1.0 criterion for determining the number of factors to retain suggested a three-factor solution which, at first glance, resembled the three-factor structure suggested by Allen et al. [19] with Factors 1–3 capturing affect, water retention, and pain symptoms, respectively. However, there were several problems with this solution. First, there were several complex loadings between the water retention and pain factors with all intended pain items showing primary or secondary loadings on Factor 2, water retention. Second, contrary to theory, the three intended pain items showed opposite direction salient loadings on Factor 3 with breast pain showing a positive loading, and abdominal pain and back/joint/muscle pain showing negative loadings, on this factor. Finally, while the affect and water retention subscales [19] showed good internal consistencies (α’s > .80), the internal consistency for the pain subscale (i.e., α = .45) was unacceptably low [34]. Taken together, these findings suggested that the three-factor solution represented factor over-extraction and provided little in the way of factorial validity for a pain factor that was distinct from the water retention factor. Indeed, when Allen et al. [19] reduced their 20-item PAF-SF to the current 10-item version, they had to lower the magnitude of acceptable factor loadings for item retention from their intended minimum of .40 to find sufficient items that could be retained for their pain subscale. Each of their retained three pain items had secondary (or primary) salient loadings on the water retention factor in their PCA of the 20-item version of the PAF-SF [19]. Thus, it is perhaps not surprising that there was a lack of stability of a separate pain factor in our replication.
The more stringent parallel analysis criterion (using mean eigenvalues) for determining the number of factors to retain suggested a two-factor solution with factors that we labeled psychological and physiological premenstrual symptoms, respectively. All four items in Allen et al.’s [19] affect subscale comprised the first factor (psychological), and the remaining water retention and pain items all showed salient loadings on the second factor (physiological). This two-factor solution showed a superior simple structure [31] relative to the three-factor solution and both resultant subscales from the two-factor solution showed acceptable to good internal consistencies (α’s > .70). Thus, we opted to select the more parsimonious two-factor structure over the three-factor structure. While this runs contrary to the results of Allen et al. [19] and H1, parallel analysis has been found to produce more accurate factor extractions than Kaiser’s [29] eigenvalue >1.0 rule [35], providing further impetus for our selecting the two-factor over the three-factor solution. All additional validation tests were conducted using subscale scores derived from the two-factor solution.
We saw strong support for the criterion-related validity of the psychological symptom subscale of the PAF-SF in that this subscale showed theoretically expected significant positive, large magnitude correlations with trait anxiety and with the count of premenstrual affective symptoms endorsed on the SCID-5 PMDD module [20]. This shows that females who are more dispositionally anxious (i.e., showing a tendency to experience greater anxiety across a variety of situations; [22]) are also more likely to self-report changes in negative affect, including anxious affect, in the five days prior to menstruation on the PAF-SF. These criterion-related validity results also show that females who endorse experiencing more affective symptoms on a gold-standard clinical interview for diagnosing PMDD also self-report a greater severity of psychological premenstrual symptoms on the PAF-SF. Moreover, these significant criterion-related validity findings were specific to the psychological symptom subscale of the PAF-SF and were not seen with the PAF-SF physiological symptoms subscale. Additionally, the magnitudes of the correlations of these two criterion measures with the PAF-SF were significantly stronger for the psychological subscale than for the physiological subscale. Overall, this provides strong criterion-validation for the PAF-SF psychological symptoms subscale, consistent with H3.
The test of criterion-related validity of the PAF-SF physiological symptoms subscale produced results that were less definitive. Consistent with H4, this subscale showed a significant positive correlation of moderate magnitude with a symptom count measure of somatic symptoms endorsed on the SCID-5 PMDD module [20]. However, this relation was not unique to the physiological symptom subscale of the PAF-SF; indeed, a similar moderate magnitude correlation with the PMDD somatic symptom count was seen for the PAF-SF psychological symptom subscale. At first glance, this might suggest relatively poor criterion-related validity for the physiological symptom subscale of the PAF-SF. However, certain limitations of the symptom count of PMDD somatic symptoms endorsed on the SCID-5 as the criterion measure against which the PAF-SF physiological symptoms subscale was assessed should be acknowledged. There was substantial content overlap between the PAF-SF psychological scale and the SCID-5 PMDD affective symptom count criterion measure. However, this was less true of the content match between the PAF-SF physiological scale and the SCID-5 PMDD somatic symptom count criterion measure where all six PAF-SF physiological scale items corresponded to only one of four of the PMDD somatic symptoms assessed (i.e., DSM-5 PMDD Criterion C7: pain/water retention). We considered using only endorsement on the SCID-5 of the single symptom, Criterion C7 from the DSM-5, as our criterion-validity check for our test of H5. However, the use of single-item measures as criterion measures are usually advised against in the psychometric literature due to measurement error concerns [36]. Moreover, factor analytic work on the symptoms of PMDD in the DSM-5 [15] has shown that the pain/water retention symptom (Criterion C7) shows a moderate but salient loading on a factor defined by strong salient loadings from the affective symptoms (Criteria B1-B4) rather than loading with the remaining “somatic” symptoms (Criteria C3-C5) on their separate second factor [37, 38]. The lack of clear division of DSM-5 PMDD symptoms into affective versus somatic domains may explain why both the PAF-SF physiological and psychological subscales correlated to the same moderate degree with the PMDD somatic symptom count on the SCID-5. Thus, while the correlation of the PAF-SF physiological subscale with the PMDD somatic symptom count on the SCID-5 provides some preliminary criterion-related validation for this PAF-SF subscale, more work needs to be done to definitively support its validity in the future.
Our known groups validity analysis yielded results partially consistent with H6. Specifically, females with a provisional diagnosis of PMDD on the gold-standard SCID-5 scored significantly higher than those without provisional PMDD on the psychological symptom subscale of the PAF-SF, with the group difference proving moderate magnitude [32]. This provides important evidence of construct validity for this PAF-SF subscale. Unexpectedly, those in the provisional PMDD group did not score significantly higher on the physiological symptom subscale of the PAF-SF (a small magnitude group difference; [32]). While this might at first glance suggest a lack of construct validity for the physiological symptom subscale, it is important to remember that water retention and pain symptoms (tapped by the six items of the PAF-SF physiological symptoms subscale) represent only a single symptom (Criterion C7) of 11 symptoms on the SCID-5 PMDD module. Indeed, factor analytic work on the symptoms of PMDD in the DSM-5 has shown higher importance of the affective symptoms (Criteria B1-B4) as opposed to water retention and pain symptoms (Criterion C7) as core symptoms of PMDD [37].
While the primary purpose of the present study was practical – i.e., further evaluation of the psychometric properties of the 10-item PAF-SF [19] – our findings also contribute to the theoretical understanding of the underlying structure of premenstrual symptoms. Like our PCA supporting two factors underlying the structure of premenstrual symptoms, other recent findings have supported two factors [37, 38]. Where these various findings converge is in identifying a primary factor comprised of affective premenstrual symptoms (e.g., mood swings, anxious mood, dysphoric mood) and a separate second factor comprised of physiological symptoms. However, the specific symptoms loading onto the second factor have varied across studies depending on the premenstrual symptom measure used. With our PCA of the 10-item PAF-SF, the physiological symptoms loading on Factor 2 were a set of six items comprising water retention and pain (captured with a single item [C7] in the DSM-5). For the other two studies [37, 38], the factor analyses were of the DSM-5 items where Factor 2 included salient loadings from somatic symptoms like sleep disturbance and appetite changes. Interestingly, the DSM-5 water retention/pain item showed a salient loading on the first (affective) factor rather than the second factor in both studies [37, 38]. This suggests that one may need to have a greater weighting of water retention and pain symptoms within the measurement tool than currently represented in the DSM-5 definition of PMDD for a separate water retention/pain factor to emerge. It remains to be determined if, when added to the DSM-5 to replace the current single water retention/pain symptom, the six PAF-SF physiological symptoms would load with the other DSM-5 somatic symptoms or on their own separate factor.
Several potential study limitations should be acknowledged that may affect the interpretation of our results and suggest useful directions for future research. First, our sample size was relatively small for conducting a PCA. While our sample size of N = 87 participants exceeds some rules-of-thumb for PCA sample size such as a minimum of five participants per variable (N = 50 minimum in our case; [39]) or 20 participants per factor (N = 60 minimum in the case of our three-factor solution; [40]), it was just short of the sample size recommended by other rules-of-thumb such as 10 participants per variable (N = 100 minimum in our case; [36]) or N = 100 participants minimum overall [41]. The biggest risk of having an inadequate sample size for a PCA is a potential lack of replicability of the factorial solution [42]. Thus, it will be important for future studies to replicate our recommended two-factor solution for the PAF-SF using a larger sample and confirmatory factor analytic methods. Second, our sample had several characteristics that may limit generalizability of our results. For example, participants were all regular cannabis users for reasons related to the larger study from which this secondary data was drawn [19]. Like the original measure development sample (female smokers undergoing tobacco cessation; [19]), results obtained with substance-using samples may not generalize to non-substance users. As another example, a relatively large proportion of the sample (over one-quarter) met DSM-5 criteria for a provisional PMDD diagnosis which is substantially higher than the 3–8% of the general female population with PMDD [12, 13]. This high rate may have been due to (a) the original study [21] being advertised as concerning cannabis use across the menstrual cycle which may have preferentially attracted females with PMDD concerns and/or (b) our failure to confirm PMDD diagnoses with prospective daily ratings of symptoms for two symptomatic cycles as required by DSM-5 [15]. Either way, it will be important to examine the psychometric properties of the PAF-SF in a more representative sample of naturally cycling females in the future. Finally, as with the original validation study [19], only a small number of criterion measures were included in the present study to examine the criterion-related validity of the PAF-SF. Thus, future studies should include a broader range of validating tools, particularly those that might theoretically be expected to show unique correlations with the physiological subscale of the PAF-SF.
In conclusion, our study provides additional support for the good psychometric properties of the PAF-SF that builds upon the results presented by Allen et al. [19] in their original test development and preliminary validation study. However, contrary to Allen et al.’s [19] recommendations that this self-report measure should be scored on three subscales, our findings suggest that the PAF-SF should be scored according to two subscales – psychological (the equivalent of Allen et al.’s [19] 4-item affect subscale) and physiological symptoms (the equivalent of the sum of Allen et al.’s [19] 3-item water retention subscale and their 3-item pain subscale). Both of our suggested subscales show at least partial evidence of criterion-related validity in relation to theoretically relevant criterion variables, and the psychological subscale shows evidence of known groups validity in relation to PMDD diagnoses. Overall, our findings add to the preliminary results of Allen et al. [19] in supporting the 10-item PAF-SF as a useful brief measure of premenstrual symptom severity for both research and clinical settings, that can overcome the practical limitations of longer measures of premenstrual symptoms.
Funding for the larger project was obtained from the Department of Psychiatry Research Fund at Dalhousie University.
At the time of data collection, Kayla Joyce’s graduate studies in psychiatry research at Dalhousie University were supported by a Nova Scotia Graduate Scholarship, the Scotia Scholar Award from the Nova Scotia Health Research Foundation, and the Joseph-Armand Bombardier Canada Graduate Scholarship from the Social Sciences and Humanities Research Council of Canada. Kayla Joyce’s doctoral degree in clinical psychology at the University of Manitoba, which she was completing at the time of writing this chapter, was supported by a Vanier Canada Graduate Scholarship from the Social Sciences and Humanities Research Council. Sherry Stewart is supported by a Canadian Institutes of Health Research Tier 1 Canada Research Chair in Addictions and Mental Health at Dalhousie University.
1.Joyce KM, Good KP, Tibbo P, Brown J, Stewart SH. Addictive behaviors across the menstrual cycle: A systematic review. Archives of Women’s Mental Health. 2021;24:529-542. DOI: 10.1007/s00737-020-01094-0
2.Lorenz TK, Gesselman AN, Vitzthum VJ. Variance in mood symptoms across menstrual cycles: Implications for premenstrual dysphoric disorder. Women’s Reproductive Health. 2017;4:78-88. DOI: 10.1080/23293691.2017.1326248
3.Iacovides A, Avidon I, Baker FC. Does pain vary across the menstrual cycle? A review. European Journal of Pain. 2015;19:1389-1405. DOI: 10.1002/ejp.714
4.de Tommaso M. Pain perception during menstrual cycle. Current Pain and Headache Reports. 2011;15:400-406. DOI: 10.1007/s11916-011-0207-1
5.Fehring RJ, Schneider M, Raviele K. Variability in the phases of the menstrual cycle. Journal of Obstetric, Gynecologic, and Neonatal Nursing. 2006;35:376-384. DOI: 10.111/j.1552-6909.2006.00051.x
6.Lenton EA, Landgren B, Sexton L. Normal variation in the length of the luteal phase of the menstrual cycle: Identification of the short luteal phase. BJOG: An International Journal of Obstetrics & Gynaecology. 1984;91:685-689. DOI: 10.111/j.1471-0528.1984.tb04831.x
7.Walsh RN, Budtz-Olsen I, Leader C, Cummins RA. The menstrual cycle, personality, and academic performance. Archives of General Psychiatry. 1981;38:219-221. DOI: 10.1001/archpsyc.1981.01780270105015
8.Collins A, Eneroth P, Landgren BM. Psychoneuroendocrine stress responses and mood as related to the menstrual cycle. Psychosomatic Medicine. 1985;47:512-527. DOI: 10.1097/00006842-198511000-00002
9.Aganoff JA, Boyle GJ. Aerobic exercise, mood states and menstrual cycle symptoms. Journal of Psychosomatic Research. 1994;38:183-193. DOI: 10.1016/0022-3999(94)90114-7
10.Reed SC, Levin FR, Evans SM. Changes in mood, cognitive performance and appetite in the late luteal and follicular phases of the menstrual cycle in women with and without PMDD (premenstrual dysphoric disorder). Hormones and Behavior. 2008;54:185-193. DOI: 10.1016/j.yhbeh.2008.02.018
11.Direkvand-Moghadam A, Sayehmiri K, Delpisheh A, Satar K. Epidemiology of premenstrual syndrome (PMS) - a systematic review and meta-analysis study. Journal of Clinical & Diagnostic Research. 2014;8:106-109. DOI: 10.7860/JCDR/2014/8024.4021
12.Wittchen HU, Becker E, Lieb R, Krause P. Prevalence, incidence and stability of premenstrual dysphoric disorder in the community. Psychological Medicine. 2002;32:119-132. DOI: 101017/S0033291701004925
13.Halbreich U, Borenstein J, Pearlstein T, Kahn LS. The prevalence, impairment, impact, and burden of premenstrual dysphoric disorder (PMS/PMDD). Psychoneuroendocrinology. 2003;28:1-23. DOI: 10.1016/S0306-4530(03)00098-2
14.Dickerson LM, Mazyck PL, Hunter MH. Premenstrual syndrome. American Family Physician. 2003;15:1743-1752
15.American Psychiatric Association. Diagnostic and Statistical Manual of Mental Disorder. 5th ed. Arlington, VA: APA Press; 2013
16.Moos RH. The development of a menstrual distress questionnaire. Psychosomatic Medicine. 1968;30:852-867. DOI: 10.1097/00006842-196811000-00006
17.Steiner M, Macdougall M, Brown E. The premenstrual symptom screening tool (PSST) for clinicians. Archives of Women’s Mental Health. 2003;6:203-209. DOI: 10.1007/s00737-003-0018-4
18.Halbreich U, Endicott J, Schacht S, Nee J. The diversity of premenstrual changes as reflected in the premenstrual assessment form. Acta Psychiatrica Scandinavica. 1982;65:46-65. DOI: 10.1111/j.1600-0447.1982.tb00820.x
19.Allen SS, McBride CM, Pirie PL. The shortened premenstrual assessment form. Journal of Reproductive Medicine. 1991;36:769-772
20.First MB, Williams JBW, Karg RS, Spitzer RL. Structured Clinical Interview for the DSM-5 – Research Version. Arlington, VA: American Psychiatric Association; 2015
21.Joyce KM, Thompson K, Good KP, Tibbo PG, O’Leary ME, Perrot TS, et al. The impact of depressed mood and coping motives on cannabis use quantity across the menstrual cycle in those with and without pre-menstrual dysphoric disorder. Addiction. 2021;116:2746-2758. DOI: 10.1111/add.15465
23.American Psychological Association. The State-Trait Anxiety Inventory (STAI) [Internet]. 2011. Available from: https://www.apa/org/pi/about/publications/caregivers/practice-settings/assessment/tools/trait-state
24.Gustafson LW, Gabel P, Hammer A, Lauridsen HH, Petersen LK, Andersen B, et al. Validity and reliability of state-trait anxiety inventory in Danish women aged 45 years and older with abnormal cervical screening results. BMC Medical Research Methodology. 2020;20:89. DOI: 10.1186/s12874-020-00982-4
25.Balsamo M, Romanelli R, Innamorati M, Ciccarese G, Carlucci L, Saggino A. The state-trait anxiety inventory: Shadows and lights on its construct validity. Journal of Psychopathology and Behavioral Assessment. 2013;35:475-486. DOI: 10.1007/s10862-013-9354-5
26.Tolin DF, Giliam C, Wootton BM, Bowe W, Bragdon LB, Davis E, et al. Psychometric properties of a structured diagnostic interview for DSM-5 anxiety, mood, and obsessive-compulsive and related disorders. Assessment. 2018;25:3-13. DOI: 10.1177/1073191116638419
27.Accortt EE, Bismark A, Schneider TR, Allen JJB. Diagnosis of premenstrual dysphoric disorder: The reliability of a structured clinical interview. Archives of Women’s Mental Health. 2011;14:265-267. DOI: 10.1007/s00737-011-0209-3
28.Kaiser HF. The application of electronic computers to factor analysis. Education and Psychological Measurement. 1960;20:141-151. DOI: 10.1177/001316446002000116
29.Longman RS, Cota AA, Holden RR, Fekken GC. A regression equation for the parallel analysis criterion in principal components analysis: Mean and 95th percentile eigenvalues. Multivariate Behavioral Research. 1989;24:59-69. DOI: 10.1207/s15327906mbr2401_4
30.Horn JL. A rationale and test for the number of factors in factor analysis. Psychometrika. 1965;30:179-185. DOI: 10.1007/BF02289447
31.Thurstone LL. Multiple Factor Analysis. Chicago, IL: The University of Chicago Press; 1947
32.Cohen J. Statistical Power Analysis for the Behavioral Sciences. Hillsdale, NJ: Lawrence Earlbaum Associates; 1988
33.Asido AN, Teleki SA, Csokasi K, Rozsa S, Bandi SA. Developmental of the short version of the Spielberger state-trait anxiety inventory. Psychiatry Research. 2020;291. DOI: 10.1016/j.psychres.2020.113223
34.Cortina JM. What is coefficient alpha? An examination of theory and applications. Journal of Applied Psychology. 1993;78:98-104. DOI: 10.1037/0021-9010.78.1.98
35.Zwick WR, Velicer WF. Comparison of five rules for determining the number of components to retain. Psychological Bulletin. 1986;99:432-442. DOI: 10.1037/0033-2909.99.3.432
37.Teng CT, Vieira Filho AH, Artes R, Gorenstein C, Andrade LH, Wand YP. Premenstrual dysphoric symptoms among Brazilian college students: Factor structure and methodological appraisal. European Archives of Psychiatric and Clinical Neuroscience. 2004;255:51-56. DOI: 10.1007/s00406-004-0535-9
38.Wang YP, Teng CY, Vieira Filho AHG, Gorenstein C, Andrade LH. Dimensionality of the premenstrual syndrome: Confirmatory factor analysis of premenstrual dysphoric symptoms among college students. Brazilian Journal of Medical and Biological Research. 2007;40:639-647. DOI: 10/1590/s0100-879x2007000500006
39.Hatcher L. A Step-by-Step Approach to Using the SAS System for Factor Analysis and Structural Equation Modeling. Cary, NC: SAS Institute, Inc; 1994
40.Arrindell WA, van der Ende J. An empirical test of the utility of the observations-to-variables ratio in factor and component analysis. Applied Psychological Measurement. 1985;9:165-178. DOI: 10.1177/014662168500900205
41.Kline P. An Easy Guide to Factor Analysis. Abingdon-on-Thames, UK: Routledge; 2014
42.Castello AB, Osborne JW. Best practices in exploratory factor analysis: Four recommendations for getting the most out of your analysis. Practical Assessment, Research, and Evaluation. 2005;10:1-9. DOI: 10.7275/jyj1-4868
Notes
Data from the SCID-5 was missing for one participant. As such, they were excluded from all analyses including SCID-5 data.
Our PMDD diagnoses in the present study were considered ‘provisional’ as they were based entirely on the SCID-5 interview and were not confirmed by prospective daily ratings during at least two symptomatic cycles as required in Criterion F of the DSM-5 PMDD diagnostic criteria [15].
Written By
Kayla M. Joyce and Sherry H. Stewart
Submitted: 06 March 2023Reviewed: 13 March 2023Published: 13 April 2023