Open Access is an initiative that aims to make scientific research freely available to all. To date our community has made over 100 million downloads. It’s based on principles of collaboration, unobstructed discovery, and, most importantly, scientific progression. As PhD students, we found it difficult to access the research we needed, so we decided to create a new Open Access publisher that levels the playing field for scientists across the world. How? By making research easy to access, and puts the academic needs of the researchers before the business interests of publishers.
We are a community of more than 103,000 authors and editors from 3,291 institutions spanning 160 countries, including Nobel Prize winners and some of the world’s most-cited researchers. Publishing on IntechOpen allows authors to earn citations and find new collaborators, meaning more people see your work not only from your own field of study, but from other related fields too.
Financial development and deregulation have historically driven economic growth but have also exacerbated inequality. The relaxation of financial regulations preceding the 2008–2009 crisis is a prime example of this phenomenon. While initially promoting growth, it exacerbated both labor and profit inequalities. The crisis laid bare vulnerabilities in the financial systems of Eurozone EZ countries, resulting in economic recession and worsening inequality domestically and internationally. This chapter first reviews the theoretical underpinnings of the impact of financialization on growth and inequality, followed by an examination of the components of inequality, including factor, labor, profit, and unemployment indices. Central to our discussion is the imperative of reducing inequality, considered fundamental for fostering growth, welfare, and social cohesion. The empirical investigation is conducted to assess the determinants of total inequality before and after the 2008–2009 financial crisis, with EZ countries categorized into three groups: Northern EZ countries, Southern EZ countries, and Newcomers. Conclusions and policy implications underscore the necessity of regulating the financial system to prevent crises, maintaining low unemployment rates, and ensuring equitable increases in income for both skilled and unskilled workers as for capital owners.
Department of Social Anthropology and History, University of the Aegean, Lesvos, Greece
Nikolina Kosteletou
Department of Economics, National and Kapodistrian University of Athens, Athens, Greece
*Address all correspondence to: akyriakopoulos@sa.aegean.gr
1. Introduction
The primary objective of this chapter is to provide both theoretical foundations and empirical validation of the relationship between financialization, growth, and inequality, with the aim of deriving policy implications for Eurozone (EZ) countries. In Section 2, recent theoretical approaches regarding the interaction of financial growth, inequality, and overall economic growth are reviewed. It is evident that the impact of financialization on inequality and growth varies depending on a country’s level of development and institutional framework. Financialization itself can be a primary driver of financial crises. Inequality occupies a central role in our analysis, representing a pivotal factor for fostering social cohesion and achieving inclusive economic growth. Section 3 examines inequality indices derived from the Lorenz curve and the Gini index, dividing the population into two categories of workers and two categories of investors. Total inequality is assessed in relation to various factors, including wages, profits, labor productivity, and the structure of the population among the four categories. These inequality indices are computed for subsequent analysis in Section 4. Here, empirical findings concerning the relationship between total inequality and individual inequality indices for EZ countries are presented. The analysis covers the period from 1995 to 2024, which is divided into two subperiods: Before and after the 2008–2009 financial crises. The econometric investigation is conducted with panel data for the EZ countries that are classified into three groups: Northern, Southern, and Newcomers, comprising ex-communist countries. The chapter concludes with a summary and key conclusion in the final section.
2. Financial development, inequality, and growth: A theoretical perspective
During the last decades, we have witnessed an increased role of financial activity leading to transformations of economies and societies. According to Hein (2019), “Since the early 1980s, financialization has become an increasingly prominent feature in developed capitalist countries, with different timing, speed, and intensities in different countries” [1]. Financial openness has resulted in fundamental changes in the economic performance of the majority of economies globally, but it mostly tends to transform advanced economies [2, 3].
Among the several definitions, it has been argued that financialization is “the increasing importance of financial markets, financial motives, financial institutions, and financial elites in the operations of the economy and its governing institutions, both at the national and international levels” [4]. Additionally, [5] suggests that “Financialization refers to the increased influence of financial institutions and financial motives on non-financial activities” [5].
The impact of financialization on economic performance is explored, with potential effects on growth, income distribution, and inequality. Financialization improves access to financial resources which, consequently, may increase the income of the poorest, leading to a reduction of inequality [6]. While financial development can benefit economic growth and reduce poverty by providing access to financial resources, it may also contribute to increased inequality, especially benefiting the wealthy. Financial development may disproportionately benefit the wealthy, who already have higher access to financial systems, leading to increased inequality and the perpetuation of disparities in economic opportunities [7]. As it has been argued, financialization affects income distribution mainly in favor of profits and high wages, leading to falling wage shares and increasing wage inequality [1]. According to the International Labor Organization (ILO), although without econometric evidence, financial globalization has contributed to the decline of wage shares [8].
The poorly managed financial system is highlighted as a potential source of higher inequality and a risk factor for financial crises and economic slowdowns. Financialization has been related to the increased indebtedness of households, financial deregulation, increased volatility of asset prices, short-termism of financial institutions, and weaker bargaining power of labor [9]. Furthermore, it has been suggested that financialization has affected both households and firms, mainly due to rising debt and shareholder value orientation, respectively [10].
Moreover, financialization has led to the deregulation and liberalization of labor and financial markets, the downsizing of the public sector, the privatization of public enterprises, the break-up of labor rights, which has been connected with the rising power of finance, and has contributed to a decrease in wage shares [11]. Additionally, financialization has contributed to distribution changes due to an increase in the income of top management, hostile takeovers and mergers, and the liberalization of international trade and international finance [12, 13]. Hence, although financial development should help to reduce inequality, a poorly managed financial system can potentially be a source of higher inequality [14]. Additionally, while resource shifts from low-return, stagnant sectors to dynamic, entrepreneurial sectors may result in decreased efficiency, the co-evolution of financing and technical progress can also lead to instabilities that impede economic growth, as Minsky suggested [15].
2.1 Financial development – Financialization and income inequality
There are four main reasons why financial development could affect income distribution and inequality. Firstly, due to changes in the sectoral composition of the economy and the effects of short-termism; secondly, financial development has an impact on income distribution and inequality due to easier credit access; thirdly, due to the growth models that emerge from financialization; and finally, because of the crises that emerge. Additionally, inequality can lead to economic instability and economic crisis due to financialization. This happens due to unmanageable debt and current account instabilities that emerge through the growth models that have been adopted.
2.2 Sectoral composition and short-termism
The most significant impact of financialization is the elevation of the position of the financial sector in relation to the real sector [2, 16]. Changes in sectoral composition have a significant impact on both income distribution and income. The income transfer between sectors can be related to increasing inequality and wage stagnation [2, 17].
The dominance of the financial sector affects factor distribution, leading to a rise in profits, particularly financial profits [18, 19]. This also affects profit inequality among individuals who choose to invest in real sectors and those who prefer to invest in financial sectors. Financialization results in a shift from long-term investment to shareholder value maximization, impacting functional distribution and growth. Short-termism and sectoral shifts hinder capital stock investment and reduce economic growth [1, 18, 20, 21, 22].
2.3 Credit
Improved credit access, influenced by financial development, can either alleviate or exacerbate income inequality. In situations of financial underdevelopment, where credit is limited for certain income classes, lower-income groups face challenges in investing in education or starting businesses, perpetuating poverty. This inability to gradually invest in larger projects means that low-income individuals cannot move to higher income levels, leading to low-income mobility [23]. Inequality is related to growth because of financialization, with credit availability playing a crucial role in this relationship [24, 25, 26]. Financial constraints hinder capital allocation efficiency and limit productive investments, impacting economic growth.
Financially developed countries, on the other hand, may experience reduced inequality as lower-income groups gain better credit access, promoting investment in human and physical capital, and subsequently fostering economic growth. It has been argued that financial development reduces income inequality due to changes in financial standards and the introduction of new financial instruments, resulting in improved credit access for low-income households and ultimately lower income inequality [21, 27, 28, 29]. However, the relationship between inequality and credit availability is intricate and depends on the quality of regulation and supervision [14]. The complex interplay between credit availability, inequality, and economic dynamics underscores the importance of financial development in shaping income distribution and growth trajectories.
2.4 Debt
While increased credit accessibility can offset deficiencies in domestic demand, it poses risks if not used wisely. Additionally, it has been argued that financial liberalization has increased consumer credit, which has “compensated” for the adverse impact of reduced wages on consumption, thus mitigating the decline in consumption compared to income reduction [30, 31, 32]. As argued, the mounting debt of the poorest households over the past decades was a result of their attempts to uphold an elevated living standard in their society while their real incomes remained stagnant [33]. Moreover, it is suggested that a portion of the accumulated debt observed could be due to stagnant or declining wages, with workers striving to maintain their consumption norms [3].
The evolution of borrowing norms, driven by market deregulation and global finance, has led to consumption driven by credit, particularly for lower-income households facing stagnant wages. Several studies have provided evidence of a positive relationship between inequality and private household debt [34, 35, 36, 37]. This debt-driven consumption can temporarily stimulate growth but may lead to unmanageable debt in the long run. While credit can address short-term demand issues, it comes with potential long-term challenges related to debt and inequality.
2.5 Growth models
Financialization has led to two distinct economic growth models: Debt-led growth, relying on debt-financed consumption, and export-led growth, prioritizing exports to compensate for weak domestic demand. Changes in national financial systems have led some countries to counter potentially stagnant demand by generating demand through debt-financed consumption, creating a debt-led growth model where wage growth is substituted by household debt [3, 21, 38]. In terms of consumption, credit has acted as a solution to counter the weakened aggregate demand stemming from wage stagnation. Debt-driven consumption has been considered a response to reduced aggregate demand caused by declining wage shares in various advanced and emerging economies such as the United States, United Kingdom, Spain, Ireland, Turkey, and South Africa leading up to the Great Recession [39].
Financialization contributes to current account deficits, particularly in financially developed economies, creating a link between debt-driven models, inequality, and economic imbalances. Ref. [16] asserts that one of the most conspicuous effects of financial development and recent international financial deregulation is that countries have been permitted to sustain larger current account deficits over extended periods. Therefore, although financialization has led to debt-led growth models relying on debt-financed consumption to compensate for depressed demand when wage shares fall, some economies may adopt different strategies to adapt to weaker domestic demand.
Instead of increasing household debt, several countries have accepted stagnation in domestic demand and focused on exports to achieve growth. These economies choose to export products that cannot or are not well-suited for domestic markets to stimulate growth. This type of growth is referred to in the literature as export-driven growth [10]. Therefore, export-led growth models rely on exports as the driver of aggregate demand [21]. Therefore, if investment is positively affected by financialization while consumption increases at a slower rate, then an export-led growth model becomes a possibility [3, 21].
Credit restrictions and imperfect markets that limit credit accessibility for lower-income classes further necessitate an export-led economic model due to weak domestic consumption. Furthermore, it is argued that export-driven economies heavily depend on their trade partners due to their limited domestic financing capabilities [40, 41]. Thus, debt-led and export-driven growth models are interconnected because countries pursuing export-driven growth rely on the current account deficits of their trading partners [10, 42].
Countries like Germany, Japan, China, and the Netherlands have adopted this export-driven growth strategy, with lower domestic demand but higher exports [9, 21, 43, 44]. Countries that adopt an export-led growth model often end up with current account surpluses. These countries’ current account surpluses have been mirrored by current account deficits and increasing debt burdens in other nations.
Thus, while under debt-led growth models, income inequality tends to result in current account deficits, in economies where individuals are constrained from responding to declining wages through borrowing, income inequality often translates into current account surpluses [45]. Moreover, while both debt-led and export-led growth models may result in economic expansion, they typically coincide with increased debt levels, either within the domestic private sector, in debt-led regimes, or within the trade partner’s economy, in export-led regimes [41]. Additionally, income inequality appears to widen due to wage stagnation, as economic growth becomes less linked to income distribution and more associated with credit. However, the specific factors that lead a country to opt for either a debt-driven growth model characterized by consumption booms and current account deficits or an export-driven growth model marked by subdued domestic consumption and current account surpluses remain somewhat unclear [16, 43].
Global current account imbalances are linked to increased worldwide inequality, impacting economic growth under both models. The coexistence of these models within an economy makes predicting dominance challenging, and similar inequality levels may be observed across countries with differing growth drivers. The interplay between debt and export-driven models can lead to instability and crises. The fact that debt and export-driven growth models are complementary often leads to high household debts, international imbalances, and international debt [42]. As has been suggested, global current account imbalances were associated with the 2007 financial crisis [38, 46, 47].
2.6 Crisis
Financial development is seen as a key crisis cause, linked to tepid economic growth and increased fragility in the era of financialization [2].
New financial instruments and norms, while potentially stabilizing demand, may lead to unsustainable growth and financial instability due to rising household debt.
Lending for consumption and housing can result in unmanageable debts, creating housing bubbles and unstable growth [48].
Inequality exacerbates credit bubbles and raises the risk of financial crises [49]. Inequality affects growth stability, with debt regimes from financialization expected to lead to weak long-term growth and heightened inequality, ending in economic instability [50]. Increasing inequality is linked to higher financial risks when credit expansion coincides with it, potentially leading to unsustainable economic growth and crises.
Financial deregulation interacting with rising inequality causes economic imbalances, resulting in a debt-led growth model with higher debt associated with instability and a higher probability of banking crises. The crisis tied to debt-driven consumption and international imbalances stems from financial liberalization and income distribution polarization [3]. Attempts to address inequality through credit access for lower incomes may backfire without proper financial sector regulation, risking economic instability. Debt-related issues during the recent financial crisis emerged from unequal distributions, contributing to instability [33, 51]. In Anglo-Saxon countries, debt-driven consumption, often with real estate bubbles, became a primary demand driver [3].
There’s a trade-off between short-term growth benefits and temporary inequality reduction through debt and long-term costs of financial stability and persistent inequality. Stimulating consumption through debt, if unchecked, can lead to unsustainable debt levels and non-viable growth, impacting global imbalances and causing economic crises [9]. Both debt and export-led growth models relying on increasing debt ratios may become unsustainable due to financial deregulation allowing larger current account deficits. Financialization’s impact on capital markets and accounts, facilitating persistent deficits and financial fragility, is evident [18, 43].
Financialization is linked to weaker long-term growth and increased inequality due to changes in the financial structure and secular debt expansion. Financial liberalization prevents an immediate consumption reduction but results in domestic debt, higher debt servicing, and reduced future consumption [45]. Investment decline due to financialization is observed, mainly because rentiers prefer lending over investing [52, 53]. Financialization encourages consumption through debt but may reduce real investment, leading to output growth volatility. Financial deregulation is associated with the 2008 crisis, where financialization and rising inequality interacted [3]. Personal and functional inequality increased before the crisis in most countries [54]. Inequality’s role in the 2008 crisis, particularly household indebtedness, is widely acknowledged [21, 55]. Excessive credit contributing to the 2007–2008 crisis resulted from financialization, political interventions, and mortgages to low-income households [14].
Income inequality before the crisis influenced household savings and current account balances [45, 56]. Rising inequality globally, including in the USA, the UK, and European countries, contributed to unsustainable debt and current account deficits [9, 45].
Financial crises have long-term effects on income distribution in emerging nations, exacerbating inequality during a crisis [57]. Lower-income households are likely to suffer more during financial crises [58, 59]. For instance, in the United States, unemployment increased during the 2009 financial crisis while financial elites continued to earn high incomes [15].
3. Inequality indices, financialization, and growth
The theoretical framework presented in this section establishes a connection between inequality, financialization, and growth. Our objective is to calculate inequality indices based on their theoretical underpinnings, using statistical data.
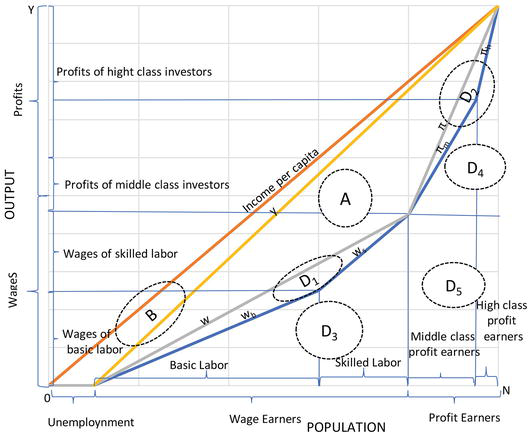
Firstly, it is assumed that the economy consists of four income classes. The first two classes are the class of basic labor workers, Lb,and the class of skilled workers, Ls and labor, L, is equal to the sum of these two classes:
L=Lb+LsE1
It is assumed that the two different types of labor have varying labor productivities. Basic labor consists of workers with basic education and corresponding labor productivity denoted as Ab=YLb. Skilled labor comprises highly educated workers with labor productivity denoted as As=YLs. Differences in labor productivity among workers may depend on factors such as their education, experience, or the sector in which they work. Consequently, it is assumed that these two types of labor receive different wages wbws, resulting in the average income of basic labor being lower than that of skilled labor wb<ws. Both income classes constitute the income class of workers, and their income comes from wages.
The other two income classes which constitute the income class of capital owners, or, investors, are the high-class investors, Zh, and the middle-class investors, Zm, and
Z=Zh+ZmE2
It is assumed that the population of high-class investors, Zh, remains relatively stable over time and represents the dominant group of investors. Changes in the population of middle-class investors, Zm, depend on factors such as market openness, barriers set by other firms, or the required initial capital needed to establish a firm. It is assumed that the average income of high-class investors exceeds that of middle-class investors, πh>πm. The income of both classes comes from investing on the real or/and the financial sector.
The distribution of total income can be illustrated using a Lorenz-like curve, as depicted in Figure 1. In this graph, the horizontal axis measures population, N, from the poorest to the wealthiest individual, while the vertical axis indicates income levels. The Lorenz curve illustrates the cumulative income earned by segments of the population. Perfect equality is achieved when the Lorenz curve aligns with the diagonal line of the rectangle, as shown in Figure 1, In this scenario, the Lorenz curve aligns with the diagonal line. To measure inequality, we employ the GINI index, which is calculated as the ratio of the area between the Lorenz curve and the diagonal line to the area of the lower triangle formed by the diagonal and the two axes. A detailed derivation of the GINI index is described in the thesis [60].
Figure 1.
The Lorenz curve and income distribution.
Hence, if all employed individuals, T, earn an average personal income denoted by y, total income is denoted by Y, and the unemployed population, (N-T) earns no income, the inequality index between unemployed and employed population, InequalityU, can be estimated using the following relation:
From Eq. (3), we infer that InequalityU is equal to the unemployment rate.
Accordingly, if all workers receive an average wage w, and all investors receive an average profit income π, the factor inequality index, which measures inequality between profit and wage earners, InequalityF index, is estimated as the share of the corresponding areas shown in Figure 1.
where L is the number workers, W is the sum of all wages.
Thus, according to Eq. (4), factor inequality is expressed as the difference between the wage share,WY, and the ratio of workers to the employed population, LT . Financial development, as explained earlier in Section 2, exerts a positive impact on economic growth, yet concurrently elevates the proportion of profits in total income. Therefore, the share of wages, WY, diminishes with financialization. Consequently, financialization increases both factor inequality and total inequality as the economy grows.
In Eq. (5), the wage share is defined as the ratio of real average wages, wr to labor productivity, AL. It becomes evident that financial development that triggers economic growth, also increases factor inequality when the productivity of labor, AL, increases at a faster pace than the average real wage rate, wr. In such circumstances, both factor and total inequality increase, holding all other factors constant. Conversely, if anarchic or unregulated financial development leads to a financial crisis, the opposite effects ensue: A recession accompanies a reduction in both factor and total inequality.
If we analyze the categories of workers individually, assuming that all skilled workers receive the same average wage ws, which is higher than the average wage wb earned by basic workers, the index of labor inequality is estimated as the share of corresponding areas of Figure 1:
where qL=wswb is the income premium of skilled labor and LbLs is the ratio of basic to skilled labor. According to Eq. (6), labor inequality is a function of the income premium of skilled labor and the ratio of basic to skilled labor. Calculating the partial derivative of InequalityL with respect to qL and then with respect to LbLs suggests that the effect of qL on labor inequality index is positive, while the effect of LbLs is negative. The effect of an increase in financial development exerts a positive impact on economic growth as explained, and presumably a positive effect on the premium of skilled labor, and a negative effect on LbLs. If our hypotheses are correct, financialization and economic growth lead to increased labor inequality. As a result, financial development results in higher levels of both labor inequality and total inequality, as the economy grows.
Similarly, assuming -as mentioned earlier in this section- that all high-class investors receive the same average profit income πh, which is higher than the average profit income of the class of the middle-class investors who receive the same average profit income πm, the profit InequalityK index is estimated as the share of corresponding areas of Figure 1:
Where qK=πhπmis the income premium of high−class investorsandZmZh is the ratio of middle-class to high-class investors. The profit inequality index depends on the profit income premium, qK, and the ratio of middle to high-class investors. Calculating the partial derivative of InequalityK with respect to qK and then with respect to ZmZh suggests that the effect of qK on profit inequality index is positive, while the effect of ZmZh is negative. However, we are unable to predict the direction of the effect of financialization, growth, or recession on the income premium of high-class investors and the ratio of middle-class to high-class investors.
The total inequality index is the sum of the unemployment index and the corresponding share of areas depicted in Figure 1. Consequently, the calculation of inequality involves the combination of indices Eq. (3) through Eq. (7):
From Eq. (8) we can see that unemployment, factor inequality index, and labor inequality index are all related positively to total inequality. The effect of profit inequality is ambiguous.
This section focuses on providing empirical evidence for the determinants of inequality and their relationship with economic growth, as well as the impact of financial development. The specific context for this analysis is the EZ, which is considered a suitable environment for testing the connection between financialization, inequality, and growth in an integrated setting. The study employs panel data analysis, utilizing data from EZ countries spanning the period from 1995 to 2020. Furthermore, the period is divided into two distinct sub-periods: 1995–2007, the pre-crisis period characterized by expanding economies and increasing financialization, and 2008–2020, the post-crisis period, which includes years of recession for almost all countries in our sample.
The countries are grouped into three categories: The Northern, the Southern, and the Newcomers, based on their economic characteristics, history, and employed growth model. The Northern countries comprise Austria, Belgium, Finland, France, Germany, Luxembourg, and the Netherlands. The Southern group includes Cyprus, Greece, Ireland, Italy, Portugal, and Spain. The Southern countries experienced more severe impacts from the economic crisis of 2008–2009 compared to the Northern group. Additionally, these countries were compelled to implement austerity programs, either imposed by external lenders such as the International Monetary Fund (IMF) and other EZ countries (as was the case with Greece, Portugal, Ireland, and Cyprus), or by their own governments (as in the cases of Spain and Italy), in order to address the economic crisis, which affected them with some delay. The third group consists of countries originating from the ex-communist bloc, which joined the EZ at a later date than the original 15 countries. These countries include Estonia, Latvia, Lithuania, Slovakia, and Slovenia.
For the empirical investigation panel data analysis is chosen as it is particularly suitable when dealing with data heterogeneity and the need to control for time-invariant variables. The general model is represented by Eq. (9), where Yit stands for the dependent variable, and Xit′ represents the set of explanatory variables. In this context, the subscript “i” corresponds to individual countries, and the subscript “t” pertains to time periods. In Eq. (9), the constant term for each country is denoted by a1it,the term bit represents the unknown intercept for each country, and uit signifies the error term.
Yit=a1it+a2Xit′+bit+uitE9
Yi is the inequality index for each country in our sample. Xit is a vector that includes the explanatory variables, which are the inequality indices for factor, labor, profit, and unemployment, for all countries. The inequality indices are calculated using the formulas derived in Section 3, with data sourced from AMECO1 and WID2.
As demonstrated in the analysis of Section 3, all explanatory variables are expected to have a positive effect on the dependent variables, except for the effect of InequalityK, which is ambiguous. Eq. (9) is estimated for the two sub-periods, for the EZ countries. Then, Eq. (9) is estimated for the two sub-periods for each group of countries, namely the Northern, Southern, and Newcomers.
The econometric analysis encompassed a range of panel data regressions utilizing various methods, including fixed effects, random effects, pooled OLS, and the Arellano and Bond GMM approach. Both fixed and random effects methods for panel data have been applied to address potential heterogeneity arising from unobservable social and institutional variables. Additionally, the pooled ordinary least squares (OLS) method has been employed to augment the body of evidence. To account for endogeneity and potential dynamic effects, the generalized method of moments (GMM) method, proposed by Arellano & Bond in 1991, has been employed. The significance of the results has been corrected for heteroskedasticity and autocorrelation using a robust variance-covariance estimator (VCE) model. Furthermore, the appropriateness of the fixed random and pooled OLS methods has been tested using the Hausman and Breusch-Pagan tests. The presence of multicollinearity issues has been also examined.
4.2 The estimation results
The estimation results of Eq. (9) derived from the methods described are very similar, so we have decided to include the results of the fixed effect method in this chapter. Table 1 presents the results of the estimation of Eq. (9) for all EZ countries for the years 1995–2007 and 2008–2020. The estimation results for the three groups of countries for the two sub periods are shown in Table 2.
Depended variable: Total inequality Panel data analysis with panel fixed effect method
Estimation of total inequality for the northern, southern, and newcomer EZ countries: 1995–2007, 2008–2020.
significant at the 1% level of significance.
significant at the 5% level of significance.
significant at the 10% level of significance.
The first general finding from the estimated results of Tables 1 and 2 is that, as expected, all explanatory variables have a positive effect on the total inequality index, for all country groups, for the two sub-periods. More specifically, it is noted that the effect of factor inequality, InequalityF, on total inequality is stronger than all other effects in all cases. Interestingly, the effect is weaker during the post-crisis period, for all EZ counties as well as for the three groups, as observed from collum (2) of Table 1, and columns (2), (4), and (6) of Table 2, implying that the crisis and recession contributed to lower total inequality. In other words, recession and inverse financial development during the post-crisis period led to lower InequalityF which had a weaker effect on total inequality. The reduction in the InequalityF index during the post-crisis period can be explained using Eq. (5) if we assume that the ratio wrAL decreases. This decrease may occur because the productivity of labor, AL, decreases by less than the average real wage rate, wr,and because the ratio of wage earners to total employment, L/T, falls.
Compared to the effect of the factor inequality index, the effect of the index of labor inequality is lower in all cases. Nonetheless, the effect of InequalityL becomes stronger during the post-crisis period for the three groups of countries compared to the effect of the pre-crisis period. Interestingly, the effect becomes stronger by just 3% in Northern and Southern countries, while for the Newcomers, the effect on total inequality is stronger by 42%, as observed by comparing the results of columns (1), (3), and (5) to those of columns (2), (4), and (6) in Table 2. Hence, labor inequality that increased during the post-crisis period intensified total inequality, especially in the case of the countries belonging to the group of Newcomers.
The profit inequality index, InequalityK, has a positive effect on total inequality, as observed in Tables 1 and 2. The effect is weaker during the post-crisis period compared to the pre-crisis period in all cases. This can be explained by the fact that during the post-crisis period, the profit inequality index was reduced due to a lower profit premium for high-class investors and a reduction in the ratio of middle-class to high-class investors.
The unemployment inequality index, InequalityU, which is equal to the unemployment rate as shown in Eq. (1), has the second strongest effect on total inequality behind the factor inequality index, for all cases in Tables 1 and 2. However, it is also observed from Table 2 that, for the Northern and Southern countries, the effect of InequalityU becomes weaker during the post-crisis period. In these two groups of countries, increased unemployment during the post-crisis period leads to a weaker effect on total inequality compared to the pre-crisis period. In other words, increased unemployment during the post-crisis period decreased inequality, except for the countries in the Newcomers group. In this case, the effect of InequalityU on total inequality becomes stronger, as observed in Table 2, column (6), and inequality is intensified among Newcomers.
Overall, it is observed from Table 2 that the three country groups exhibit different behaviors regarding the effect of inequality in factor, labor, profit, and unemployment indices on total unemployment. Despite this, the estimated results for the Northern and Southern countries are quite similar, while the estimated coefficients for the Newcomers differ from those of the other two groups. This implies that policy recommendations for reducing inequality in Northern and Southern countries could be similar or very close despite their differences.
The objective of this chapter is to establish the theoretical underpinnings and empirically investigate the relationship between financialization, growth, and inequality. Ultimately, the aim is to derive policy implications for countries within the EZ from this analysis. Consequently, after the introduction, Section 2 reviews the contemporary theoretical aspects on the interaction between financial expansion, inequality, and economic growth. The influence of financialization on both inequality and growth is contingent upon factors such as a nation’s developmental stage and institutional setup. Moreover, unregulated financialization can precipitate financial crises.
In Section 3, we analyze inequality indices derived from the Lorenz curve and the Gini index, categorizing the population into two groups of workers and two groups of investors. These indices serve as the basis for our subsequent analysis in Section 4, where we present empirical findings regarding the relation between total inequality and individual inequality indices for EZ countries. Our investigation spans the period from 1995 to 2024, divided into two subperiods: Pre and post the 2008–2009 financial crises. Utilizing panel data analysis, we classify EZ countries into three distinct groups: Northern, Southern, and Newcomers, which include ex-communist nations.
Based on both theoretical analysis and empirical findings, it can be concluded that the period of financial expansion and growth before the crisis led to increased inequality. Moreover, the unregulated increase in financialization led to increased private and government borrowing, eventually culminating in the financial crisis of 2008–2009. Subsequently, during the post-crisis period, there was a reversal in financial expansion, and most EZ countries found themselves trapped in a vicious cycle of recession, before beginning to recover. The empirical findings reveal that all explanatory variables have a positive effect on the total inequality index across all country groups and sub-periods. Notably, the impact of factor inequality (InequalityF) on total inequality is consistently stronger than that of other factors. However, this effect weakens during the post-crisis period, suggesting that the financial crisis and subsequent recession contributed to a decrease in total inequality. In other words, equality improved during the post-crisis period due to lower factor inequality. It can be assumed that this reduction in factor inequality occurred because the average real wage decreased more than the reduction in labor productivity.
In all cases, the impact of the labor inequality index (InequalityL) is lower compared to the factor inequality index. However, during the post-crisis period, the effect of InequalityL strengthens across all country groups, with a notable increase observed in Newcomers, indicating a 42% stronger effect compared to pre-crisis levels. This increase in labor inequality contributes to intensified total inequality, particularly pronounced among Newcomers.
The profit inequality index, InequalityK, positively affects total inequality. However, its impact weakens during the post-crisis period compared to pre-crisis levels. This decline can be attributed to a reduction in the profit premium for high-class investors and a decrease in the ratio of middle-class to high-class investors.
The unemployment inequality index, InequalityU, equal to the employment ratio, ranks second in its impact on total inequality, However, during the post-crisis period, its effect weakens in Northern and Southern countries, resulting in reduced inequality due to increased unemployment. Conversely, among Newcomers, the effect of InequalityU strengthens during the post-crisis period, intensifying inequality.
Hence, to mitigate inequality, it is crucial to maintain low levels of unemployment. Research by other scholars, such as [60], underscores the significance of investing in research and development, as well as promoting trade openness and attracting foreign direct investment.
In addition, effective regulation of financial development is essential to prevent various forms of crises, including sub-prime loan crises, government bond crises, debt crises, external sector crises, and stock market crises, which can intensify inequality. Establishing a robust institutional framework for the international financial system is crucial in this regard. Governments should adhere to rules ensuring low debt-to-GDP ratios that are sustainable for the economy, along with maintaining sound public finances. Furthermore, maintaining an intertemporal current account balance is vital for fostering economic stability and reducing inequality.
Furthermore, to progress toward reduced inequality and social cohesion it is crucial for the profits of all investors and the wages of both skilled and unskilled labor to increase proportionately. Government intervention plays a critical role in ensuring equitable growth, as taxation policies should not restrain incentives for innovation, investment, or even consumption. Additionally, facilitating the transition of unskilled labor to skilled labor is of vital importance, as it enhances productivity and enables higher wages for all workers.
References
1.Hein E, Dünhaupt P. Financialization, distribution, and macroeconomic regimes before and after the crisis: A postKeynesian view on Denmark, Estonia, and Latvia. Journal of Baltic Studies. 2019;50(4):435-465. DOI: 10.1080/01629778.2019.1680403
2.Palley TI. Financialization: What It Is and Why It Matters. In: Financialization. Washington, D.C., London: Palgrave Macmillan. 2013. pp. 17-40. DOI: 10.1057/9781137265821_2
3.Stockhammer E. Financialization, income distribution and the crisis. Investigación Económica. 2012;71:39-70. Available from: https://www.taylorfrancis.com/chapters/edit/10.4324/9780203109137-7/financialization-income-distribution-crisis-engelbert-stockhammer
4.Epstein G. Financialization, Rentier Interests, and Central Bank Policy. Amherst: University of Massachusetts; 2001. Available from: https://peri.umass.edu/fileadmin/pdf/financial/fin_Epstein.pdf
5.Stockhammer E. Determinants of Functional Income Distribution in OECD Countries 2009. Available from: http://hdl.handle.net/10419/106229
6.Beck T, Demirgüç-Kunt A, Levine R. Finance, Inequality and the Poor. 2007;12:27-49. DOI: 10.1007/s10887-007-9010-6
7.Greenwood J, Jovanovic B. Financial Development, Growth, and the Distribution of Income. The Journal of Political Economy. 1990;98:1076-107. DOI: 10.1086/261720
8.International Labour Organization (ILO). World of Work Report. Income Inequalities in the Age of Financial Globalization. Geneva: ILO; 2008
9.Zeman J. Income distribution and economic growth: Empirical results for Slovakia. Ekonomický časopis. 2019;67:459-480. Available from: https://www.ceeol.com/search/article-detail?id=780206
10.Stockhammer E, List L, Durand C. European Growth Models and Working Class Restructuring before the Crisis. London: Post Keynesian Economics Study Group; 2015. Available from: https://ideas.repec.org/p/pke/wpaper/pkwp1508.html
11.Dünhaupt P. Determinants of Functional Income Distribution: Theory and Empirical Evidence. International Labour Organization. 2013. Available from: https://www.econstor.eu/handle/10419/96398
12.Hein E. Finance-dominated capitalism and redistribution of income: A Kaleckian perspective. In: Work Pap No 746 Levy Econ Inst Bard. Cambridge Journal of Economics Cambridge. 2013. DOI: 10.1093/cje/bet038
13.Tridico P, Pariboni R. Inequality, financialization, and economic decline. Journal of Post Keynesian Economics. 2017;41:236-259. DOI: 10.1080/01603477.2017.1338966
14.Čihák M, Sahay R, Barajas A, Chen S, Fouejieu A, Xie P. Finance and Inequality. Washington: IMF; 2020. DOI: 10.1016/j.jce.2007.07.002
15.Zalewski DA, Whalen CJ. Financialization and income inequality: A post Keynesian institutionalist analysis. Journal of Economic Issues. 2010;44:757-777. DOI: 10.2753/JEI0021-3624440309
16.Stockhammer E. Rising Inequality as a Root Cause of the Present Crisis. Massachusetts: Political Economy Research Institute; 2012
17.Ivanova MN. Inequality, financialization, and the US current account deficit. Industrial and Corporate Change. 2019;28:707-724. DOI: 10.1093/icc/dtz
18.Hein E. Distribution and Growth after Keynes. A Post-Keynesian Guide. Massachusetts: Edward Elgar Publishing Limited; 2014
19.Stockhammer E. Determinants of the wage share. A panel analysis of advanced and developing economies. British Journal of Industrial Relations. 2017;55:3-33. DOI: 10.1111/bjir.12165
20.Hein E. The crisis of finance-dominated capitalism in the euro area, deficiencies in the economic policy architecture, and deflationary stagnation policies. Journal of Post Keynesian Economics. 2013;36:325-354
21.Detzer D. Inequality, emulation and debt: The occurrence of different growth regimes in the age of financialization in a stock-flow consistent model. Journal of Post Keynesian Economics. 2018;41:284-315. DOI: 10.1080/01603477.2017.1387499
22.Hein E. Distribution, ‘Financialisation’ and the Financial and Economic Crisis –Implications for Post-Crisis Economic Policies. Berlin: Berlin School of Economics and Law and Institute for International Political Economy (IPE); 2011. Available from: http://hdl.handle.net/10419/59307
23.Piketty T. Theories of persistent inequality and intergenerational mobility. Elsevier Science B V. 2000;1:429-476. DOI: 10.1016/S1574-0056(00)80011-1
24.Galor O. Zeira J. Income distribution and macroeconomics. The Review of Economic Studies. 1993;60:35-52. DOI: 10.2307/2297811
25.Piketty T. The dynamics of the wealth distribution and the interest rate with credit rationing. The Review of Economic Studies. 1997;64:173-89. DOI: 10.2307/2971708
26.Aghion P, Bolton P. A theory of trickle-down growth and development. The Review of Economic Studies. 1997;64:151-172. DOI: 10.2307/2971707
27.Clarke GRG, Xu LC, Zou H-F. Finance and income inequality: What do the data tell us? Southern Economic Association. 2006;72:578-596. DOI: 10.1002/j.2325-8012.2006.tb00721.x
28.Mookerjee R, Kalipioni P. Availability of financial services and income inequality: The evidence from many countries. 2010:404-408. DOI: 10.1016/j.ememar.2010.07.001
29.Kim J-H. A study on the effect of financial inclusion on the relationship between income inequality and economic growth. Emerging Markets Finance and Trade. 2016;52:498-512. DOI: 10.1080/1540496X.2016.1110467
30.Krueger D, Perri F. Does Income Inequality Lead to Consumption Inequality? Evidence and Theory 2006;73:163-193. DOI: 10.1111/j.1467-937X.2006.00373.x
31.Heathcote J, Perri F, Violante G. Unequal we stand: An empirical analysis of economic inequality in the United States. Review of Economic Dynamics. 2010;13:15-51. DOI: 10.1016/j. red.2009.10.010
32.Gu X, Dong B, Huang B. Inequality, saving and global imbalances: A new theory with evidence from OECD and Asian countries. The World Economy 2014;38:110-135. DOI: 10.1111/twec.12188
33.Stiglitz J. Inequality and Economic Growth. New Jersey: Wiley-Blackwell; 2016. DOI: 10.7916/ d8-gjpw-1v31
34.Iacoviello M. Household debt and income inequality, 1963–2003. Journal of Money, Credit and Banking. 2008;40:930-965. DOI: 10.1111/j.1538-4616.2008.00142.x
35.Cynamon BZ, Fazzari SM. Household debt in the consumer age: Source of growth – Risk of collapse. Capitalism and Society. 2008;2:1-30. DOI: 10.2202/1932-0213.1037
36.Mian A, Sufi A. The consequences of mortgage credit expansion: Evidence from the U.S. mortgage default crisis. The Quarterly Journal of Economics. 2008:124:1449-1496. DOI: 10.1162/qjec.2009.124.4.1449
37.Frank RH, Levine AS, Dijk O. Expenditure Cascades. Review of Behavioral Economics. 2014;1:55-73. DOI: 10.2139/ssrn.1690612
38.Pivetti M, Barba A. Rising household debt: Its causes and macroeconomic implications—A long-period analysis. Cambridge Journal of Economics. 2009;33:113-137. DOI: 10.1093/cje/ben030
39.Onaran O. Equality-led development and the demand- and supply-side effects. International Institute of Social Studies. 2019;50:445-457. DOI: 10.1111/dech.12488
40.Karwowski E, Shabani M, Stockhammer E. Financialization: Dimensions and Determinants. A Cross-Country Study. 2017. Available from: https://ideas.repec.org/p/ris/kngedp/2017_001.html
41.Stockhammer E, Kohler K. Financialization and Demand Regimes in Advanced Economies. New York: Post-Keynesian Economics Society; 2019
42.Goda T, Onaran Ö, Stockhammer E. Income inequality and wealth concentration in the recent crisis. Development and Change. 2016;48:3-27. DOI: 10.1111/dech.12280
43.Belabed CA, Treeck TT, Van T. Income distribution and current account imbalances. Cambridge Journal of Economics. 2017;42:47-94. DOI: 10.1093/cje/bew052
44.Behringer J, Treeck T van. Income distribution and the current account. Journal of International Economics. 2018;114:238-254. DOI: 10.1016/j.jinteco.2018.06.006
45.Kumhof M, Lebarz C, Rancière R, Throckmorton AWR, Nathaniel A. Income inequality and current account imbalances. Washington, DC: International Monetary Fund; 2012
46.Caballero RJ, Farhi E, Gourinchas P-O. An equilibrium model of “global imbalances” and low interest rates. American Economic Review. 2008;1:358-393. Available from: https://www.aeaweb.org/articles?id=10.1257/aer.98.1.358
47.Obstfeld M, Rogoff K. Global Imbalances and the Financial Crisis: Products of Common Causes. London: Centre for Economic Policy Research; 2009. Available from: https://papers.ssrn.com/sol3/papers.cfm?abstract_id=1533211
48.Manea S, Wildauer ÖO, Rafael. The Impact of Fiscal Policy, Income and Wealth Inequality, Financialization and the Housing Market on Growth. Greenwich: University of Greenwich; 2019. Available from: https://www.boeckler.de/pdf/v_2019_10_25_manea.pdf
49.Bazillier R, Hericourt J. The circular relationship between inequality, leverage, and financial crises. 2017;2:463-496. DOI: 10.1111/joes.12150
50.Onaran Ö, Galanis G. Is Aggregate Demand Wage-Led? National and Global Effects. Cond. Work Employ. Ser. No 40. Geneva: International Labour Office. DOI: 10.1057/9781137357939_4
51.Galbraith KJ. Inequality and Instability: A Study of the World Economy Just before the Great Crisis. New York: Oxford University Press; 2012
52.Orhangazi O. Financialisation and capital accumulation in the non-financial corporate sector: A theoretical and empirical investigation on the US economy: 1973–2003. Cambridge Journal of Economics. 2008;32:863-886. DOI: 10.1093/cje/ben009
53.Tori D, Onaran Ö. Financialization, financial development and investment. Evidence from european non-financial corporations. Socio-Economic Review. 2018;18:681-718. DOI: 10.1093/ser/mwy044
54.Dodig N, Hein E, Detzer D. Financialisation and the Financial and Economic Crises: Theoretical Framework and Empirical Analysis for 15 Countries. Massachusetts: Edward Elgar Publishing; 2016
55.Rajan RG. Fault Lines: How Hidden Fractures Still Threaten the World Economy. Princeton: Princeton University Press; 2010. Available from: http://capitolreader.com/Partners/Political%20Wire---Faultlines.pdf
56.Behringer J, Treeck T van. Income distribution and the current account: A sectoral perspective. Journal of International Economics. 2015;114:238-254. DOI: 10.1016/j.jinteco.2018.06.006
57.Onaran Ö. Wage share, globalization, and crisis: The case of manufacturing ndustry in Korea, Mexico, and Turkey. International Review of Applied Economics. 2009;23:113-134. DOI: 10.1080/02692170802700435
58.Kuttner R. The Squandering of America: How the Failure of our Politics Undermines our Prosperity. New York: Knopf, Alfred A; 2007
59.Wray LR. Minsky’s Approach to Employment Policy and Poverty: Employer of Last Resort and the War on Poverty. New York: The Levy Economics Institute of Bard College; 2007. DOI: 10.2139/ssrn.1014163
60.Kyriakopoulos A. Income Inequality, Economic Growth and Financial Integration [Thesis]. Athens: National & Kapodistrian University of Athens; 2023