Open Access is an initiative that aims to make scientific research freely available to all. To date our community has made over 100 million downloads. It’s based on principles of collaboration, unobstructed discovery, and, most importantly, scientific progression. As PhD students, we found it difficult to access the research we needed, so we decided to create a new Open Access publisher that levels the playing field for scientists across the world. How? By making research easy to access, and puts the academic needs of the researchers before the business interests of publishers.
We are a community of more than 103,000 authors and editors from 3,291 institutions spanning 160 countries, including Nobel Prize winners and some of the world’s most-cited researchers. Publishing on IntechOpen allows authors to earn citations and find new collaborators, meaning more people see your work not only from your own field of study, but from other related fields too.
Measuring the Environmental Impact and Uncertainty Analysis of Portland Cement Production in South Africa: A Recipe 2016 v 1.04 Endpoint Method Approach
Written By
Oluwafemi E. Ige, Kevin J. Duffy, Oludolapo A. Olanrewaju and Obiora C. Collins
Submitted: 10 December 2023Reviewed: 11 December 2023Published: 28 February 2024
The cement industry is among the growing industries globally that negatively impact human health and global warming due to various substances released into the water, air and soil. This impact and potential damage have been studied in several ways to understand their effects, but more details are still needed. This study examines the damage done by producing 1 kg of cement in South Africa using the Recipe 2016 endpoint method. It also conducted an uncertainty analysis using the Monte Carlo method to confirm and establish its credibility. The results showed that the clinkering stage causes the most damage to human health (49%) and ecosystems 60% due to large amounts of carbon dioxide emissions. The result showed high uncertainty in Water consumption, Human health, Water consumption, Terrestrial ecosystem, Aquatic ecosystems, Human carcinogenic toxicity and Ionizing radiation. These results align with existing literature but highlight the specific contributions of clinkering.
Department of Industrial Engineering, Durban University of Technology, Durban, South Africa
Institute of System Science, Durban University of Technology, Durban, South Africa
Kevin J. Duffy
Institute of System Science, Durban University of Technology, Durban, South Africa
Oludolapo A. Olanrewaju
Department of Industrial Engineering, Durban University of Technology, Durban, South Africa
Obiora C. Collins
Institute of System Science, Durban University of Technology, Durban, South Africa
*Address all correspondence to: phemmyigoh@yahoo.com
1. Introduction
The global state of energy is categorized by reducing fuel sources and environmental worries related to fossil fuel usage [1]. Although the global COVID-19 pandemic reduced carbon dioxide (CO2) emissions by 5.8% in 2020, carbon emissions are estimated to attain roughly similar atmospheric levels by 2023 [2]. In line with a three-year delay created by the economic recovery situation, energy demand will lag behind compared to pre-pandemic projections [3, 4]. Environmental protection has grown in popularity recently and has become an essential measure for social and political settings [5, 6]. The most sought-after goal is the reduction of greenhouse gas (GHG) emissions, for example, carbon dioxide (CO2), nitrous oxide (N2O) and methane (CH4) which contribute to the greenhouse effect in an energy-intensive industry such as cement [7]. Cement production is a multiplex process that uses large raw materials such as limestone, marl, clay and iron ore and various fuels such as coal, natural gas, fuel oil, petroleum coke and waste, heat and electricity. Cement production contributes to global warming through CO2 emission during the clinker production stage [8]. Cement is an essential material in the construction industry with high environmental impacts [9]. The global cement demand has risen due to rising population and urbanization. Cement production in 2016 was about 809 × 106 t, making it the most-used produced substance globally [10]. Also, global cement demand was expected to climb 4.5% per year to reach 5.2 Bmt in 2019 [11]. The cement production growth rate is projected to rise in the following years.
The main impact of cement production is GHGs emissions, excess resource use and energy (fossil fuel and electricity) [12]. The main components in Portland cement are calcium (limestone), silicate, iron and alumina. Gypsum is used to improve the setting time of cement [13]. CO2, CH4 and NOx are cement production’s most common GHG emissions [14]. Several Studies have indicated that the clinkering stage has the most significant impact, with CO2 being one of the most released gases [15, 16, 17]. Coal is the primary fuel (thermal) used in the combustion process, contributing to these GHGs. The impact of cement production is affected by the raw material specifications, fuel type, and technology used. Cement production contributes to about 5% of CO2 emissions, producing 0.81 kg CO2-eq for one ton of cement [18]. Due to this, cement production faces tremendous challenges in meeting global demand while reducing CO2 emissions. In modern cement industries, both wet and dry rotary kilns are used [19]. Growing concern over the capacity of the Earth to sustain economic development arose due to the increasing threat of harmful global environmental change and mismanagement problems. Many international groups and developed nations have recommended different strategies and measures to mitigate these effects, including green economy, green growth, green transformation, green industrial blueprint and sustainable transformation [20]. Since cement is one of the most vital products in the world, the damage caused by this industry must be critically analyzed. To properly recommend and provide mitigation strategies, it is necessary to measure cement production and its impact on human health, ecosystems and resources in the production stages. Various mitigation strategies were recommended, including partial clinker replacement, alternative fuel use, etc. [21]. Also included in the suggestions was adopting the BAT in cement production [15, 22, 23].
Furthermore, while it is crucial to accurately quantify and communicate uncertainties in Life cycle assessment (LCA) regarding input results to ensure accurate interpretation and use, LCA specialists still do not consider uncertainty when conducting their studies. Uncertainty analysis is a commonly used analytical method in LCA tools. It mainly addresses the uncertainty associated with measured parameters, such as inaccuracies in emissions measurements or normalization data and the variability observed among different sources and objects, such as diverse emissions from similar processes [24]. These methods are appropriate for assessing the impact of the uncertain parameter in the model’s output, thereby determining the overall accuracy of the model. Therefore, an effective LCA tool integrates uncertainty and variability analyses. Furthermore, a few studies have conducted an uncertainty analysis using a Monte Carlo simulation to determine the importance of the results in South African cement plants.
LCA is a critical assessment tool for analyzing the effects of all stages of product production, from raw extraction to the waste disposal finish [25]. This tool is of great significance when it is necessary to know the environmental impact of various production stages. The LCA tool can provide a comprehensive overview of the whole product life cycle [26]. It also serves as a decision-supporting tool for cement producers, allowing them to improve the production process. The cement industry’s environmental impact can be assessed using an LCA. Several studies have been investigated using LCA to evaluate the environmental impact of cement production in various countries, including Spain [22, 27, 28], Egypt and Switzerland [29], China [30, 31], the European Union, the USA [15, 16, 32, 33] and others [17, 34, 35, 36]. Tun et al. [35] evaluated the environmental impacts of the cement industry in Myanmar using LCA. They identify major environmental impacts such as climate change, photochemical oxidant formation, fine particulate matter formation, terrestrial acidification, and fossil resource scarcity, with CO2, NOx, SO2, and PM2.5 emissions from clinker production being the key contributors, suggesting the need for mitigation options such as energy-saving measures, alternative fuels and materials and process upgrades to promote sustainable development in the industry. Çankaya and Pekey [34] used SimaPro 8.0.4 software to conduct a comparative LCA of cement production using traditional raw materials and fuels (Traditional Scenario) versus alternative ones (Alternative Scenario). The results showed that the alternative scenario reduced the overall environmental impact of clinker production by approximately 12%, with positive effects on climate change, human health, ecosystem quality, and resources, particularly for cement types CEM IV and CEM II that used trass. Thwe et al. [36] examined the environmental impacts of cement production in Myanmar, focusing on the Max Myanmar Cement Plant in Naypyitaw. The results showed that conventional cement production has significant negative environmental impacts, with the calcination stage being the primary contributor. However, switching from coal to natural gas as a fuel source can substantially reduce these impacts, with potential reductions of 68% for climate change, 83% for acidification, and 96% for eutrophication. Olagunju and Olanrewaju [17] assessed the environmental impact of 1 kg of Ordinary Portland Cement (OPC) using both midpoint and endpoint approaches of life cycle impact assessment (LCIA). The results showed that the clinker production phase had the highest impact, with CO2 emissions being the highest pollutant emitter, contributing to global warming and posing risks to human health and ecosystems. Additionally, the study highlighted the emission of high copper, which has toxic effects on both the ecosystem and humans and the high consumption of fossil resources, particularly crude oil, which raises concerns about possible scarcity.
Stafford et al. [16] assessed the environmental impacts of using waste materials as partial replacements for fossil fuels in a cement plant in Southern Europe. The study uses a life cycle assessment approach to evaluate the environmental profile of cement manufacturing, focusing on indicators such as abiotic depletion, acidification, eutrophication, photochemical oxidant formation, and global warming. The main contributors to these impact categories were atmospheric emissions in the kiln, consumption of fossil fuels, and electricity usage in the mills. Moretti and Caro [15] investigated the environmental impact of the Italian gray cement and clinker industry, specifically focusing on the upstream and core phases of the production processes. The analysis reveals that the core production phase contributes the most to greenhouse emissions, acidification and eutrophication potential, emphasizing the need to implement BAT in the cement industry to achieve environmental benefits. Therefore, the aim of this paper is as follows: to investigate the environmental impact of Portland cement production (CEM1) in South Africa at an endpoint method using Recipe 2016 v 1.04 of the SimaPro LCA; to conduct a comprehensive uncertainty analysis throughout the entire life cycle to enhance the credibility of the results and to compare the environmental performance of cement production in South Africa with that of other regions globally.
The LCA method has been used to evaluate the environmental impacts and resource use across a product’s lifetime, i.e., from raw materials extraction to the production line and use stages to waste [25]. The LCA method evaluates the environmental impact of products, services, and processes from “cradle to grave.” Based on this data, the LCA analysis assesses the potential impact on the environment, natural resources and human health [37]. The methodology is one of the most crucial components of LCA tools. The analysis and the data validation follow the ISO/TS 14072 guidelines for organizational LCA [26] using the endpoint method of the SimaPro 9.1.1 software [38, 39]. The LCA consists of four stages: definition of goal and scope, inventory analysis, impact assessment and interpretation, following the guidelines of the ISO 14040 [25], 14,044 [40] and ISO/TS 14072 [26].
3.1 The definition of goal and scope
The goal and scope definition gives a detailed assessment objective along with system boundaries, assumptions, and functional units of a product or process [41]. This study will use 1 kg of Portland cement as a functional unit. This will include all datasets, analyses and interpretations.
3.2 Inventory data
The LCI stage covers all the input and output inventory data required to evaluate a product’s production process [41]. The environmental impact database includes all emissions produced during the production process. This study uses inventory data from the Ecoinvent v3.7.1 [42] database of SimaPro, one of the most highly regarded databases for construction materials [43], for 1 kg Portland cement production. The basic materials model describes the production of various materials used in the life cycle of the South African cement plant. The input data for 1 kg of Portland cement is included in Table 1.
Inputs from technosphere
Amount
Cement factory
5.36e−11 unit
Clinker
0.902 kg
Gypsum, mineral
0.0475 kg
Limestone
0.05 kg
Ethylene glycol
0.00019 kg
Steel, low-alloyed
5.25e−05 kg
Electricity
0.0376 kWh
Output
Emissions to air (Heat, waste)
0.135 MJ
Products (Portland Cement)
1 kg
Table 1.
The inputs and outputs to produce 1 kg of Portland cement.
The data includes all energy used and raw materials in the production process. The figures are computed based on original data collected in South African cement plants. The data comes from five typical cement plants in South Africa, representing 90% of the cement market share.
3.3 Impact analysis
LCIA is a multiple-faced evaluation method used to reveal all the potential environmental impact categories based on the environmental resources data provided in the LCI. Several environmental issues are addressed in this assessment, including energy use, global warming, water pollution, etc., offering a comprehensive evaluation of the product’s environmental impacts [25]. Therefore, this study describes the LCA methods for the various stages of cement production, i.e., clinkering, raw material usage, fuel usage, transportation and electricity usage explained by [14]. Since SimaPro uses different analysis methods, the method selected for this study is ReCiPe 2016 Endpoint (H) V1.04, which has three main impact categories; human health, ecosystem and resources. In the LCIA stage, all inventories are grouped into various impact categories, then the results of the LCIA and LCI are interpreted [44].
3.4 Interpretation
This stage explains the results of the LCIA based on the LCI [45]. This stage comprehensively presents processes and substances with significant impacts with a clear presentation, after which we will formulate recommendations. This study will analyze the environmental impact of 1 kg of Portland cement (CM1) using the endpoint LCIA method to measure the impact and correctly provide appropriate recommendations. The investigation was carried out from raw material extraction to cement production, i.e., from cradle to gate system boundary.
3.5 Damage assessment
As previously stated, the endpoint method employs three major impact categories, each of which includes specific impacts, as described below:
3.5.1 Human health
Global warming is measured in Disability-adjusted Life Years (DALY), caused by increased death and diseases due to climate change.
Stratospheric ozone depletion is measured in DALY, resulting from increased UV radiation caused by ozone-depleting substances in the atmosphere.
Ionizing radiation; expressed in DALY, causing by radioactive radiation.
Ozone formation, Human health; the damage is measured in DALY. This effect is emissions of organic substances into the air caused by summer smog.
Fine particulate matter formation: the damage is measured in DALY. This effect is produced by sulfur, dust and nitrogen oxide emissions into the atmosphere caused by winter smog.
Human carcinogenic and non-carcinogenic toxicity; the damage is measured in DALY. This results from carcinogenic effects due to carcinogenic emissions of substances to air, soil and water.
3.5.2 Ecosystem
Global warming; Terrestrial ecosystems and Freshwater ecosystems, Ozone formation; Terrestrial ecosystems, the damage to the ecosystem is measured in species/year resulting from the emission of ecotoxic substances to air, soil and water.
Terrestrial acidification, Freshwater and Marine eutrophication, Terrestrial ecotoxicity. Freshwater and Marine ecotoxicity; the damage to the ecotoxicity is measured in species/year caused from the emission of acidifying substances into the air.
Land use: the damage is expressed in species/year. Either land conversion or land occupation causes this damage.
3.5.3 Resources
Mineral resource: the damage is measured in USD2013 due to decreasing mineral grades.
Fossil resource: the damage is expressed in USD2013, resulting from lower quality fossil fuel extraction.
3.6 Uncertainty analysis
Uncertainty analysis is a systematic method employed to measure the degree of uncertainty that emerges from a life cycle inventory analysis due to the interaction between model imprecision impact, input uncertainty, and data variability [25]. In 1998, Huijbregts [24, 46] identified six types of uncertainties and variabilities, these include (i) spatial variability; (ii) parameter uncertainty; (iii) uncertainty due to choices; (iv) model uncertainty; (v) temporal variability; and (vi) variability between objects and sources. Multiple methods can be employed to conduct this analysis, but Monte Carlo simulation, a statistical modeling method, is widely used during the LCIA stage. Commercial LCA software such as SimaPro, developed by PRéConsultants, now includes Monte Carlo simulations but is only used in a few LCA studies [34, 47]. In this study, the uncertainty analysis will center around evaluating the degree of uncertainty present in the LCI. This uncertainty arises from several factors, including uncertain inputs, inconsistent data and model imprecision [48]. This study used a Monte Carlo simulation to conduct an uncertainty analysis, aiming to evaluate the level of uncertainty of the result since we used secondary data for the analysis. The uncertainty analysis used numerical data and 1000 iterations and a 95% confidence interval (CI) to meet its requirements.
The endpoint method measures the damage-oriented impacts of the processes and shows several impact categories that are further grouped into damage categories. According to the endpoint method, the flows are divided into 22 impact categories, as shown in Table 2. Endpoint methodologies assess human health, ecosystems, and resource damage categories. In addition, the endpoint method shows impacts within various categories but removes other aspects, not considering the emissions factors [49].
Human health (DALY)
Global warming, Human health
Stratospheric ozone depletion
Ionizing radiation
Ozone formation, Human health
Fine particulate matter formation
Human carcinogenic toxicity
Human non-carcinogenic toxicity
Water consumption, Human health
Ecosystems (species.yr)
Ozone formation, Terrestrial ecosystems
Terrestrial acidification
Freshwater eutrophication
Marine eutrophication
Terrestrial ecotoxicity
Freshwater ecotoxicity
Marine ecotoxicity
Global warming, Terrestrial ecosystems
Land use
Global warming, Freshwater ecosystems
Water consumption, Terrestrial ecosystem
Water consumption, Aquatic ecosystems
Resources (USD2013)
Mineral resource scarcity
Fossil resource scarcity
Table 2.
The damage category investigated (endpoint method).
Based on the endpoint method, Table 2 shows the endpoint impact category, which explains each impact in the damage category. This method presents 22 different impact indicators with three damage units, i.e., DALY, species/yr. and USD2013, according to their impacts. The various impacts listed in Table 2 are grouped according to the area of significance to life (AoSL) damage categories, as shown in Table 3.
Damage category
Unit
Portland cement, Production
Human health
DALY
1.6176 × 10⁻⁶
Ecosystems
Species. yr
3.9 × 10⁻⁹
Resources
USD2013
1.686 × 10⁻²
Table 3.
Damage assessment results of 1 kg Portland cement using endpoint method.
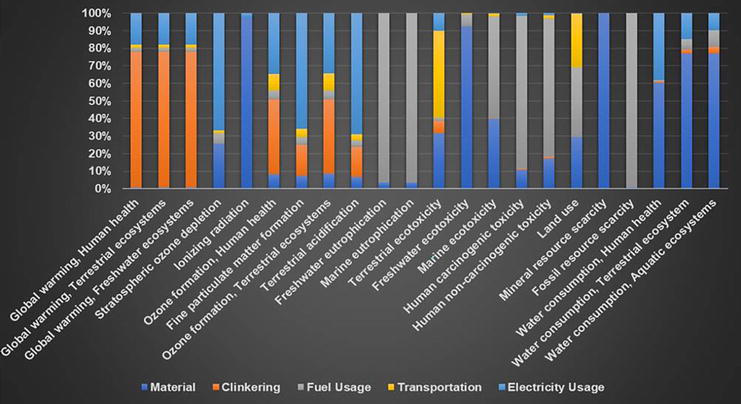
Figure 1 shows a graphical illustration of the impact categories of the five production processes. The characterization result of the endpoint method shows a similar pattern as the midpoint method with four additional impact categories [14].
Figure 1.
Endpoint environmental impact of cement production in South Africa.
The contribution of the five production processes, i.e., clinkering, raw material usage, fuel usage, transportation and electricity usage, to the damage categories, as shown in Figure 2. These production processes were assessed and interpreted according to damage categories: Human health, ecosystems and resources. The evaluation and interpretation of the production processes are outlined as follows.
Figure 2.
Contribution of substances to human health.
4.1.1 Raw material usage stage
Raw material consumption contributed to all three impact categories, as shown in Figure 2. Human health (5%), ecosystem (4%), and resources (4%). Overall, raw material consumption had a minor impact on the damage categories. Therefore, raw material usage did not contribute significantly to damage categories.
4.1.2 Clinkering stage
In Figure 2, the clinkering stage is responsible for 49% of the damage to human health. It contributes to the ecosystem (60%) due to primary gas emissions such as CO2, SO2, NOx and particulate matter, but clinkering stage had no impact on Resources.
4.1.3 Fuel usage stage
Figure 2 showed that Fuel usage contributed to all damage categories with human health damage (12%), ecosystem (9%) and significantly impacted resource damage (96%). Most of these impacts were related to fossil resource consumption, direct emissions from cement production and transport materials during clinker production.
4.1.4 Transportation stage
As shown in Figure 2, transportation usage had a negligible impact on the damage categories. There was a 3% contribution to human health and the ecosystem had no impact on resource damage.
4.1.5 Electricity usage stage
Electricity usage did not impact damage to Resources, as shown in Figure 2, but caused damage to human health (31%) and the ecosystem (24%). The following section further examined the damage category and the findings are detailed below.
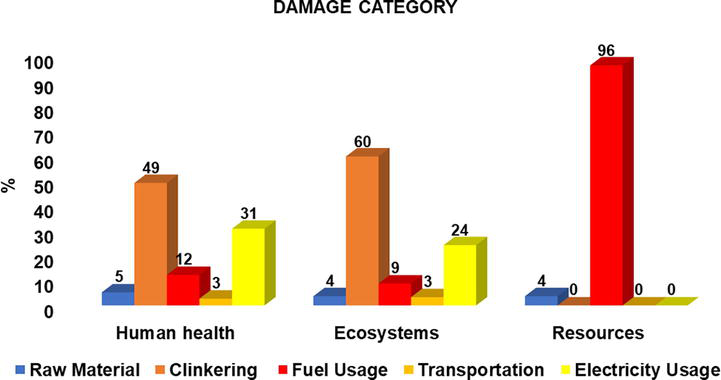
4.2 Damage assessment result
The endpoint analysis classifies the various impact categories into the relevant damage categories based on their effects. Table 3 summarizes the damage assessment under which each impact category falls: Human Health with a value of 1.6176 × 10⁻⁶ DALY, Ecosystems has 3.9 × 10⁻⁹ species/yr. and Resources with 1.686 × 10⁻² USD2013. More in-depth analysis was done to determine the exact substance that contributed to these damage categories and their contribution level in the production process stage. Figure 3 compares the three damages in five production process stages, i.e., raw material, clinkering, fuel usage, electricity usage and transportation.
Figure 3.
Damage assessment results for five production processes.
4.2.1 Human health
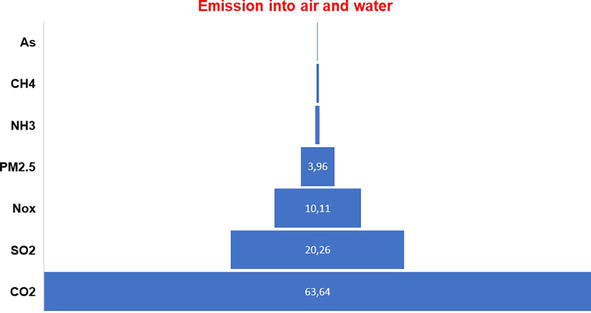
Damage to human health is measured in DALY and determined by many categories, including carcinogens, radiation, respiratory organics, climate change, respiratory inorganics and the ozone layer. The World Health Organization (WHO) defines the unit of human health damage disability-adjusted life years as the total annual number of potential life lost or that a person is disabled due to a pandemic, disease, or accident. Table 3 shows the damage to human health was 1.6176 × 10⁻⁶ DALY. Figure 2 shows the substances emitted during the clinkering stage that cause this human health damage.
Figure 3 shows that 49% of the damage caused to human health is due to the clinkering stage. At this stage, clinker production causes massive damage to human health. Others are raw material usage (5%), fuel usage (12%), electricity usage (31%) and energy generation and transportation (3%). The substances resulting during the production stages are CO2, CH4, SO2, NOx, Particulates, <2.5 μm, etc. Therefore, a detailed damage assessment was conducted on human health. CO2 emissions have a high contribution, as shown in the midpoint method result from [14]. In Figure 2, the result showed that 64% of the damage is caused by CO2 emissions, with other substances like SO2 (20%), NOX (10%), PM2.5 (4%), NH3 (1%), CH4 (0.4%), As (0.6%). All of which have different effects on human health. The reaction between the raw material and coal in the clinker causes the sulfur content to produce SO2, one of the major gases released into the air and water.
4.2.2 Ecosystem
Damage to the ecosystem is calculated in species/yr.; it refers to the number of species lost in a year due to emissions to the environment, water bodies, etc. Table 3shows the ecosystem’s damage is 3.9 × 10⁻⁹ species. yr. per 1 kg of Portland cement produced. This damage was the average of species threatened calculated each year. In other words, for every 1 kg of cement produced, 3.9 × 10⁻⁹ species likely die yearly. The South African cement industry requires approximately 34.2 MT of cement annually, which endangers 133 species.
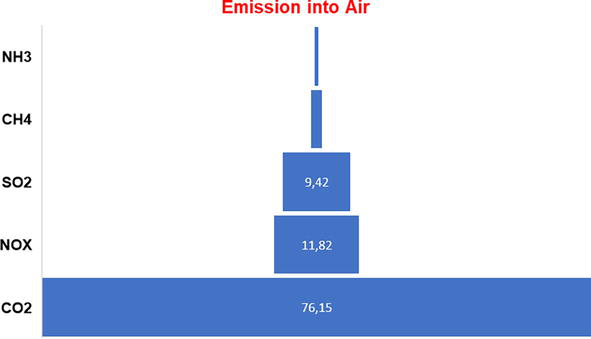
Figure 3 shows that the clinkering stage is responsible for 60% of the damage to the ecosystem, as seen in the case of human health. However, the remaining percentage comes from electricity usage (24%), fuel usage (9%), raw material usage (4%) and transportation (3%). An in-depth analysis was done on the ecosystem damage according to the substances that cause this damage. Figure 4 shows the analysis results of the substances that cause ecosystem damage. The result showed that CO2 has the highest emission (76%) due to energy generation, followed by NOX (12%), SO2 (9%), CH4 (2%) and NH3 (1%). Again, this proved that whatever affects the ecosystem affects human health and vice versa.
Figure 4.
Contribution of substances to the ecosystem.
4.2.3 Resources
Damage to resources is expressed in USD2013. Table 3 shows the resource damage is 1.686 × 10⁻² USD2013. The potential marginal increase in the price of resources per kg of Portland cement produced was due to scarcity. Therefore, for each resource used to produce 1 kg of Portland cement, the cost of that resource will increase by 0.01685 USD in 2013.
Figure 3 shows the details of the total damage to resources. The main resource damage is fuel usage (96%) and raw materials (4%). An in-depth damage analysis was performed on the resources according to the substances that caused this damage. According to Figure 5, the result showed that coal (60%), crude oil (32%), gas (6%) and aluminum (2%) contributed to resources.
Figure 5.
Contribution of substances to resources.
The endpoint analysis’s results are consistent with those found in the literature, with CO2 emissions and the clinkering stage being the most significant contributors [30, 35]. The resources used by Chen et al. [30] and Tun et al. [35] differ because coal was the primary fossil fuel used to produce cement. According to Figure 2, the SO2 emitted from clinkering stage, as shown in Figures 3 and 4, was due to the coal combustion in the South African cement plant, which established the production of SO2 [29, 50]. The sulfur content of coal heavily influences the SO2 emissions. Meanwhile, SO2 emissions threaten human health and the ecosystem while harming people’s chances of receiving clean air, as previously stated [18, 30, 51]. In the clinkering stage (calcination process), NOX is emitted during fuel burning. These emissions were emitted into the air and water.
4.3 Uncertainty analysis result
The uncertainty analysis results given in Table 4 represent the uncertainty in the endpoint, while Table 5 represents damage assessment, respectively. The Monte Carlo method was used to conduct an uncertainty analysis with a confidence interval of 95%.
Impact category
Unit
Mean
Median
SD
CV
2,50%
97,50%
SEM
Fine particulate matter formation
DALY
5,04E−07
4,68E−07
1,99E−07
39,5
2,36E−07
1,03E−06
6,30E−09
Global warming, Human health
DALY
9,33E−07
8,51E−07
4,15E−07
44,5
3,73E−07
2,09E−06
1,31E−08
Human carcinogenic toxicity
DALY
8,05E−08
4,22E−08
1,35E−07
168,0
1,29E−08
4,26E−07
4,28E−09
Human non-carcinogenic toxicity
DALY
1,16E−07
8,28E−08
1,14E−07
98,2
2,76E−08
4,02E−07
3,62E−09
Ionizing radiation
DALY
8,01E−11
4,49E−11
1,19E−10
148,1
8,46E−12
3,70E−10
3,75E−12
Ozone formation, Human health
DALY
1,93E−09
1,78E−09
8,32E−10
43,1
8,11E−10
3,96E−09
2,63E−11
Stratospheric ozone depletion
DALY
1,05E−10
9,31E−11
5,65E−11
53,5
3,73E−11
2,41E−10
1,79E−12
Water consumption, Human health
DALY
2,02E−09
4,79E−09
3,42E−08
1695,2
−8,52E−08
6,64E−08
1,08E−09
Freshwater ecotoxicity
species.yr
1,09E−11
8,98E−12
7,72E−12
71,1
3,56E−12
3,06E−11
2,44E−13
Freshwater eutrophication
species.yr
2,20E−10
1,57E−10
2,15E−10
97,7
3,85E−11
7,45E−10
6,79E−12
Global warming, Freshwater ecosystems
species.yr
7,69E−14
7,01E−14
3,42E−14
44,5
3,08E−14
1,73E−13
1,08E−15
Global warming, Terrestrial ecosystems
species.yr
2,81E−09
2,57E−09
1,25E−09
44,5
1,13E−09
6,32E−09
3,96E−11
Land use
species.yr
6,97E−11
6,26E−11
3,27E−11
46,9
2,88E−11
1,55E−10
1,03E−12
Marine ecotoxicity
species.yr
2,24E−12
1,84E−12
1,63E−12
73,1
7,23E−13
6,45E−12
5,17E−14
Marine eutrophication
species.yr
3,34E−14
2,99E−14
1,69E−14
50,6
1,20E−14
7,74E−14
5,35E−16
Ozone formation, Terrestrial ecosystems
species.yr
2,76E−10
2,55E−10
1,19E−10
43,1
1,16E−10
5,66E−10
3,76E−12
Terrestrial acidification
species.yr
5,24E−10
4,88E−10
2,06E−10
39,3
2,40E−10
1,07E−09
6,51E−12
Terrestrial ecotoxicity
species.yr
1,19E−11
1,08E−11
5,83E−12
49,0
4,48E−12
2,72E−11
1,84E−13
Water consumption, Aquatic ecosystems
species.yr
1,94E−15
2,33E−15
1,58E−14
814,3
−3,09E−14
3,17E−14
4,99E−16
Water consumption, Terrestrial ecosystem
species.yr
2,37E−11
3,77E−11
2,07E−10
875,1
−4,88E−10
4,05E−10
6,55E−12
Fossil resource scarcity
USD2013
0,016518
0,015107
0,007362
44,6
0,006978
0,036469
0,000233
Mineral resource scarcity
USD2013
0,000504
0,000469
0,000211
41,9
0,000217
0,001041
6,67E−06
Table 4.
Uncertainty results for 1 kg of cement analysis endpoint impacts.
Human health
DALY
Mean
Median
SD
CV
2,50%
97,50%
SEM
Ecosystems
species.yr
1,64E−06
1,50E−06
7,09E−07
43,2896
6,80E−07
3,44E−06
2,24E−08
3,95E−09
3,64E−09
1,72E−09
43,59,447
1,60E−09
8,40E−09
5,45E−11
Resources
USD2013
0,017022
0,015595
0,007564
44,43,417
0,007175
0,037425
0,000239
Table 5.
Uncertainty results for endpoint impacts of 1 kg of cement analysis: Damage assessment.
According to the uncertainty analysis, Water consumption, Human health, Water consumption, Terrestrial ecosystem, Water consumption, Aquatic ecosystems, Human carcinogenic toxicity and Ionizing radiation have a high degree of uncertainty. Human non-carcinogenic toxicity, Freshwater eutrophication, Marine ecotoxicity and Freshwater ecotoxicity have a relatively high degree of uncertainty. On the contrary, all other uncertainties at endpoint impact categories are relatively low. Also, the uncertainty was averagely low in the damage assessment uncertainty analysis result. In addition to the range of data sources, the uncertainty of the results is also influenced by variations in the system scope. CO2 emissions from cement production activities primarily come from two main components: fuel consumption and cement clinker production. When limestone mainly contains calcium carbonate (CaCO3) and is heated or burned to produce lime (CaO) during cement clinker production, it releases CO2 emissions.
In this study, we assessed the environmental impact of 1 kg of Portland cement at the production stages, raw materials usage, clinkering, fuel usage, transportation and electricity usage caused by South African cement plants. This study used the endpoint (damage approach) method of LCIA. The study conducted an uncertainty analysis to confirm its results and establish its credibility. The assessment used data from five South African cement plants obtained from the Ecoinvent database v3.7.1. This data was analyzed using the Endpoint Methods in SimaPro 9.1.1. software. The characterization results presented 22 impact categories from the endpoint method. The results of this study will be beneficial in increasing South Africa’s LCI database and provide policymakers in South Africa with valuable scientific-based insights for making decisions related to cement production.
Based on AoSL, these impact categories were divided further into damage to human health, ecosystem and resources. Damage to human health was measured as 1.6176 × 10⁻⁶ DALY, which means that for every 1 kg of Portland cement produced, potential 1.6 × 10⁻⁶ human lives are damaged. Damage to ecosystems measured by the method shows that 3.9 × 10⁻⁹ species are potentially lost annually for every 1 kg of Portland cement produced. Damage to resources measured by the method indicates that 1.686 × 10⁻² USD of resources are potentially wasted for every 1 kg of Portland cement produced. Among the three main damage categories, human health is the most affected by releasing substances into the air during Portland cement production. Also, these emissions have significant adverse impacts on global warming. The most released substances to air and water from all emissions are CO2, As, CH4, NH3, PM2.5, SO2 and NOX.
The clinkering stage contributes 49% of the damage to human health and 60% to ecosystems, affecting the health of humans and other species due to the amount of CO2 released at this production stage. These results align with the literature [12, 15, 22, 28, 31, 34, 52]. CO2 emissions contribute to global warming, with possible effects on climate change and other impacts on humans and ecosystems. Human health and the ecosystem damage from cement production results in other gas emissions such as As, CH4, NH3, PM2.5, SO2 and NOX into the air and water; however, they are minor compared to CO2. In conclusion, the clinkering stage is the most harmful production stage for human health and ecosystems since it produces the highest amounts of CO2 gas. For every 1 kg of Portland cement produced, approximately 0.74 kg of CO2 gas is emitted. It is advisable to select natural gas as the source of electricity generation and optimize the raw materials consumption during clinker production are effective methods to reduce the overall environmental impact in the cement industry.
References
1.Gençer E, Torkamani S, Miller I, Wu TW, O'Sullivan F. Sustainable energy system analysis modeling environment: Analyzing life cycle emissions of the energy transition. Applied Energy. 2020;277:115550
2.Reaño RL, de Padua VAN, Halog AB. Energy efficiency and Life Cycle Assessment with system dynamics of electricity Production from Rice straw using a combined gasification and internal combustion engine. Energies. 2021;14(16):4942. Available from: https://www.mdpi.com/1996-1073/14/16/4942
3.IEA, "Net Zero by 2050: A Roadmap for the Global Energy Sector," 2021. Available from: https://www.iea.org/reports/net-zero-by-2050. [Accessed: February 2022]
4.IEA. World energy outlook 2020-summary. In: International Energy Agency. Paris, France: IEA; 2020. Available from: https://www.iea.org/reports/world-energy-outlook-2020. [Accessed: February 2, 2022]
5.Miccoli S, Finucci F, Murro R. Assessing project quality: A multidimensional approach. In: Advanced Materials Research. Vol. 1030. Switzerland: Trans Tech Publ; 2014. pp. 2519-2522
6.Miccoli S, Finucci F, Murro R. Criteria and procedures for regional environmental regeneration: A European strategic project. In: Applied Mechanics and Materials. Vol. 675. Switzerland: Switzerland Trans Tech Publ; 2014. pp. 401-405
7.Anderson TR, Hawkins E, Jones PD. CO2, the greenhouse effect and global warming: From the pioneering work of Arrhenius and Callendar to today's earth system models. Endeavour. 2016;40(3):178-187
8.Nta S, Olorunnisola A. Experimental production and evaluation of cement-bonded composite pipes for water conveyance. International Journal of Composite Materials. 2016;6(1):9-14
9.Feiz R, Ammenberg J, Baas L, Eklund M, Helgstrand A, Marshall R. Improving the CO2 performance of cement, part I: Utilizing life-cycle assessment and key performance indicators to assess development within the cement industry. Journal of Cleaner Production. 2015;98:272-281
10.WBCSD. GNR project reporting CO2. In: Cement Sustainability Initiative. 2015. Available from: https://www.wbcsdcement.org/GNR-2016/index.html. [Accessed: November 2, 2022]
11.Green J. Global demand for cement to reach 5.2 billion t. Worldcement. 2015. Available from: https://www.Worldcom/europe-cis/27082015/global-demand-cement-billion-tons-449/. [Accessed: August 18, 2022]
12.Stafford FN, Raupp-Pereira F, Labrincha JA, Hotza D. Life cycle assessment of the production of cement: A Brazilian case study. Journal of Cleaner Production. 2016;137:1293-1299. DOI: 10.1016/j.jclepro.2016.07.050
13.Caillahua MC, Moura FJ. Technical feasibility for use of FGD gypsum as an additive setting time retarder for Portland cement. Journal of Materials Research and Technology. 2018;7(2):190-197
14.Ige OE, Olanrewaju OA, Duffy KJ, Collins OC. Environmental impact analysis of Portland cement (CEM1) using the midpoint method. Energies. 2022;15(7):2708. Available from: https://www.mdpi.com/1996-1073/15/7/2708
15.Moretti L, Caro S. Critical analysis of the life cycle assessment of the Italian cement industry. Journal of Cleaner Production. 2017;152:198-210
16.Stafford FN, Dias AC, Arroja L, Labrincha JA, Hotza D. Life cycle assessment of the production of Portland cement: A southern Europe case study. Journal of Cleaner Production. 2016;126:159-165. DOI: 10.1016/j.jclepro.2016.02.110
17.Olagunju BD, Olanrewaju OA. Life Cycle Assessment of ordinary Portland cement (OPC) using both problem oriented (midpoint) approach and damage oriented approach (endpoint). In: Product Life Cycle-Opportunities for Digital and Sustainable Transformation. London, UK, London: Intech Open; 2021
18.Huntzinger DN, Eatmon TD. A life-cycle assessment of Portland cement manufacturing: Comparing the traditional process with alternative technologies. Journal of Cleaner Production. 2009;17(7):668-675
19.Madlool N. Assessment of waste preheater gas and dust bypass systems: Al-Muthanna cement plant case study. Case Studies in Thermal Engineering. 2016;8:330-336
20.Lü Y-L, Geng J, He G-Z. Industrial transformation and green production to reduce environmental emissions: Taking cement industry as a case. Advances in Climate Change Research. 2015;6(3-4):202-209
21.Ige OE, Duffy KJ, Olanrewaju OA, Collins OC. An integrated system dynamics model and Life Cycle Assessment for cement production in South Africa. Atmosphere. 2022;13(11):1788. Available from: https://www.mdpi.com/2073-4433/13/11/1788
22.García-Gusano D, Garraín D, Herrera I, Cabal H, Lechón Y. Life Cycle Assessment of applying CO2 post-combustion capture to the Spanish cement production. Journal of Cleaner Production. 2015;104:328-338
23.Holt SP, Berge ND. Life-cycle assessment of using liquid hazardous waste as an alternative energy source during Portland cement manufacturing: A United States case study. Journal of Cleaner Production. 2018;195:1057-1068
24.Huijbregts M. Uncertainty and variability in environmental life-cycle assessment. The International Journal of Life Cycle Assessment. 2002;7(3):173-173
25.ISO. 14040: International organization for standardization. Environmental Management: Life Cycle Assessment; Principles and Framework. In: International Organization for Standardization. ISO; 2006. Available from: https://www.iso.org/obp/ui/#iso:std:iso:14040:ed-2:v1:en. [Accessed: July 31, 2023]
26.ISO/TS. Environmental management — Life cycle assessment — Requirements and guidelines for organizational life cycle assessment. ISO/TS,14072: 2014. In: International Organization for Standardization. Switzerland: ISO Geneva; 2014. Available from: https://www.iso.org/obp/ui/#iso:std:iso:ts:14072:ed-1:v1:en. [Accessed: July 23, 2023]
27.García-Gusano D, Herrera I, Garraín D, Lechón Y, Cabal H. Life cycle assessment of the Spanish cement industry: Implementation of environmental-friendly solutions. Clean Technologies and Environmental Policy. 2015;17(1):59-73
28.Valderrama C, Granados R, Cortina JL, Gasol CM, Guillem M, Josa A. Implementation of best available techniques in cement manufacturing: A life-cycle assessment study. Journal of Cleaner Production. 2012;25:60-67
29.Ali AAM, Negm AM, Bady MF, Ibrahim MG, Suzuki M. Environmental impact assessment of the Egyptian cement industry based on a life-cycle assessment approach: A comparative study between Egyptian and Swiss plants. Clean Technologies and Environmental Policy. 2016;18(4):1053-1068
30.Chen W, Hong J, Xu C. Pollutants generated by cement production in China, their impacts, and the potential for environmental improvement. Journal of Cleaner Production. 2015;103:61-69
31.Li C, Cui S, Nie Z, Gong X, Wang Z, Itsubo N. The LCA of Portland cement production in China. The International Journal of Life Cycle Assessment. 2015;20(1):117-127
32.Josa A, Aguado A, Cardim A, Byars E. Comparative analysis of the life cycle impact assessment of available cement inventories in the EU. Cement and Concrete Research. 2007;37(5):781-788
33.Somoza-Tornos A, Guerra OJ, Crow AM, Smith WA, Hodge B-M. Process modeling, techno-economic assessment, and life cycle assessment of the electrochemical reduction of CO2: A review. iScience. 2021;24(7):102813. DOI: 10.1016/j.isci.2021.102813
34.Çankaya S, Pekey B. A comparative life cycle assessment for sustainable cement production in Turkey. Journal of Environmental Management. 2019;249:109362. Available from: https://www.sciencedirect.com/science/article/pii/S0301479719310710?via%3Dihub
35.Tun TZ, Bonnet S, Gheewala SH. Life cycle assessment of Portland cement production in Myanmar. The International Journal of Life Cycle Assessment. 2020;25(11):2106-2121
36.Thwe E, Khatiwada D, Gasparatos A. Life cycle assessment of a cement plant in Naypyitaw, Myanmar. Cleaner Environmental Systems. 2021;2:100007
37.Nigri EM, Rocha SDF, Romeiro Filho E. Portland cement: An application of life cycle assessment. Product: Management and Development. 2010;8(2):167-172
38.B. Pré Consultants. SimaPro. In: https://network.simapro.com/esuservices. 2016. Available from: https://network.simapro.com/esuservices. [Accessed: August 13, 2022]
39.PRé Sustainability. SimaPro. In: Software to Measure and Improve The Impact of Your Product Life Cycle. Available: Pre-sustainability; 2017
40.ISO. 14044: International organization for standardization. Environmental Management: Environmental management: Life cycle assessment; requirements and guidelines. In: International organization for standardization. Switzerland: ISO Geneva; 2006. Available from: https://www.iso.org/obp/ui/#iso:std:iso:14044:ed-1:v1:en. [Accessed: July 31, 2022]
41.Marinković S. Life cycle assessment (LCA) aspects of concrete. In: Eco-efficient Concrete. Sawston, Cambridge: Elsevier; 2013. pp. 45-80
42.Moreno Ruiz E et al. Cement Production: Documentation of Changes Implemented in Ecoinvent Database v3. 7 & v3. 7.1. Documentation Cement Production, Portland - ZA, Ecoinvent Association, Allocation, cut-off ed. Identifying Improvement Potentials in Cement Production with Life Cycle Assessment 2010. Zurich, Switzerland: Ecoinvent Association; 2019
43.Martínez-Rocamora A, Solís-Guzmán J, Marrero M. LCA databases focused on construction materials: A review. Renewable and Sustainable Energy Reviews. 2016;58:565-573
44.Ige OE, Olanrewaju OA, Duffy KJ, Collins OC. A review of the effectiveness of Life Cycle Assessment for gauging environmental impacts from cement production. Journal of Cleaner Production. 2021;324:129213. DOI: 10.1016/j.jclepro.2021.129213
45.Andersson K, Ohlsson T, Olsson P. Life cycle assessment (LCA) of food products and production systems. Trends in Food Science & Technology. 1994;5(5):134-138
46.Huijbregts MA. Application of uncertainty and variability in LCA. The International Journal of Life Cycle Assessment. 1998;3(5):273-280
47.Güereca LP, Torres N, Juárez-López CR. The co-processing of municipal waste in a cement kiln in Mexico. A life-cycle assessment approach. Journal of Cleaner Production. 2015;107:741-748
48.I. O. F. Standardization. Environmental Management: Life Cycle Assessment; Principles and Framework (no. 2006). Geneva, Switzerland: ISO; 2006
49.Goedkoop M, Heijungs R, Huijbregts M, De Schryver A, Struijs J, Van Zelm R. ReCiPe 2008. In: A Life Cycle Impact Assessment Method Which Comprises Harmonised Category Indicators at the Midpoint and the Endpoint Level. Vol. 1. 2009. pp. 1-126. Available from: https://web.universiteitleiden.nl/cml/ssp/publications/recipe_characterisation.pdf
50.Mittal ML, Sharma C, Singh R. Decadal emission estimates of carbon dioxide, sulfur dioxide, and nitric oxide emissions from coal burning in electric power generation plants in India. Environmental Monitoring and Assessment. 2014;186(10):6857-6866
51.Song D, Yang J, Chen B, Hayat T, Alsaedi A. Life-cycle environmental impact analysis of a typical cement production chain. Applied Energy. 2016;164:916-923
52.Georgiopoulou M, Lyberatos G. Life cycle assessment of the use of alternative fuels in cement kilns: A case study. Journal of Environmental Management. 2018;216:224-234
Written By
Oluwafemi E. Ige, Kevin J. Duffy, Oludolapo A. Olanrewaju and Obiora C. Collins
Submitted: 10 December 2023Reviewed: 11 December 2023Published: 28 February 2024