Open Access is an initiative that aims to make scientific research freely available to all. To date our community has made over 100 million downloads. It’s based on principles of collaboration, unobstructed discovery, and, most importantly, scientific progression. As PhD students, we found it difficult to access the research we needed, so we decided to create a new Open Access publisher that levels the playing field for scientists across the world. How? By making research easy to access, and puts the academic needs of the researchers before the business interests of publishers.
We are a community of more than 103,000 authors and editors from 3,291 institutions spanning 160 countries, including Nobel Prize winners and some of the world’s most-cited researchers. Publishing on IntechOpen allows authors to earn citations and find new collaborators, meaning more people see your work not only from your own field of study, but from other related fields too.
The aim of this study was to determine the influence of laser power on the microstructure, hardness, and residual stresses of laser-cladded titanium alloy. Laser powers of 600, 800, and 1000 W were varied while keeping other processing parameters constant. Microhardness and microstructure measurements were conducted using a Vickers microhardness tester and an optical microscope, respectively. Residual stresses were determined using an X-ray diffractometer (XRD). The results obtained revealed a non-linear relationship between microhardness and increasing laser power. Microstructural analysis indicated a transformation from all α grains to α′ martensite in the cladded zone, observed across all laser powers. Residual stress measurements showed a consistent tensile trend, decreasing with increasing laser power. The issue of increasing tensile residual stress can be mitigated by adjusting the laser power with minimal impact on the microstructure. These findings highlight the significant influence of processing parameters on surface properties, suggesting the potential for optimizing laser cladding parameters to enhance material corrosion and abrasion resistance properties.
Department of Mechanical Engineering, Walter Sisulu University, Butterworth, Eastern Cape, South Africa
Kadephi Vuyolwethu Mjali
Department of Mechanical Engineering, Walter Sisulu University, Butterworth, Eastern Cape, South Africa
*Address all correspondence to: tngake@wsu.ac.za
1. Introduction
Titanium (Ti) and its alloys are widely used in the biomedical, automotive, and aerospace industries [1, 2]. Their extensive use is mostly due to their superior mechanical and biocompatibility qualities. Ti exists in multiple crystallographic forms. At room temperature, Ti exists in the form of a hexagonal close-packed (hcp) crystal structure, also referred to as the “alpha” (α) phase. At 883°C, the Ti crystal structure transforms to body-centered cubic (bcc), which is called the “beta” (β) phase. Alloying elements are generally classified as α or β stabilizers. Alpha stabilizers increase the temperature at which the α phase is stable, whereas the beta stabilizers stabilize the β phase at lower temperatures. Aluminum and oxygen are examples of α-stabilizers, while common β-stabilizers include vanadium and molybdenum. Ti alloys are classified into three groups: α, β, and α + β alloys. Alpha alloys consist of all-α microstructure. A beta alloy is one in which the β phase does not undergo martensitic breakdown when a small amount of the material is quenched into freezing water above its β transus. The α + β alloys are made up of a mixture of α and β phases, which are stable at room temperature [3].
The microstructure of Ti alloys is strongly influenced by the processing history and surface treatment [4]. Commercially pure (CP) Ti is a single-phase (α) material, with its properties are controlled by chemistry (interstitial impurity elements) and grain size. CP Ti is divided into four grades according to its strength and permitted levels of impurity elements (iron, carbon, nitrogen, and oxygen). CP grade 2 Ti is widely used in chemical industries due of its outstanding corrosion resistance and good strength [5]. However, there is a need to enhance the properties of CP grade 2 Ti to broaden its applications in the aerospace industry. The material property requirements in the aerospace industry include good strength for fatigue life, which ultimately reduces the likelihood of cracking during high-speed cyclic operations. The presence of tensile residual stresses (TRS) during operations is the primary cause of cracks, as they initiate cracks on the material’s surface [6].
Researchers utilize surface modification techniques to address the material’s drawbacks in various applications. Techniques such as short peening, heat treatment, laser peening, and laser cladding are common surface modification methods used by researchers. Laser cladding, also known as laser metal deposition (LMD) or laser cladding deposition, is a cutting-edge material processing technique that employs a high-energy laser beam to melt and fuse metallic or composite powders onto a substrate. This technology has found applications in various industries, including manufacturing, aerospace, automotive, and medical, due to its ability to enhance surface properties, repair components, and create complex geometries with precision. During laser cladding, a focused laser beam is utilized to melt the surface of the substrate or a previously deposited layer. The metallic or composite powders are then injected into the molten pool, where they melt and fuse with the substrate, forming a new layer [7, 8]. Commonly used materials include alloys, tool steels, and superalloys. Laser cladding allows for precise control over the heat input, minimizing thermal distortion and ensuring a fine microstructure. Furthermore, the localized nature of the process reduces the impact on the surrounding material, preventing thermal damage to the substrate. It can be employed for various applications, including coating, repairing damaged components, and building up material layer by layer for additive manufacturing.
During laser cladding, several aspects must be taken into consideration, such as ensuring compatibility between the substrate and the clad material, and fine-tuning process parameters, including laser power, scanning speed, and powder flow rate, to achieve optimal results. Variations in these parameters lead to changes in the general shape of the tracks and in the microstructure. Researchers have demonstrated how variations in the cladding parameters affect the microstructure and corrosion resistance of the material. Zhang et al. [9] showed that an increase in laser power increases the grain size of the coating, and decreases the density. Gao et al. [10] investigated the effect of changes in the scanning speed on corrosion resistance. Their results indicate that an increase in the scanning speed leads to a thinner coating thickness, resulting in surface cracks, and decreased corrosion resistance. However, not much research has focused on the effects of changes in cladding parameters on the induced residual stresses of materials.
The stresses that remain in a component after processing and after all externally imposed loads have been eliminated are known as residual stresses [11]. These stresses can result from various processes such as manufacturing, welding, machining, and heat treatment. Understanding residual stresses is crucial because they can significantly affect the mechanical properties and performance of materials. In titanium and titanium alloys, there are numerous sources of residual stresses. Rapid cooling or uneven cooling during manufacturing processes can lead to non-uniform thermal contractions, resulting in residual stresses. Titanium and its alloys may undergo phase transformations during heat treatment, welding, or cooling, leading to volume changes and the development of residual stresses. Mechanical processes such as forging, rolling, or extrusion can induce plastic deformation and generate residual stresses in the material. Moreover, localized heating and cooling during welding can introduce significant residual stresses, particularly near the weld region [12, 13, 14]. Residual stresses can influence the mechanical properties of titanium alloys by affecting factors such as fatigue strength, fracture toughness, and corrosion resistance. Residual stresses extend the fatigue life of components by suppressing crack initiation and propagation [15]. Induced residual stresses can be both beneficial and harmful to structural integrity. Wang et al. [16] deliberately induced compressive residual stresses (CRSes) by shot peening to exploit the positive benefits of CRS. However, the presence of tensile residual stresses (TRSes) leads to detrimental effects such as stress corrosion effects and inconsistencies in component precision, which must be avoided.
CRS is crucial for increasing the material’s fatigue strength. As the laser beam intensity increases, the surface heats up, causing tension to transition from stretching to compression. Conversely, the remelted zone contracts, and tensile stresses develop due to cooling following laser treatment, potentially leading to the fracture of brittle materials [17]. In this study, the effects of variation in the laser power during the laser cladding process on both the microstructure and induced residual stresses of the cladded CP grade 2 Ti alloy are investigated. The CP grade 2 Ti was coated with the Ti-6Al-4 V alloy, which is an α + β alloy characterized by low density and excellent corrosion resistance.
Residual stress can be measured by the X-ray diffraction (XRD) technique. Measuring residual stress using X-ray diffraction (XRD) involves analyzing crystal lattice distortions caused by internal stresses within a material. One commonly used method for this purpose is the sin2ψ method, also known as the sin2ψ technique or sin2ψ analysis. This method utilizes the relationship between the diffraction angle, lattice strain, and residual stress in a crystalline material. The basis of XRD is Bragg’s Law, which relates the angle of incidence (θ) of X-rays on a crystal lattice to the interplanar spacing (d) and the wavelength (λ) of the X-rays: 2dsinθ=nλ, where n is the order of diffraction. Residual stresses within a material cause lattice strain, leading to distortion in the crystal lattice. The lattice spacing (d) is modified, which affects the diffraction pattern. The lattice strain (ε) is related to the change in the lattice spacing (Δd) by ε=Δd/d. The sin2ψ method is based on the relationship between the orientation of the crystal lattice planes relative to the incident X-ray beam and the resulting diffraction peak position. The angle ψ is the angle between the normal to the crystal lattice planes and the direction of the incident X-ray beam. The sin2ψ term is introduced to account for the arbitrary orientation of the crystal lattice. The stress (σ) can be determined from the lattice strain using Hooke’s Law: σ=Eε, where E is the elastic modulus of the material. For a polycrystalline material, the relationship between stress, lattice strain, and the XRD diffraction angle (2θ) is given by the sin2ψ Eq. (1):
sin2ψ=1−cos2θ1+cos2θ=λ2d∂d∂θ2+sin2θE1+ν21−νσE1
Previous research has shown the influence of surface modification techniques on the material’s microstructure but little on the appearance of residual stresses. Additionally, most researchers have focused on heat treatment as a surface modification technique, with minimal attention given to laser cladding and its influence on the material’s residual stresses. Therefore, the aim of this research is to analyze the influence of laser cladding on selected properties of the obtained surface layers for samples made of titanium and titanium alloy Ti-6Al-4V. The laser power was varied and the properties of the resulting samples were compared.
The substrate material used in this study is a commercially pure titanium (grade 2) alloy with dimensions of 100 mm × 200 mm × 3 mm. Commercial pure titanium contains 99.0–99.5 wt.% titanium, with the main impurities being iron, carbon, nitrogen, oxygen, and hydrogen [18]. Ti-6Al-4V powder is used as the clad material, and the chemical composition of the powder is summarized in Table 1 [20].
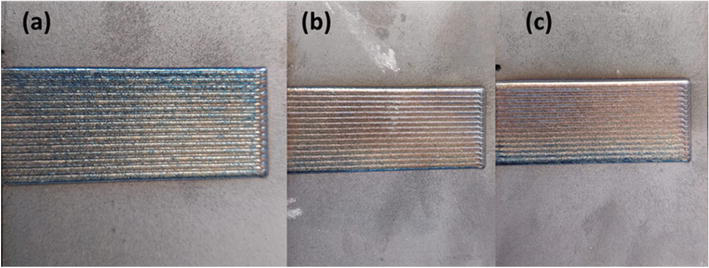
Before cladding, the samples were sandblasted with 200–300 micron glass beads to remove contaminants on the surface, improve surface adhesion, and increase radiation absorption. The laser source used in this study was a Nd:YAG diode laser. A constant laser beam spot size of 2.5 mm was used with a laser power range of 600–1000 W to investigate the effect of the laser power. A total of 15 cladding tracks were made, covering a cladding area of 2700 mm2, as shown in Figure 1. Overlapping coating was achieved with a 50% overlap. The scanning speed, powder flow, and gas flow rate were kept constant at 1.5 m/min, 2.5 rpm, and 3.5 l/min, respectively. These settings were found to be the most efficient for the cladding of titanium alloy [19].
Figure 1.
CP grade 2 titanium after laser cladding. The samples were cladded at laser powers of (a) 600 W, (b) 800 W, and (c) 1000 W.
The laser cladding process parameters are summarized in Table 2. The specific heat input was calculated using Eq. (1) from [21]. The laser interaction time (which is described as the amount of time the laser is in contact with the material) was kept constant at 0.1 s, which was calculated from Eq. (2) below.
Sample
Laser power (W)
Spot size (mm)
Scanning speed (m/min)
Powder flow (rpm)
Gas flow (l/min)
Specific heat input (J mm2)
Ti600
600
2.5
1.5
2.5
3.5
9.6
Ti800
800
2.5
1.5
2.5
3.5
12.8
Ti1000
1000
2.5
1.5
2.5
3.5
16
Table 2.
Laser cladding experimental parameters.
Hs=Pν.DE2
where Hs is the specific heat input, P is the power in watt, ν is the scanning speed in mm/s, and D is the beam diameter (also known as the spot size).
R=DνE3
where R is the interaction time in seconds, ν is the scanning speed in mm/s and D is the beam diameter.
2.3 Microstructure analyses
The samples were first cut using the Struers Labotom-5 cutting machine to the desired size. Subsequently, they were then mounted using the Automatic Mounting Press (AMP) 50 at a temperature of 180°C, with a keep time of 580 s, and a cooling temperature of 40°C. Grinding was then performed at a force of 25 N at 300 RPM, using 800, 1200, and 2400 SiC-bonded grinding papers. Polishing was carried out using an MD-Chem polishing disk with a 0.4 μm colloidal silica suspension. The samples were etched in Kroll’s reagent for 10 s. The microstructure was determined using a Leica DMI5000M optical microscope (Figure 2), with varying the magnifications to obtain clear image of the microstructure.
Figure 2.
Leica DMI5000 optical microscope (courtesy of Leica).
2.4 Microhardness
The samples used for microstructure analysis were also utilized for microhardness testing. The microhardness of the samples was determined using the Zwick-Roell ZHVμ micro-hardness tester, as depicted in Figure 3, with a testing force of 300 gf and a dwell time of 10 s. Hardness tests were performed horizontally across the substrate zone to assess the effects of cladding on the substrate.
Figure 3.
Zwick-Roell ZHVμ micro-hardness tester.
2.5 Residual stress measurements
The residual stress measurements were carried out using Proto iX-ray diffraction and the sin2ψ method [22]. XRD is a non-destructive technique that allows for stress analysis without altering the material. The sin2ψ method utilizes the planes d{hkl} of the crystal lattice to measure the change in d-spacing (Δd). The strain is then determined from Δd, which is subsequently used to calculate the stress. XRD scans are performed at various angles to obtain diffraction peaks. The sin2ψ method involves measuring the diffraction peak positions for different orientations of the crystal lattice. The sin2ψ equation is then used to fit the experimental data, and the residual stress was calculated by solving for σ in Eq. (4).
σϕ=E1+υsin2ψdψ−dndnE4
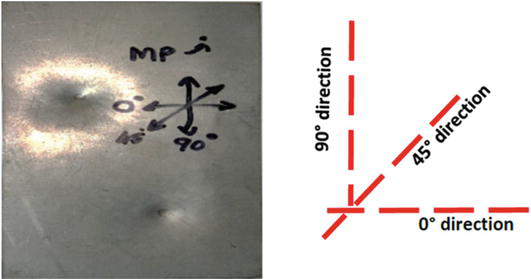
where σϕ is the stress in the direction of ϕ, E is the Young’s modulus, υ is the Poisson’s ratio, ψ is the tilt angle, dψ is the d-spacing at tilt angle and dn is the stress-free d-spacing. A Cu_K-Alpha tube with a wavelength of 1.5418 Å was selected to obtain diffraction peaks from the {213} crystallographic planes of the alpha phase. The instrumental voltage and current were set at 25 kV and 4 mA, respectively. The residual stress measurements were taken from three different angles of rotation (phi (ϕ)) (as shown in Figure 4), 0°, 45° and 90° respectively. The Bragg angle was 142°. Table 3 summarizes the X-ray diffraction parameters used in the stress measurements.
Figure 4.
Tri-axial measurement orientation setup (0°, 45° and 90°) shown on the parent material.
Method
sin2ψ
X-ray source
Cu_K-Alpha
Wavelength
1.542 Å
Filter
Ni
{213}
1/2S2
11.89 × 10⁻⁶ MPa−1
S1
2.83 × 10⁻⁶ MPa−1
Voltage
25 kV
Current
4 mA
d-spacing
0.815
Bragg’s angle
142
Table 3.
X-ray diffraction parameters for residual stress measurements.
Several laser cladding parameters must be considered for successful cladding as outlined in Section 3 of this paper. Among these parameters, power and energy density play crucial roles in determining the power transferred to the material and the energy absorbed by it. Table 4 presents the power density, calculated as the ratio of power to the cross-sectional area of the laser beam, and the energy density, which measures the energy absorbed by the treated material. The power density is determined by the formula I=P/A, where I represent intensity in W/cm2, P is the laser power in W, and A is the cross-section area of the beam [23]. Additionally, the energy density is given by Eq. (5) [24].
Laser power (W)
Power density (W/cm2)
Energy density (J/cm2)
Power, energy density increase (%)
600
12223.1
1222.3
—
800
16297.5
1629.7
25
1000
20371.8
2037.2
20
Table 4.
Laser processing energy parameters.
E=PR/AE5
The power density increases with the laser power, assuming the area of the laser beam remains constant. The power intensity rises by 25% from 600 W to 800 W and by 20% from 800 W to 1000 W. The percentage difference between 600 and 800 W, as well as between 800 and 1000 W, decreases as the laser power increases. The presence of the interaction time (R) in the energy density equation contributes to the main difference compared with power density equation. Both density variables depend on the laser parameters employed during cladding. Results in Table 4 indicate that the energy density is 10 times less than the power density due to the short interaction time of 0.1 s. The percentage increase in energy density with laser power mirrors to the change observed in the power density values. Overall, the three laser powers under the investigation yielded a good metallurgical bond between the substrate and the cladding material. The influence of the laser power on the mechanical properties of the samples are discussed in the next section of results.
3.2 Microstructure
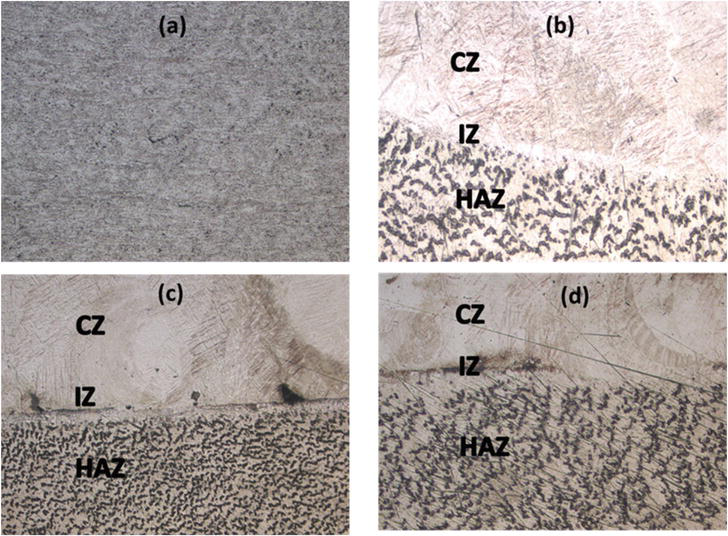
Figure 5 presents the results obtained through optical microscopic examination at 10× magnification. The microstructure of the substrate (CP Ti grade 2) is shown in Figure 5(a) revealing the dominance of the hexagonal α phase on the CP Ti, as expected, with small α grains. The small α grains result from temperature adjustments (typically around 700–750°C) during the recrystallization treatment when forming CP Ti [24]. Figure 5(b)–(d) illustrate the microstructure of the laser-clad samples, where the laser-clad coatings are divided into three zones: the clad zone (CZ), the interface zone (IZ), and the heat-affected zone (HAZ). A robust metallurgical bond is observed between the clad zone and the substrate base material.
Figure 5.
Microstructures of (a) parent Ti, (b) Ti600 sample, (c) Ti800, (d) Ti1000 with 10× magnification. (b)–(d) show the junction of the clad area and the substrate, clad zone (CZ), interface zone (IZ), and substrate zone (SZ).
Figure 5 shows that the crystal morphology of the cladded samples changed dramatically compared with the initial microstructure due to solid phase transformation. At lower laser power (600 W), as shown in Figure 5(b), the clad layer appears to have a uniform distribution of particles and is free of pores. However, gas pores and cracks are noticeable, especially in the IZ and CZ, at laser powers of 800 and 1000 W (Figure 5(c) and (d)). This may be attributed to the high laser power, which results in excessive heat absorption, leading to material evaporation. This issue can be addressed by adjusting the power flow rate with laser power [25]. Moreover, the HAZ consist of a dual-phase microstructure with α grains (represented by light color) and intergranular β grains (in black color). The number and density of intergranular β grains increases with increasing laser power. According to [26], the microstructure for HAZ ranged from fine to coarse globular alpha structure as the laser power is increased. However, unlike in this current where pure titanium was used as a substrate, they used Ti alloy as the substrate.
Furthermore, the martensitic transformation is clearly evident in the clad samples compared with the parent sample. The martensitic transformation results in the formation of a hexagonal martensite crystal structure (α′) with lath martensite. Studies by [26, 27] show that increasing laser power lead to a deeper melt, which result in much thicker martensite laths. In Figure 5, the same phenomenon is observed, where Ti600 indicate much fine martensite than the Ti800 and Ti1000, respectively.
3.3 Microhardness
During the cladding process, all parameters remained constant except for the laser power, which varied to assess its impact on the microhardness of the clad material. It is noteworthy that the microhardness of the clad samples was measured in the substrate zone, rather than the clad zone, to evaluate the influence of cladding on the substrate. The microhardness on the substrate was reduced by up to 11.6% as a result of cladding process when compared to the parent material. According to [28], the microhardness of the substrate is 30.4% less than that of the coating due to difference in the grain size of the microstructure. The average microhardness of the clad samples is summarized in Table 5 and compared with that of the parent sample. Overall, the microhardness of the parent material was higher than that of the clad samples, primarily due to the fact that the microhardness were measured in the substrate zone instead of the clad zone.
Parent Ti
Ti600
Ti800
Ti1000
207.8
187.8
183.7
188.2
Table 5.
Average Vickers microhardness (HV) for the cladded Ti samples.
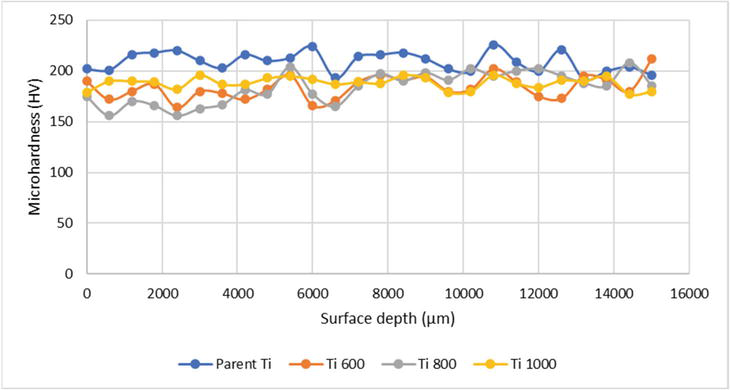
Figure 6 illustrates the microhardness depth profile of the clad samples and the parent material. The microhardness distribution across the surface depth generally increases with an increasing depth. The parent material consistently exhibits higher microhardness values across all depth levels, whereas the clad samples display fluctuations with increasing depth values. The microhardness distribution fluctuates across the surface depth, with the fluctuations ranging between 1 and 52 HV. Ti1000 fluctuates less among the three cladded samples, with the highest fluctuation of up to 19 HV across the depth. Ti600 and Ti800 have their highest fluctuations up to 48 and 52 HV, respectively.
Figure 6.
Microhardness profiles of the cladded samples (with different laser power) versus the depth of the surface.
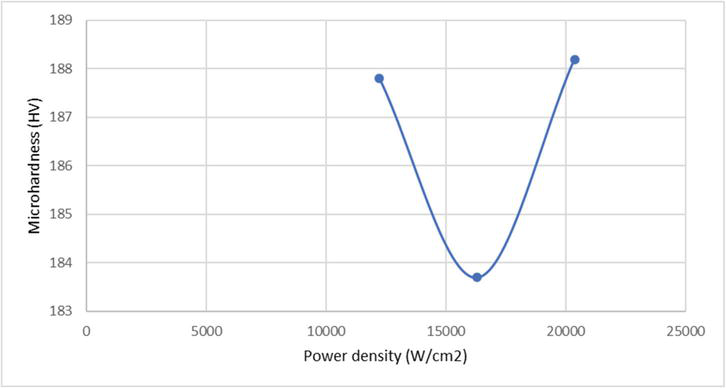
Table 5 presents the microhardness results for the different samples. Analysis of Table 5 shows that the parent material has a higher microhardness value than the cladded samples, this is a result of measuring the microhardness on the substrate instead of the clad zone. The difference in the microhardness between the parent material and the cladded sample ranges between 9.4% and 11.6. Figure 7 illustrates a non-linear relationship between microhardness and power density which is equivalent to laser power %. Microhardness decreases by 2.2% from 600 to 800 W and then increases by 2.4% from 800 to 1000 W. Similar and contrasting results are observed in literature, Abdulrahman et al. [29] demonstrated non-linear relationship between microhardness and laser power, showing a fluctuation of the microhardness as the laser power is increased, attributed to the slow cooling during solidification. In contrast, according to [26] the average microhardness increases with an increase in laser power due to changes in microstructure. It was noted that the microstructure range between fine and thick martensite structure as the laser power is increased. Conversely [30], stated that the average microhardness decrease with increasing laser power due to differences in microstructure activated by lengthening cooling speed of the alloy layer under a higher laser power.
Figure 7.
Graph of microhardness versus power density of the radiated beam.
Overall, the maximum microhardness value was observed at 1000 W. This could be attributed to the more intense and rapid heating of the material being deposited at higher laser power, resulting in a faster cooling rate. Another possibility is that the increase in laser power leads to higher energy input into the material, resulting in more complete melting of the deposited material. Consequently, during solidification, smaller and more uniform grains are formed, contributing to higher microhardness.
3.4 Residual stress
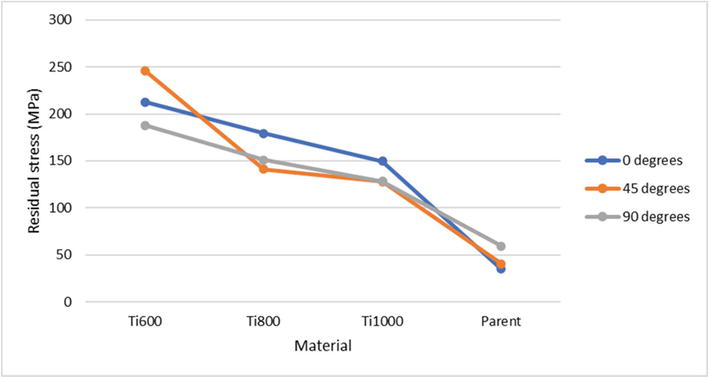
The residual stress measurements were conducted using XRD and sin2ψ method. Measurements were taken for both the parent material (CP Ti grade 2 alloy) and the cladded samples at three different rotation angles, as depicted in Figure 4, with results summarized in Table 6. Analysis of Table 6, reveals that the investigated samples exhibit TRS, with the highest residual stress observed at 600 W. Specifically, Ti600 exhibit the maximum residual stress, averaging 215.41 ± 31.36 MPa, followed by Ti800 with 157.03 ± 24.93 MPa, and Ti1000 with an average residual stress of 135.14 ± 25.22 MPa, respectively. In contrast, the parent material displayed the lowest residual stress of 44.99 ± 27.19 MPa, indicating a significant increase in the induced residual stress due to the cladding process of the Ti alloy. Furthermore, as depicted in Figure 8, an increase in the laser power correlates with a decrease in the residual stress. Specifically, cladding the parent material with a laser power of 600 W resulted in a significant average increase in TRS of 478.8%. Similarly, when the laser power was increased to 1000 W, the average TRS increased by 300%. According to [31], modification of the pure titanium by laser treatment with average power of 25 W increased the stresses by 225%. Simulation studies shows non-linear relationship between laser power and residual stress, however, the trend is not consistent with different scanning speeds [32].
0°
45°
90°
Average
212.59 ± 36.43
245.92 ± 24.16
187.71 ± 33.48
215.41 ± 31.36
179.19 ± 30.93
141.09 ± 21.83
150.82 ± 22.03
157.03 ± 24.93
149.63 ± 31.48
127.73 ± 22.63
128.07 ± 21.56
135.14 ± 25.22
35.07 ± 27.28
40.44 ± 28.93
59.45 ± 25.35
44.99 ± 27.19
Table 6.
Residual stress measurements (in MPa) for cladded samples at different rotation angles.
Figure 8.
Residual stress measurements for different materials.
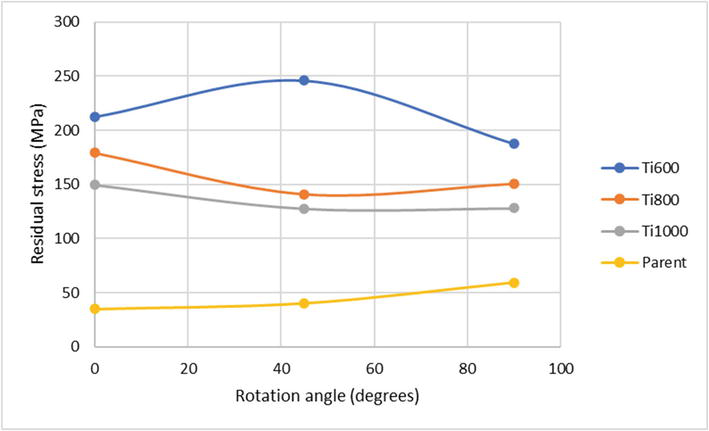
Figure 9 illustrates that the residual stress does not follow a clear trend when the rotation angle is altered. The maximum induced residual stress occurs at 45° for a lower laser power of 600 W, at 0° for 800 W and 1000 W, and at 90° for the parent material. This observation aligns with findings by Lai et al. [33], who also noted the absence of a defined trend between the scanning angle and residual stress.
Figure 9.
Relationship between residual stress and rotation angle for different materials.
Compressive and tensile residual stresses in materials can exert opposing effects on the material’s properties and performance. CRS can benefit fatigue-loaded structures by delaying crack growth, thereby enhancing the material’s fatigue life [34]. Conversely, TRS decrease the fatigue life of the material as they can initiate crack growth and propagation. It would be insightful to investigate the effects of laser cladding processing conditions on induced residual stress and its correlation with the material’s microstructure. Microstructure control is crucial for maintaining a balanced relationship between tensile and compressive residual stresses [35].
Considering the obtained results for the cladded samples and the effects of laser power, it can be inferred that an increase in laser power leads to a reduction in the TRS, an increase in hardness, and a martensitic α′ microstructure. The formation of α′ martensitic promotes high tensile strength but results in low ductility of the alloy [36]. Therefore, the difference in the microstructure, can account for the variation in the induced residual stresses. Furthermore, it is important to note that the residual stresses in this investigation were only measured on the surface, which is a limitation because the residual stress also depends on the material’s depth.
The hardness of the material is determined by measuring the amount of persistent deformation caused by a set force exerted on the penetrator, defining its resistance to permanent or plastic deformation. The yield strength, elastic modulus, and strain-hardening properties of a metal primarily determine its resistance to deformation [37]. There is a growing interest among scientists and engineers in establishing the relationship between a material’s hardness and induced residual stress. The current study focused on the effects of laser power, revealing a higher hardness value at 1000 W. The Ti1000 sample also indicates the lowest TRS, which approaches CRS. By enhancing surface hardening and inducing higher CRS, deeper crack initiation sites and superior fatigue life can be achieved [38]. However, the Ti800 sample displays inconsistent results with this trend. It exhibits the lowest hardness value among the three cladded samples while having a TRS value lower than Ti600.
Overall, the results are consistent with findings by [31]. Jażdżewska et al. [31], who studied the mechanical properties and residual stress measurements of grade 4 Ti and Ti alloys after laser treatment. Their results indicated an increase in the tensile stresses after laser modification, along with an increase in material hardness. Considering both the current study and that of Jażdżewska, it can be concluded that increasing the CRS or, decreasing TRS as observed in the current study, improves the material hardness, thereby enhancing fatigue-life and crack initiation resistance. Moreover, it enhances corrosion and abrasion resistance. However, the current study suggests that processing parameters significantly impact outcomes, as indicated by the deviation of Ti800.
The successful laser cladding of Ti6Al4V alloy onto pure titanium alloy resulted in a significant transformation in the microstructure compared to the initial state of the parent material. The microstructure of the cladding zone exhibited a prominent martensite lath structure, with the thickness of martensite laths increasing proportionally with the laser power.
Analysis of surface microhardness revealed a nonlinear correlation with laser power. The microhardness distribution across the substrate depth demonstrated a general increase with depth, with higher laser power exhibiting reduced fluctuations in microhardness distribution compared to lower power settings.
Comparative analysis of residual stresses between the cladded samples and the parent material revealed a notable increase in average residual stresses on the surface of the cladded samples, ranging from 300 to 478.8% depending on the laser power. These residual stresses, predominantly tensile, signify the induction of stress during the laser cladding process. Furthermore, there was a discernible decrease in residual stresses with increasing laser power, underscoring the influence of processing parameters on induced stress levels and suggesting potential benefits in controlling residual stresses during material processing.
1.Wang K. The use of titanium for medical applications in the USA. Materials Science and Engineering. 1996;A213:134-137. DOI: 10.1016/0921-5093(96)10243-4
2.Boyer RR. Titanium for aerospace: Rationale and applications. Advanced Performance Materials. 1995;2:349-368. DOI: 10.1007/BF00705316
3.Boyer R. ASM Handbook Metallography and Microstructure. 9th ed. USA: ASM International; 2000. p. 460
4.Rae W, Rahimi S. Evolution of microstructure and residual stress in hot rolled Ti-6Al-4V plates subjected to different heat treatment conditions. In: Conference: European Conference on Residual Stresses 10 (ECRS10). Materials Research Proceedings. Vol. 6. USA: Materials Research Forum LLC; 2018. pp. 171-176. DOI: 10.21741/9781945291890-27
5.Deepak JR, Joy N, Krishnamoorthy A, Jaswanth CP, Harish G. Gas nitriding of CP grade – 2 commercially pure titanium and Ti6Al4V grade – 5 titanium alloy. Materials Today: Proceedings. 2021;44(Part 5):3744-3750. DOI: 10.1016/j.matpr.2020.11.586
6.Umapathi A, Swaroop S. Measurement of residual stresses in titanium alloys using synchrotron radiation. Measurement. 2019;140:518-525. DOI: 10.1016/j.measurement.2019.04.021
7.Meriaudeau F, Truchetet F, Grevey D, Vannes AB. Laser cladding process and image processing. Journal of Lasers in Engineering. 1997;6:161-187. DOI: 10.1117/12.251167
8.Vilar R. Laser cladding. Journal of Laser Applications. 1999;11:64-79. DOI: 10.2351/1.521888
9.Zhang H, Pan Y, Zhang Y, Lian G, Cao Q, Yang J. Influence of laser power on the microstructure and properties of in-situ NbC/WCoB–TiC coating by laser cladding. Materials Chemistry and Physics. 2022;290:126636. DOI: 10.1016/j.matchemphys.2022.126636
10.Gao W, Wang S, Hu K, Jiang X, Yu H, Sun D. Effect of laser cladding speed on microstructure and properties of titanium alloy coating on low carbon steel. Surface and Coating Technology. 2022;451:129029. DOI: 10.1016/j.surfcoat.2022.129029
11.Ulutan D, Ozel T. Machining induced surface integrity in titanium and nickel alloys: A review. International Journal of Machine Tools and Manufacture. 2011;51:250-280. DOI: 10.1016/j.ijmachtools.2010.11.003
12.Parlevliet PP, Bersee HEN, Beukers A. Residual stresses in thermoplastic composites—A study of the literature—Part I: Formation of residual stresses. Composites Part A: Applied Science and Manufacturing. 2006;37(11):1847-1857. DOI: 10.1016/j.compositesa.2005.12.025
13.Chen S-G, Zhang Y-D, Wu Q, Gao H-J, Gao Z-H, Li X. Effect of solid-state phase transformation on residual stress of selective laser melting Ti6Al4V. Materials Science and Engineering: A. 2021;819:141299. DOI: 10.1016/j.msea.2021.141299
14.Mehdi B, Badji R, Ji V, Allili B, Bradai D, Deschaux-Beaume F, et al. Microstructure and residual stresses in Ti-6Al-4V alloy pulsed and unpulsed TIG welds. Journal of Materials Processing Technology. 2016;231:441-448. DOI: 10.1016/j.jmatprotec.2016.01.018
15.Nalla R, Altenberger I, Noster U, Liu G, Scholtes, Ritchie BR. On the influence of mechanical surface treatments—Deep rolling and laser shock peening—On the fatigue behavior of Ti–6Al–4V at ambient and elevated temperatures. Materials Science and Engineering A. 2003;355:216-230. DOI: 10.1016/S0921-5093(03)00069-8
16.Wang S, Li Y, Yao M, Wang R. Compressive residual stress introduced by shot peening. Journal of Materials Processing Technology. 1998;73:64-73. DOI: 10.1016/S0924-0136(97)00213-6
17.Jażdżewska M. Effects of CO2 and Nd:YAG laser remelting of the Ti6Al4V alloy on the surface quality and residual stresses. Advances in Materials Science. 2020;20:82-90. DOI: 10.2478/adms-2020-0005
18.Ion JC. Laser Processing of Engineering Materials, Principles, Procedure and Industrial Application. Oxford, UK: Elsevier Butterworth Heinemann; 2005
19.du Plooy R, Akinlabi E. T: Analysis of laser cladding of titanium alloy. Materials Today: Proceedings. 2018;5:19594-19603. DOI: 10.1016/j.matpr.2018.06.322
21.Zhechao F, Hongwei F. Study on selective laser melting and heat treatment of Ti-6Al-4V alloy. Results in Physics. 2018;10:660-664. DOI: 10.1016/j.rinp.2018.07.008
22.Hosseini S, Farajollahi M, Ebrahimi M. Residual stress, fatigue behavior, and mechanical properties of equal-channel angular pressed commercial pure titanium. Journal of Materials Research and Technology. 2024;28:3297-3305. DOI: 10.1016/j.jmrt.2023.12.265
23.Matys J, Dominiak M, Flieger R. Energy and power density: A key factor in lasers studies. Journal of Clinical and Diagnostic Research. 2015;9(12):ZL01-ZL02. DOI: 10.7860/JCDR/2015/15561.6955
24.Trushin ES, Dasaev MR, Kalakutskaya OV, Voloshenko AP. On the method of calculating the energy density of laser radiation in a metal surface modification. Journal of Physics: Conference Series. 2021;2124:012014. DOI: 10.1088/1742-6596/2124/1/012014
25.Ali SR, Hussein AHA, Nofal A, Elnaby SIH, Elgazzar H. A contribution to laser cladding of Ti-6Al-4V titanium alloy. Metallurgical Research & Technology. 2019;116:634. DOI: 10.1051/metal/2019060
26.Mahamood RM, Akinlabi ET, Shukla M, Pityana S. Laser metal deposition of Ti6Al4V: A study on the effect of laser power on microstructure and microhardness. In: Proceedings of the International MultiConference of Engineers and Computer Scientists 2013 Vol II. Hong Kong: IMECS 2013; March 13-15, 2013; Hong Kong
27.Cottamac R, Brandt M. Laser cladding of Ti-6Al-4V powder on Ti-6Al-4V substrate: Effect of laser cladding parameters on microstructure. Physics Procedia. 2011;12:323-329. DOI: 10.1016/j.phpro.2011.03.041
28.Wang C, Li J, Wang T, Chai L, Deng C, Wang Y, et al. Microstructure and properties of pure titanium coating on Ti-6Al-4V alloy by laser cladding. Surface & Coatings Technology. 2021;416:127137. DOI: 10.1016/j.surfcoat.2021.127137
29.Abdulrahman KO, Mahamood RM, Akinlabi ET, Adediran AA. Effect of laser power on the microstructure and mechanical properties of laser deposited titanium aluminide composite. Advances in Materials and Processing Technologies. 2022;8(Suppl 3):1305-1316. DOI: 10.1080/2374068X.2021.1945268
30.Lee K-H, Choi S-W, Suh J, Kang C-Y. Effect of laser power and powder feeding on the microstructure of laser surface alloying hardened H13 steel using SKH51 powder. Materials and Design. 2016;95:173-182. DOI: 10.1016/j.matdes.2016.01.079
31.Jażdżewska M, Kwidzińska DB, Seyda W, Fydrych D, Andrzej Zieliński A. Mechanical properties and residual stress measurements of grade IV titanium and Ti-6Al-4V and Ti-13Nb-13Zr titanium alloys after laser treatment. Materials. 2021;14:6316. DOI: 10.3390/ma14216316
32.Xiao Z, Chen C, Zhu H, Hu Z, Nagarajan B, Guo L, et al. Study of residual stress in selective laser melting of Ti6Al4V. Materials and Design. 2020;193:108846. DOI: 10.1016/j.matdes.2020.108846
33.Lai Y, Liu W, Zhao J, Zhao Y, Wang F, Han W. Experimental study on residual stress in titanium alloy laser additive manufacturing. Applied Mechanics and Materials. 2013;431:20-26. DOI: 10.4028/www.scientific.net/AMM.431.20
34.Neto DM, Borges MF, Sérgio ER, Antunes FV. Effect of residual stresses on fatigue crack growth: A numerical study based on cumulative plastic strain at the crack tip. Materials. 2022;15:2156. DOI: 10.3390/ma15062156
35.Edwards P, Ramulu M. Surface residual stresses in Ti-6Al-4V friction stir welds: Pre- and post-thermal stress relief. Journal of Materials Engineering and Performance. 2015;24:3263-3270. DOI: 10.1007/s11665-015-1610-2
36.Kazantseva N, Krakhmalev P, Thuvander M, Yadroitsev I, Vinogradova N, Ezhov I. Martensitic transformations in Ti-6Al-4V (ELI) alloy manufactured by 3D printing. Materials Characterization. 2018;146:101-112. DOI: 10.1016/j.matchar.2018.09.042
37.Frankel J, Abbate A, and Scholz W: Measurement and theory of the dependence of hardness on residua stress. Journal of Experimental Mechanics. June 1993:164-168
38.Maleki E, Bagherifard S, Guagliano M. Correlation of residual stress, hardness and surface roughness with crack initiation and fatigue strength of surface treated additive manufactured AlSi10Mg: Experimental and machine learning approaches. Journal of Materials Research and Technology. 2023;24:3265-3283. DOI: 10.1016/j.jmrt.2023.03.193
Written By
Tankiso Lawrence Ngake and Kadephi Vuyolwethu Mjali
Submitted: 29 January 2024Reviewed: 08 February 2024Published: 26 April 2024