Open Access is an initiative that aims to make scientific research freely available to all. To date our community has made over 100 million downloads. It’s based on principles of collaboration, unobstructed discovery, and, most importantly, scientific progression. As PhD students, we found it difficult to access the research we needed, so we decided to create a new Open Access publisher that levels the playing field for scientists across the world. How? By making research easy to access, and puts the academic needs of the researchers before the business interests of publishers.
We are a community of more than 103,000 authors and editors from 3,291 institutions spanning 160 countries, including Nobel Prize winners and some of the world’s most-cited researchers. Publishing on IntechOpen allows authors to earn citations and find new collaborators, meaning more people see your work not only from your own field of study, but from other related fields too.
The integration of physical, chemical, and biological indicators of soil quality that have an impact on environmental factors and farmer profitability is the focus of soil health. Applying biochar is an effective technique to promote soil carbon sequestration, which is a component of soil quality. Rice husk biochar (RHB), produced from the pyrolysis of rice husk (RH), has a higher nutritious value than biochar made from wood. A field research was conducted to evaluate the short-term implications of RHB-derived nutrient translocation and distribution in rice crop, as well as their effects on soil nutrients, rice productivity, and methane (CH4) emissions in wetland Ultisol. The treatments included applying four organic fertilizers: rice husk biochar, daincha (Sesbania aculeata), jack tree (Artocarpus heterophyllus) leaves, and farm yard manure (FYM) at rates of 35 (N1), 70 (N2), and 105 (N3) kg N ha−1. The results showed that the application of RHB enhanced the uptake of soil organic carbon (SOC) as well as the production of rice grains and straw. The yield of brown rice increased with higher rates of N treatment. The RHB contributed a significant amount of carbon to the refractory paddy soil, which increased its carbon content in the crop as well. Consequently, there was a significant 50–60% drop in CH4 emissions from soil as compared to FYM.
Department of Soil Science and Agricultural Chemistry, Kerala Agricultural University, Vellanikkara, Thrissur, Kerala, India
Betty Bastin
Department of Soil Science and Agricultural Chemistry, Kerala Agricultural University, Vellanikkara, Thrissur, Kerala, India
Sandeep Sasidharan
Department of Soil Science and Agricultural Chemistry, Kerala Agricultural University, Vellanikkara, Thrissur, Kerala, India
*Address all correspondence to: rajalekshmiharish@gmail.com
1. Introduction
Wetland paddy fields contribute significantly to greenhouse gas emissions in the present climate change scenario, particularly methane (CH4) and carbon dioxide (CO2), depending on the availability of water. The wetland rice fields are responsible for around 25% of the 500 Tg yr−1 of methane emissions that occur globally each year. Sequestration of soil organic carbon (SOC) is one of the most effective methods to increase soil organic matter (SOM) reserves and to mitigate the potential greenhouse effect [1]. The process of soil carbon sequestration is impacted by greenhouse gas emissions, which lower the amount of carbon stored in the soil. The types of soils, temperatures, types of plants, erosion, and land management all have a significant impact on the addition and removal of organic carbon from soils. Breakdown of SOC in cultivated soils has contributed approximately 50 Pg C to the atmosphere [2]. This has promoted a strategy of enhancing soil carbon sequestration in agricultural systems to offset CO2 increase. The use of various organic sources, such as manures, plant leftovers, and waste materials, in farming might enhance the chemical and biological qualities of soils [3]. Several studies have reported that biochar application increased crop yield by improving the physicochemical properties [4, 5], whereas some studies have observed a reduction in grain yield due to N limitation caused by the high C:N ratio of biochar [6].
Biochar is a solid material created through the thermochemical conversion of biomass under oxygen-limiting circumstances. Biochar contains carbon (C) that remains in the soil for long periods of time, making it an excellent alternative for increasing soil carbon sequestration. However, the moderating effect of biochar application on global warming remains debatable since it may alter the production and consumption of greenhouse gases (GHGs) other than CO2, such as methane (CH4) and nitrous oxide (N2O) in soil. Its effect on GHG emission varies according to circumstances such as soil type, fertility, and moisture content, as well as the feedstock and pyrolysis temperature utilized to produce the biochar [7]. Soil temperature and soil moisture are important factors controlling CO2 fluxes by their influence on organic matter decomposition.
Rice husk biochar (RHB) is considered to be one of the most cost-effective biochars used in rice-based farming systems [8]. A by-product of rice production, rice husk makes up 22% of the yield of brown rice. When applied to soil, it has the potential to improve soil fertility, increase the mean residence time of soil organic C (SOC) content, and dramatically reduce greenhouse gas emissions [9, 10, 11].
Perennial cropping methods have recently acquired popularity because they reduce the escape of carbon into the atmosphere, aiding soil carbon storage and climate change mitigation efforts. In the tropics, however, short-term interventions may produce bigger responses because turnover durations for fast-cycling soil C are shorter [12].
Little attention has been made to the short-term impact of various organic sources on carbon sequestration and its fractions. In light of this, the current study was conducted in a rice crop under rainfed conditions to assess the effect of four contrasting organic sources, giving importance to the rice husk biochar, on carbon sequestration/emission and their effects on rice productivity in a typical Ultisol.
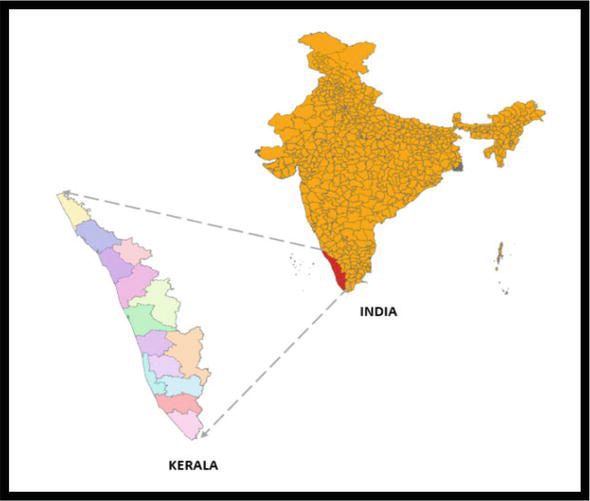
A field experiment was conducted in a farmer’s field near Agricultural University, Thrissur, Kerala, India (10°31′49″N and 76°12′53″E, 10 m above sea level) from September 2015 to February 2016 (Figure 1). The soil of the experimental site was sandy clay loam (Ultisol) with pH (4.66), available N (401.76 kg N ha−1), and organic C content (1.05%). The experiment was laid out in a randomized block design with 5.0 m × 4.0 m plot size with three replications. The treatments included four organic sources [farm yard manure (FYM), Artocarpus (jack tree) leaves (ART), Sesbania aculeata (daincha) (DNC), and rice husk biochar (RHB)] in the absence or presence of N mineral fertilizer and the details are provided in Table 1. RHB was produced by pyrolysis at 350–400°C from the rice husk collected from a farmer’s field near the experimental site. The physicochemical characteristics of the organic sources (FYM, DNC, ART, and RHB) are presented in Table 2.
Figure 1.
Location of field.
Sl. no.
Treatments
Description
1
T1
No organic manure + 35 kg N ha−1
2
T2
No organic manure + 70 kg N ha−1
3
T3
No organic manure + 105 kg N ha−1
4
T4
Farmyard manure @ 5 t ha−1 + 35 kg N ha−1
5
T5
Farmyard manure @ 5 t ha−1 + 70 kg N ha−1
6
T6
Farmyard manure @ 5 t ha−1 + 105 kg N ha−1
7
T7
Artocarpus sp. @ 5 t ha−1 + 35 kg N ha−1
8
T8
Artocarpus sp. @ 5 t ha−1 + 70 kg N ha−1
9
T9
Artocarpus sp. @ 5 t ha−1 + 105 kg N ha−1
10
T10
Daincha @ 5 t ha−1 + 35 kg N ha−1
11
T11
Daincha @ 5 t ha−1 + 70 kg N ha−1
12
T12
Daincha @ 5 t ha−1 + 105 kg N ha−1
13
T13
Rice husk biochar @ 5 t ha−1 + 35 kg N ha−1
14
T14
Rice husk biochar @ 5 t ha−1 + 70 kg N ha−1
15
T15
Rice husk biochar @ 5 t ha−1 + 105 kg N ha−1
Table 1.
Treatment details.
Sl. no.
Property
Rice husk biochar
Farmyard manure
Artocarpus heterophyllus (leaves)
Daincha
1
pH
9.10
7.5
4.85
5.80
2
EC (dS m−1)
0.26
0.31
0.14
0.45
3
OC (%)
43.7
22.32
20.36
9.17
4
C:N
68.28
12.90
27.83
11.70
Table 2.
Physicochemical properties of organic sources.
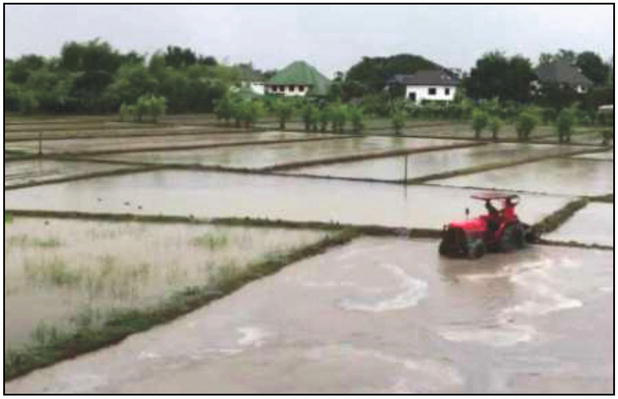
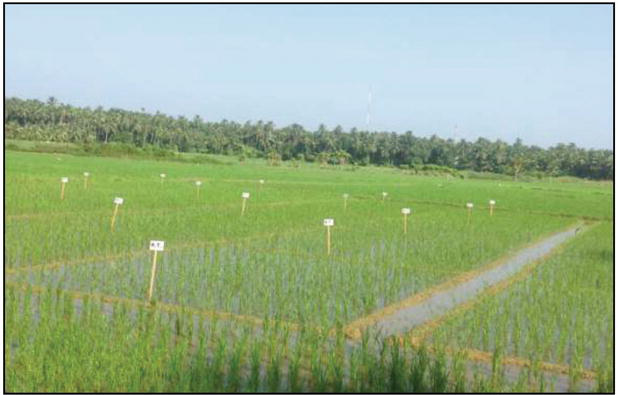
Eighteen-day-old rice seedlings of short-duration variety ‘Jyothi’ were transplanted manually at a distance of 15 cm from row to row and 10 cm from plant to plant (Figures 2 and 3). CH4 fluxes during rice cultivation period and soil chemical properties after rice harvest were measured. Yield and yield attributes were recorded, and straw, grain, and root samples were analyzed for nutrient content.
Figure 2.
Field preparation.
Figure 3.
View of transplanted paddy field.
2.2 Crop management
Organic sources (FYM, DNC, ART, and RHB) were thoroughly mixed in the treatment plots 15 days prior to transplanting. Two rice seedlings (Oryza sativa L.) at the 3–4 leaf stage were transplanted as one hill. Urea, superphosphate, and muriate of potash were used to apply N, P, and K, respectively. Half of the N and K doses, as well as the entire amount of P, were applied as basal, with the remaining N and K administered as top dressing 1 week before panicle initiation. The daily mean air temperature ranged from 25.0°C to 31.0°C during the experiment period.
2.3 Measurements
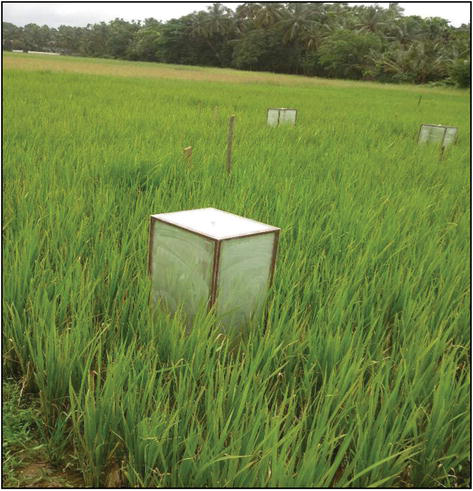
The CH4 flux was measured in triplicate following a closed chamber method [13]. A translucent acrylic chamber of 1.0 meters in height and 0.30 by 0.45 meters in bottom area was placed over six hills, and it was sealed with water surrounding it (Figure 4). Gas samples were collected at three stages of the crop, viz., active tillering, panicle initiation, and near harvest. The emission of gases from the plots was compared to that from the fallow wetlands. At the start of the sampling (time, t = 0), air sample from the box was drawn into a 20 ml plastic syringe fitted with a three-way stop-cock and closed. A second sample was collected in the same manner after a time interval of 20 minutes (time, t = 20 min). Sampling was done between 11.00 AM and 01.00 PM. The samples were brought to the laboratory and methane concentrations were determined by gas chromatography on a Flame Ionization Detector (FID). The CH4 flux was calculated as a temporal change in the gas concentration at 0 and 20 min. The soil redox potential (Eh) at a depth of 5 cm during the experiment was monitored using a portable Eh meter. Cumulative CH4 flux and its effect on yield as yield-scaled CH4 flux were also calculated.
Figure 4.
Box chamber with hills placed in the field for GHG collection.
The soil samples collected after the rice harvest were sieved (<2 mm) and analyzed. Soil pH and electrical conductivity (soil:H2O @ 1:2.5) were determined using a pH meter and EC meter. The rice grain and straw yield and yield parameters like root biomass, LAI, productive tillers per panicle, percentage of ripened grains, and 1000 grain weight were also recorded. Grain, straw, and root samples were separately analyzed for total N content. The N uptakes were calculated by multiplying the nutrient concentrations and the rice grain or straw weight for each plant.
2.4 Statistical analyses
Analysis of variance (ANOVA) was done using OP-STAT and WASP to test the level of significant difference between treatment means [14].
2.5 Growth, yield, and yield components of rice crop
Among the yield parameters, root biomass and LAI increased with higher N rates (Table 3). The maximum values were obtained in treatments having daincha with 70 kg N ha−1 (137.80 g m−2 and 6.77) and FYM with 70 kg N ha−1 (137.01 g m−2 and 6.61). The number of productive tillers per panicle and percentage of ripened grains were also maximum in FYM + 70 kg N ha−1 (6.50 and 82.60) followed by the treatment-receiving daincha +70 kg N ha−1 (6.39 and 81.31). The lowest value for the yield attributes was measured in treatment with no organic manure. A maximum grain yield of 3940.33 kg ha−1 was recorded with the treatment having daincha and 35 kg N ha−1 while RHB with nitrogen at 105 kg ha−1 produced a comparable grain yield of 3732.13 kg ha−1 along with a maximum straw yield of 4879 kg ha−1. Liming effect of biochar in acidic soil along with increased nutrient retention may be the most important factors for increased crop yields [15]. Further, the ‘fertilizer effect’ of biochar with the supply of important plant nutrients such as K, N, Ca, and P in soil could have an additional effect on crop yield. With RHB at higher N application rates, the number of productive tillers per panicle and the percentage of ripened grains increased which had a positive effect on brown rice yield and the straw yield while 1000 grain weight showed a reverse trend. The depletion of SOC status and related nutrients may be the cause of the low grain yield of rice in the treatment that did not receive any organic manure. These outcomes concur with the research reported in Kumari et al. [16].
Treatment
Yield (kg ha−1)
Root biomass (g m−2)
LAI tillers
No. of productive filled grains
LAI tillers
Percentage of weight (g)
1000 grain
Grain
Straw
T1
3489.00
4722.33
128.67
6.54
5.16
73.82
23.4
T2
3529.33
4606.00
129.43
6.58
5.69
73.72
23.69
T3
3562.33
4582.00
132.02
6.60
5.29
74.56
24.36
T4
3771.67
4374.67
135.46
6.57
5.57
80.21
25.21
T5
3894.00
4477.33
137.01
6.61
6.50
82.60
28.10
T6
3831.67
4294.33
136.67
6.59
5.94
82.06
27.27
T7
3536.00
4360.00
129.70
6.57
5.18
74.45
24.53
T8
3576.67
4431.67
131.69
6.58
5.50
75.83
25.47
T9
3662.33
4590.00
132.60
6.57
5.63
76.33
25.78
T10
3940.33
4416.67
135.75
6.75
6.37
80.19
26.83
T11
3866.67
4496.00
137.80
6.77
6.39
81.31
27.17
T12
3813.33
4445.67
136.62
6.73
5.66
77.88
26.7
T13
3687.33
4651.67
129.62
6.59
5.33
74.69
25.62
T14
3726.73
4689.33
130.83
6.62
5.67
75.95
25.53
T15
3732.13
4879.00
133.15
6.64
5.68
76.09
25.58
CD (0.05)
28.61
135.14
0.54
0.014
0.39
1.64
0.73
Table 3.
Growth, yield and yield components of rice crop.
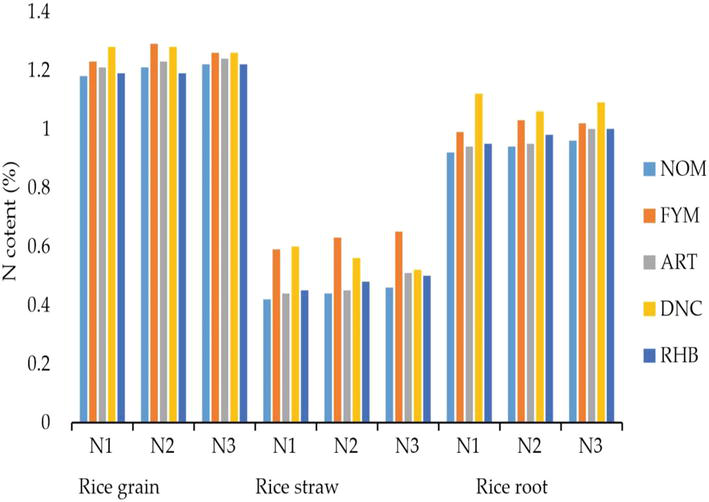
2.6 N concentrations in rice plants
The maximum grain N (Figure 5) was obtained with FYM + 70 kg N ha−1 (1.29%), and daincha at the same dose of N recorded at 1.28%. FYM, with a higher level of N retained 1.26%. The maximum straw nitrogen (0.65%) was observed in treatment with FYM + 105 kg N ha−1. Treatments, daincha, and FYM with 35 kg N ha−1 recorded on par values. Daincha with 35 kg N ha−1 had maximum N content in the root (1.12%) while it was 1.09% in treatment-receiving daincha with 105 kg N ha−1.
Figure 5.
N concentrations of rice crop.
The N content was found to be higher in plant parts when the organic sources like FYM and daincha were amended with a medium dose of nitrogen (70 kg N ha−1 as per KAU POP) than higher levels of N. This could be ascribed to the inhibition of SOM decomposition by adding urea at higher levels, which necessitates additional C requirements for microbes. A higher value of N content in grain, root, and straw could also be attributed to the ability of organic manures to supply nutrients continuously during the growth period of crop as a result of mineralization and improvement of the physical and chemical properties of the soil. This result is in line with the findings of Sharma et al. [17]. Many scientists have also observed negative or non-significant effects of N on the decomposition of organic matter [18, 19].
2.7 Soil chemical properties and C sequestration
The maximum pH of 5.15 was recorded for the treatment having RHB with a lower N level (Table 4) owing to the alkalinity of RHB (pH 9.1) and liming value of biochar [20] while the treatment with 105 kg nitrogen without any organic manure had a minimum pH of 4.58. According to most reports, the presence of ash residues including significant levels of silica, heavy metals, sesquioxides, phosphates, and trace quantities of organic and inorganic nitrogen was responsible for the preferred pH shift brought about by the application of biochar [21].
Treatment
pH
EC
OC
Avail. N
T1
4.60
0.045
0.64
427.85
T2
4.59
0.056
0.94
438.23
T3
4.58
0.058
0.82
451.49
T4
63
0.055
1.16
463.35
T5
4.62
0.055
1.14
474.30
T6
4.62
0.064
1.1
459.40
T7
4.63
0.043
1.20
425.89
T8
4.61
0.046
1.01
431.61
T9
4.61
0.048
1.01
453.98
T10
4.73
0.063
1.06
590.69
T11
4.70
0.117
1.14
595.71
T12
4.70
0.145
1.12
596.38
T13
5.15
0.045
1.94
475.44
T14
5.01
0.086
1.23
477.28
T15
5.00
0.144
1.05
487.51
CD AxB (0.05)
0.012
0.001
0.20
1.637
Table 4.
Chemical properties of soil.
When compared to other organic sources, the RHB treatment had a greater SOC concentration; this was greatest in the RHB + 35 kg N (1.94%) treatment. This 50–70% increase above the control [22] might be the result of applying C-rich organic material (RHB) to acidic soils, which raised the pH of the soil and its SOC content [23]. Further, the low rate of degradation of organic matter in waterlogged conditions compared to the upland aerobic situations could have favored SOC addition. Similar results were obtained by Rajalekshmi and Bastin [10].
Significant variation in EC of the soil was noticed and it ranged between 0.043 dS m−1 and 0.145 dS m−1 in the top 15 cm of the soil. However, the individual effect of organic sources or nitrogen levels on EC was non-significant. The highest EC value of 0.145 dS m−1 was observed in treatment having daincha and 105 kg N ha−1 while minimum EC (0.043 dS m−1) was associated with ART. RHB with a lower dose of N recorded a value of EC (0.045 dS m−1) and with increasing doses of N, the EC touched 0.144 dS m−1 which was on par with the highest value showing the impact of an additional dose of inorganic N.
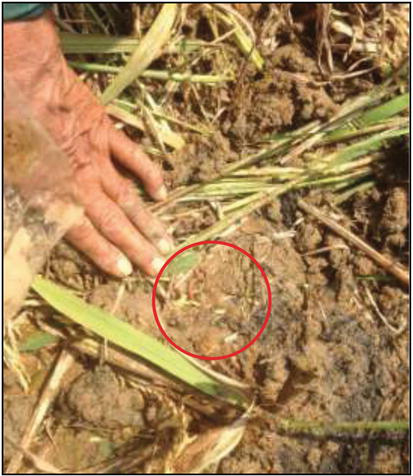
Available N was the highest where the application of daincha (Sesbania aculeata) was adopted along with fertilizer application and was maximum in the treatment having daincha +105 kg N ha−1 (596.38 kg ha−1). It was also observed that the soil available nitrogen increased with increasing N levels of nitrogen, but with SOC content, the reverse trend was noticed. Ding et al. [15] found that green manuring combined with fertilizer application increased the available N content in soil and our result was also the same. The extent of availability of nutrients depends not only on the type of organic additives added but also on the build-up of microorganisms-enhanced mineralization (Figure 6) [24]. The availability of soil N remained higher in the treatments with biochar (475.44–487.51 kg ha−1) despite greater nutrient removal for plant growth and higher grain yields.
Figure 6.
Biochar-treated plot with earthworms.
2.8 Soil redox potential (Eh) and CH4 emission
During the paddy crop growth period, soil Eh steadily dropped and stayed at around −170 mV between 50 DAT. There was no discernible variation in soil Eh between the treatments during the trial. CH4 fluxes increased in nearly all treatments when the crop reached the heading stage, or around 70 days after planting, and the soil Eh fell below −150 mV.
2.9 Methane emission
Methane emission at the active tillering stage (AT) was highest in the treatment having FYM with 35 kg N ha−1 (15.30 mg m−2 h−1), and it was lowest (0.86 mg m−2 h−1) with the same organic source at 105 kg N ha−1 (Table 5). The emission from the fallow plot was 1.36 mg m−2 h−1. The emission rate of methane was in the order of FYM > daincha > no organic manure > Artocarpus > RHB.
Treatments
Methane emission (mg/m2/h)
Cumulative methane emission (mg/m2/h)
Yield scaled methane emission (×10−3) g CH4/kg rice yield
Active tillering
Panicle initiation
Near harvest
T1
7.47
10.40
2.21
20.08
57.55
T2
5.76
13.38
0.14
19.28
54.63
T3
6.46
4.88
0.12
11.46
32.17
T4
15.30
19.89
0.15
35.34
93.70
T5
12.86
17.32
0.94
31.12
79.92
T6
0.86
1.23
0.13
2.22
5.79
T7
6.63
15.19
0.13
21.95
62.10
T8
8.41
13.01
0.87
22.29
62.32
T9
3.95
12.10
0.14
16.19
44.21
T10
9.57
12.03
1.10
22.70
57.61
T11
5.06
18.21
0.16
23.43
60.61
T12
4.43
0.11
0.12
4.66
12.22
T13
3.74
13.77
0.18
17.69
47.82
T14
3.68
12.10
1.15
16.93
44.94
T15
3.63
10.36
0.23
14.22
37.51
CD (AxB) (0.05)
0.016
0.017
0.017
0.018
0.013
Table 5.
Influence of organic sources on CH4 emission.
The treatment, FYM with 35 kg N ha−1 had the highest methane emission (19.89 mg m−2 h−1), and it was lowest in daincha +105 kg N ha−1 (0.11 mg m−2 h−1) at the panicle initiation stage (PI). The rate of emission decreased when the quantity of N fertilizer increased to 105 kg N ha−1 with and without organic sources. Treatments with Artocarpus/RHB had emissions ranging from 10 to 15 mg m−2 h−1 while the fallow plot had an emission value of 2.97 mg m−2 h−1.
At the near harvest stage (NH), maximum emission was noticed in the treatment with 35 kg N ha−1 (2.21 mg m−2 h−1), and it was minimum with daincha + 105 kg N ha−1 (0.12 mg m−2 h−1). RHB with 70 kg N ha−1 had the highest emission to the tune of 1.15 mg m−2 h−1 followed by daincha with 35 kg N ha−1 (1.1 mg m−2 h−1). When the treatments were amended with 70 kg N ha−1, the rate of emission increased except in daincha and inorganic N alone treatments. As the quantity of N was further increased, the emission value was reduced. The emission from the fallow plot was 0.14 mg m−2 h−1.
Methane production was the highest in FYM-treated plots at active tillering and panicle initiation stages compared to near harvest stage. This may be attributed to the higher activity of microbial populations, especially methanogens in FYM-supplied soil. The addition of inorganic fertilizer might have acted as a source of electron donors, thus increasing methanogens in these treatments under a flooded rice soil system. Thus, urea could enhance CH4 emissions over the growing seasons which might be due to an increase in soil pH following urea hydrolysis and a decrease in redox potential. These two processes could have enhanced methanogenic activities. Dubey [25] pointed out that CH4 emission depends on the nature, quantity, and method of fertilizer application. Maximum emission was seen in the study by Linquist et al. [26].
2.10 CH4 fluxes
The treatment with FYM had significantly higher CH4 flux than other organic sources and was maximum in FYM + 35 kg N ha−1 (35.34 mg m−2 h−1) and minimum with 105 kg N ha−1 (2.22 mg m−2 h−1). The increase in different stages was not proportional to the levels of inorganic sources. The cumulative CH4 emission increased in FYM-treated plots by 55 to 75% to that of control (Table 5). RHB treatment recorded higher CH4 flux from the AT to PI stage but it remained in lower levels at NH stage. Similarly, RHB with 105 kg N ha−1 recorded a minimum cumulative emission of 14.22 mg m−2 h−1 compared to other N levels. Consequently, the cumulative CH4 emission for RHB was 50–60% lower than that for FYM, although differences between the treatments were non-significant.
It is evident that the physicochemical properties of the microbial population and the soil environment have an impact on the GHG emissions from organic sources. The cumulative methane emission was higher in FYM-treated plots compared to other organic sources and with biochar-amended soil, it was less. The use of daincha as an organic source significantly reduced both leaching and gaseous loss of fertilizer N in soil, and this is in line with the findings of Bhattacharyya and Mandal [27]. Similarly, due to the biological stabilization of carbon and nitrogen in soil, RHB reduced CH4 emissions and, consequently the global warming potential (GWP).
2.11 Yield-scaled CH4 emission and soil C sequestration
The treatment-receiving RHB induced minimum CH4 fluxes compared to other organic sources. The yield-scaled CH4 emission increased with FYM by 30.00–45.00% compared to control T1 (Table 5), and a minimum was also recorded in this treatment (5.79 × 10⁻³ g/kg rice). In the RHB treatment, the CH4 emission was reduced to nearly half compared to the FYM (40–48 × 10−3 g/kg rice), and it was less than control also. The results under yield and yield attributes of rice clearly showed significant variation among the treatments. The data showed that for producing the same kg of rice, the CH4 emission was less in the RHB compared to other organic sources, and it followed the order FYM > ART > DNC > RHB. The values for DNC and RHB were on par. The growth attributes, leaf area index, and root biomass production had significant effect on yield. The organic amendments application resulted in increased plant growth and a higher leaf area index. This might be associated with the fact that a considerable amount of nutrients, especially nitrogen, could be released from organic materials for plant use, essential for chlorophyll and protoplasm formation. Further, due to the cementing action of polysaccharides and other organic compounds released during the decomposition of organic matter, taller and heavier plants were produced. Babu et al. [28] reported that plant height was significantly influenced by the application of organic manure and chemical fertilizers. These observations are in line with the findings of Mansour [29] and Selvaraj et al. [30]. Agronomic practices such as appropriate nutrient supply could increase the total amount of both root and shoot biomass [31]. Application of green manure or other organic fertilizers improved soil physicochemical and microbiological parameters, and they could have contributed to sustainable productivity in flooded rice soil. Further, the enhanced soil biological properties provided resiliency and buffering capacity of soil to ameliorate the stress [32].
The study showed that applying RHB to paddy soil, Ultisol increased both rice output and the short-term soil carbon budget. The paddy soil received notable levels of C from RHB. RHB supplied significant amounts of C to the paddy soil with minimal effect on CH4 emission, thereby sequestering more carbon in soil. The cumulative methane emission was 50–60% less compared to the FYM in the wetland paddy soil, which ultimately reduced the yield-scaled emission. The uptake of N by rice plants increased with higher rates of inorganic source application. This led to a notable rise in the number of grains and percentage of matured grains in the rice plants, which in turn raised the production of rice. Application of RHB as organic source also yielded an appreciable rice yield. Since the nutrients in these organic sources are released gradually, RHB application in the field (equal to 5 Mg ha−1 of rice husk) could be recommended once over a period of 3 or 4 years, or in lesser amounts in ongoing applications. Long-term field studies are needed to determine the optimum RHB application rates and frequencies for increasing the rice yield under different soil types and environmental conditions.
References
1.Lal R. Soil carbon sequestration to mitigate climate change. Geoderma. 2004;123(1):1-22
2.Paustian K, Collins HP, Paul EA. Management controls on soil carbon. In: Paul EA, Paustian KA, Elliot ET, Cole CV, editors. Soil Organic Matter in Temperate Agroecosystems: Long-Term Experiments in North America. New York: CRC Press; 1997. pp. 15-49
3.Goyal S, Mundra MC, Chander K, Kapoor KK. Influence of inorganic fertilizers and organic amendments on soil organic matter and soil microbial properties under tropical conditions. Biology and Fertility of Soils. 1999;29(2):196-200
4.Glaser B, Lehmann J, Zech J. Ameliorating physical and chemical properties of highly weathered soils in the tropics with charcoal – A review. Biology and Fertility of Soils. 2002;35:219-230
5.Lehmann J, Rondon M. Biochar soil management on highly eathered soil in the humid tropics. In: Uphoff N et al., editors. Biological Approaches to Sustainable Soil Systems. Boca Raton, FL: CRC Press; 2006. pp. 517-530
6.Asai H, Benjamin KS, Stephan MH. Biochar amendment techniques for upland rice production in northern Laos: 1. Soil physical properties, leaf SPAD and grain yield. Field Crops Research. 2009;111:81-84
7.Lehmann J, Joseph S. Biochar for environmental management: An introduction. In: Lehmann J, Joseph S, editors. Biochar for Environmental Management-Science and Technology. London: Earthscan Publisher; 2009. pp. 1-12
8.Ogawa M, Okimori Y. Pioneering works in biochar research, Japan. Australian Journal of Soil Research. 2010;48(7):489-500
9.Lehmann J, Cheng CH, Nguyen B, Liang B, Major J, Smernik R. Permanency and long term changes of bio-char in soil. In: International Agriculture Initiative (IAI) Conference, Terrigal, Australia. Biogeochemistry. 2007. p. 23
10.Rajalekshmi K, Bastin B. Biochar as an organic source for soil carbon sequestration in acidic soil of Kerala. Journal of Soil and Water Conservation. 2019;18(3):307-310
11.Rodríguez L, Salazar P, Preston TR. Effect of biochar and biodigester effluent on growth of maize in acid soils. Livestock Research for Rural Development. 2009;21:102-110
12.Trumbore SE. Potential responses of soil organic carbon to global environmental change. Proceedings of the National Academy of Sciences of the United States of America. 1997;94:8284-8291
13.Hutchinson GL, Mosier AR. Improved soil cover method for field measurement of nitrous oxide fluxes. Soil Science Society of America Journal. 1981;45(2):311-316
14.Sheoran OP, Tonk DS, Kaushik LS, Hasija RC, Pannu RS. Statistical software package for agricultural research workers. In: Recent Advances in Information Theory, Statistics and Computer Applications, Department of Mathematics Statistics. Hisar: CCS HAU; 1998. pp. 139-143
15.Ding Y, Liu Y, Wu W, Shi D, Yang M, Zhong Z. Evaluation of biochar effects on nitrogen retention and leaching in multi-layered soil columns. Water, Air, and Soil Pollution. 2010;213:47-55
16.Kumari GSK, Thakur SK, Kumar V, Kumar N, Singh SK. Long term effect of fertilizer, farm- yard manure and lime on yield sustainability and soil organic carbon pools under soybean (Glycine max)- wheat (Triticum aestivum) cropping system in Alfisol. Journal of Soil and Water Conservation. 2019;18(2):196-204
17.Sharma MP, Bali SV, Gupta DK. Crop yield and properties of inceptisol as influenced by residue management under rice- wheat cropping sequence. Journal. Indian Society of Soil Science. 2000;48:506-509
18.Ramirez KS, Craine JM, Fierer N. Nitrogen fertilization inhibits soil microbial organic carbon in deep soil layers controlled by fresh carbon supply: Nature nutrients. Netherlands Journal of Agricultural Science. 2010;41:327-341
19.Vallack HW, Leronni V, Metcalfe DB, Hogberg P, Ineson P, Subke J. Effect of somotic, alkaline, acid or thermal stresses on the growth and inhibition of listeria monocytogenes. Journal of Applied Microbiology. 2012;86:469-476
20.Arocena JM, Opio C. Prescribed fire-induced changes in properties of sub-boreal forest soils. Geoderma. 2003;113:1-16
21.Raison RJ. Modification of the soil environment by vegetation fires, with particular reference to nitrogen transformation: A review. Plant and Soil. 1979;51:73-108
22.KAU. Package of Practices Recommendations. Thrissur: Directorate of Extension, Kerala Agricultural University; 2011. 140 p
23.Haynes RJ, Mokolobate MS. Amelioration of Al toxicity and P deficiency in acid soils by additions of organic residues: A critical review of the phenomenon and the mechanisms involved. Nutrient Cycling in Agroecosystems. 2001;59:47-63
24.Kaur M, Saini SP. Effect of long term rice straw incorporation on soil phosphorus availability in a sandy loam soil. Journal of Soil and Water Conservation. 2019;18(2):144-149
25.Dubey SK. Microbial ecology of methane emission in rice agroecosystem: A review. Applied Ecology and Environmental Research. 2005;3:1-27
26.Linquist BA, Borbe MA, Pittelkow CM, Kessel CV, Groenigen KJV. Fertilizer management practices and greenhouse gas emissions from rice systems: A quantitative review and analysis. Field Crops Research. 2012;135:10-21
27.Bhattacharyya K, Mandal SR. Effect of green manuring on growth parameters and yield of rainfed rice. Environment and Ecology. 1996;14:446-450
28.Babu S, Marimuthu R, Manivannan V, Kumar RS. Effect of organic and inorganic manures on growth and yield of rice. Agricultural Science Digest. 2001;21(4):232-234
29.Mansour HA. Influence of soil amendments and NPK fertilization on the growth and chemical composition of Senna sulfurea plants grown in a sandy soil. Annals of Agricultural Science. 2002;40(3):1779-1796
30.Selvaraj N, Ramaraj B, Devrajan K, Sreenivasan N, Senthil Kumar S, Sakthi E. Effect of organic farming on growth and yield of thyme. In: National Seminar on Production and Utilisation of Medicinal Plants. Tamilnadu: Annamalai University; 2003. pp. 13-14
31.Grechi I, Vivin P, Hilbert G, Milin S, Robert T, Gaudille‘re, J.P. Effect of light and nitrogen supply on internal C:N balance and control of root to-shoot biomass allocation in grapevine. Environmental and Experimental Botany. 2007;59:139-149
32.Karlen DL, Eash NS, Unger PW. Soil and crop management effects on soil quality indicators. American Journal of Alternative Agriculture. 1992;7(1-2):48-55
Written By
Kamala Rajalekshmi, Betty Bastin and Sandeep Sasidharan
Submitted: 01 February 2024Reviewed: 28 February 2024Published: 26 April 2024