Open Access is an initiative that aims to make scientific research freely available to all. To date our community has made over 100 million downloads. It’s based on principles of collaboration, unobstructed discovery, and, most importantly, scientific progression. As PhD students, we found it difficult to access the research we needed, so we decided to create a new Open Access publisher that levels the playing field for scientists across the world. How? By making research easy to access, and puts the academic needs of the researchers before the business interests of publishers.
We are a community of more than 103,000 authors and editors from 3,291 institutions spanning 160 countries, including Nobel Prize winners and some of the world’s most-cited researchers. Publishing on IntechOpen allows authors to earn citations and find new collaborators, meaning more people see your work not only from your own field of study, but from other related fields too.
In developing countries, in general, especially in universities, the management of wastewater and excreta remains one of the major concerns. This uncontrolled practice can have negative im-pacts on the environment such as deforestation and global warming. The recovery of domestic wastewater through the production of biogas (methanization) is beneficial both on the environmental level and on the energy level (electricity, heat) and social, especially in universities where the increase of the students is accompanied by growth in energy consumption. This article delves into the physicochemical and biological processes involved in wastewater treatment, while also making predictions about the behavior of various variables such as methane, nitrogen, acetogenic microorganisms, and methanogenic biomasses. This approach allows knowing the variation of the biomass according to the type of bacteria. Indeed, it shows the relation, which exists between the biomass and the organic load. It is firstly noted in the results that the mean value of the biomass of acidogenesis and that of the biomass of methanogenesis are approximately equal to 0.67 d−1. Secondly, the nitric acid concentration is around 47.5 mgN/l/h and that of the viscosity is estimated to 0.046 Pa.s. Afterward, the temperature and the pH favor the activity of anaerobic bacteria. We finally conclude that an experimental device of 71m3 intended for the accumulation of sludge will be designed and built.
Research Team in Renewable Energies, Materials and Laser of Department of Physics, UFR SATIC – Alioune DIOP University of Bambey, Bambey, Senegal
Amadou Diao
Department of Physics, Faculty of Science and Technology – Cheikh Anta Diop University, Laboratory of Semiconductors and Solar Energy, Dakar, Senegal
Fakoro Souleymane Dia
Research Team in Renewable Energies, Materials and Laser of Department of Physics, UFR SATIC – Alioune DIOP University of Bambey, Bambey, Senegal
Senghane Mbodji
Research Team in Renewable Energies, Materials and Laser of Department of Physics, UFR SATIC – Alioune DIOP University of Bambey, Bambey, Senegal
*Address all correspondence to: nianeibrahima70@gmail.com
1. Introduction
Generally, in Senegal and particularly, in the site of Ngoundiane, septic tanks are built without any rule of design and sizing.
The aim of this study is to propose a mathematical model that helps researchers to better understand the physicochemical and biological processes of wastewater. This model can probably predict the behavior of variables such as methane, nitrogen, acidogenic microorganisms, and methanogenic biomasses of a septic tank digester. This study also aims to determine the growth of anaerobic microorganisms thanks to the kinetic constants, which correspond the maximum specific growth rate (μmax), the half-saturation constant (Kds), and the biomass mortality rate) to constitute an essential support for the development of a global model of septic tank operation, which takes into account not only setting but also anaerobic digestion.
This research aims to model the digester to understand its physical, chemical, and biological process, as well as to evaluate its financial viability (Table 1).
The idea is always to use the available materials as much as possible in order to reduce manufacturing costs as possible. Lansing et al. [5] stated that most anaerobic digesters encountered in developing countries lack a heating and agitation system for the digestate.
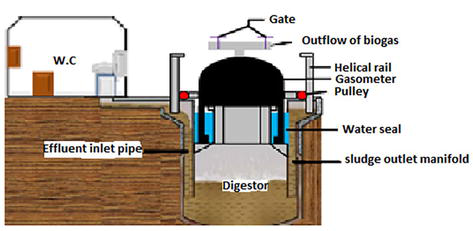
We were, therefore, inspired by the Puxin digester model developed by the company from Shenzhen (China), which is represented in Figure 1.
Figure 1.
Model digester septic tank.
The cylindrical body of the digester is made of reinforced concrete to ensure its tightness and to maintain the temperature of organic matter. In fact, to strengthen thermal insulation, the digester is buried in the ground about 4/5 of its height [6]. The concrete construction not only ensures a long service life of the installation but also avoids investments in the purchase of insulation material (glass wool, etc.)
The useful capacity of a septic tank is calculated based on the volume of sludge accumulation and the volume occupied by the organic matter. This volume also depends on the period between two emptying, the sludge accumulation rate, and the sludge occupation rate, which is not only 50% of the useful volume of the pit at the time of emptying but also on [6]. According to Coulibaly et al. [7], the specific production that corresponds to the quantity of sludge produced per inhabitant and per day is equal to 0.4 liters per day and per inhabitant. The retention time of sludge inside the pits is estimated at 2.5 to 3 years for a more efficient biological activity [8].
The useful capacity of a septic tank is given by the following mathematical relationship [6]:
Vu=0.0004×Na×365×tret×2E1
Vu=71m3
with:
Vu means volume of sludge accumulation in cubic meter,
Na is the number of inhabitants,
tret corresponds the sludge retention time in year.
2.1.1.1 Modeling of heat transfers between the inside and the outside of the digester: Steady state
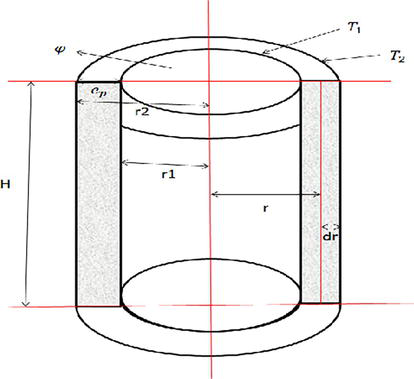
In this study, the aim is to determine the heat flux (W) that passes through a considered cylindrical digester made up of a monolayer wall, a side surface, a wall thickness, and a thermal conductivity of the materials. Here, the digester is concrete, the thermal conductivity is 0.8, and the wall thickness is 15 cm [9].
The thermal flux density crossing this hollow cylinder is given by Fourier’s law presented in Eq. (2) [10]:
φ=2π×k×Hlnr2r1T2−T1E2
This becomes:
φ=π×k×H×DdigepT2−T1E3
where
φ is the thermal flux density in watt (W),
ep is the wall thickness in meter (m),
r1, r2 are the internal and external radii of the cylinder, respectively,
T1 and T2, the temperatures at the interfaces of the walls as shown in Figure 2,
Figure 2.
Cylindrical digester.
H corresponds to the height of the cylinder.
2.1.1.2 Conductive thermal resistance of cylindrical digester
Per definition, the thermal resistance is the inverse of the thermal flux [10]. From the Eq. (2), we deduce the expression of the thermal resistance of a digester.
RTh=lnr2r12π×k×HE4
2.1.2 The bell gasometer
The gasometric bell can be manufactured from steel sheets having a thickness of 15/10th of mm and dimension of 2 m in length by 1 m in width. The welding will be done by a mechanical welding workshop. To fight against corrosion, we will cover the inside of the bell with liquid rubber (Flint-Kote), and its exterior will be covered with black paint preferably to fight against rust. In addition, the black color participates in the absorption of solar energy to heat the walls of the digester [6]. The gas outlet pipe having a diameter of approximately 10 mm is positioned on a minimum slope of 1% from plastic pipes and galvanized or copper metal pipes compatible with other equipment such as valves, taps, etc.
2.1.2.1 Sizing of a gasometer
A gasometer is a storage tank for biogas obtained from organic waste. Its volume can be calculated according to the average hourly quantity of biogas supplied and the average hourly quantity consumed, which depend on the consumption period daily and their duration [11].
Vstok=Qpmh−Qcmh×ti×25%E5
with ti is the longest duration of use of the tank (in hours), which is represented in Figure 3.
Figure 3.
Timeline of biogas use.
Qpmh=Vbio24E6
Qcmh=Vbio∑tiE7
Qpmh=6.824/24=0.284375m3/h
Qcmh=0.284/8=0.03554688m3/h
Vstok=0.284–0.035∗80.25
2.1.2.2 Diameter and length of gas pipe
This research is important to test the diameters suitable for our installation compared to those available on the market. The dimensioning of the diameters is very important for the safety of biogas appliances. It is obtained using the pressure drop equation (depending on the variables shown in the table below used in fluid mechanics [12].
J=∆H=λ×Lc×Ve2Dcg×2gE8
≥Dcg=λ×Lc×Veg2J×2gE9
≥Lc=Dcg×J×2gλ×Veg2E10
It is important to note that the pressure loss coefficient (λ) is a function of the Reynolds number, which depends on the dynamic viscosity (μ) of the fluid, its density, the diameter of the pipe, and the flow velocity [4].
NB: In cylindrical-shaped reactors, the acceptable pressure drop is small and is estimated at 10 mm water column.
Re=ρ×Veg×DcgμE11
Veg=4×qmgc3.14×Dcg2E12
qmgc=qbr+qlE13
We are going to use two maximum flow rate burners (qbr) of 0.9 m3/h each and eight flow lamps (ql) 0.14m3/h each.
qmgc=2×qbr+8×qlE14
AN:qbrm=0.9×2=1.8m3/h
qlm=0.14×8=1.12m3/h
qlm is the maximum electrical flow
qbrm means the maximum kitchen flow
qmgc=1.8m3/h+1.12m3/h
qmgc=2.92m3/h
Indeed, the coefficient of friction is determined according to the flow regime of the fluid inside the pipe [4].
If Re < 2400 then one is in laminar mode corresponding to the line of Poiseuille:
λ=64ReE15
If 2000 < Re < 3000, we have a transition flow.
If 4000 < Re < 105 then the regime is turbulent:
λ=0.316/Re1/4E16
2.2 Anaerobic digestion stage
Anaerobic digestion can be defined as the natural transformation of organic waste in the absence of air by anaerobic bacteria to produce the biogas, the carbon dioxide, and the digestate.
In this study, we simplified the anaerobic digestion steps in two and which are namely the acid fermentation (from hydrogenated to acetate) and the methane fermentation (methanogenated phase) to facilitate the digestion by quantifying only the volatile fatty acids and the biogas.
2.3 Modeling of cell growth
In anaerobic digestion, the growth rate of microorganisms can be evaluated by several models, the most used of the Monod model created in [11] and combines the net (specific) growth rate and the substrate concentration (Cs) by considering only two bacterial populations namely acidogenesis and methanogens. It represents the reaction rate of anaerobic bacteria for cell growth that depends on the concentration and is written as:
μs=μcmax×CsKds+CsE17
with
μs means the growth rate
Kdsis the half-saturation constant (in gram per liter (g/l)). It is the concentration where μs = μcmax/2.
μcmax(d−1) corresponds to maximum growth rate.
Therefore, thanks to a model that can generalize the relationship between the growth of bacteria and their concentration, and the modeling will be carried out according to the type of bacteria using the kinetic properties developed by Amoco [2].
To better facilitate the separate modeling of the growth of microorganisms, Amoco model [2], in which two reactions based on acidogenesis reaction and methanogenesis reaction are considered, is used.
2.3.1 Change in acidogenic biomass
The degradation of the acetogenic biomass leads to the production of volatile fatty acids, which become the substrate of concentration (acetate (Cs2)) and new biomass cells for a pH of 6 [2, 6, 13]. It is calculated using the Monod equation expressed below:
μs1=μcmax1×Cs1Kds1+Cs1E18
At the start of the experiment, the acidogenic biomass is:
Cs1=QrgVulE19
This equation is used to model the growth of a population of bacteria that feed on a substrate and whose maximum growth is limited.
2.3.2 Growth of methanogenic bacteria
To obtain the variation of the methanogenic biomass, it is assumed that the reactor operates at constant temperature and pH (anaerobic conditions). For the methanogenic simulation is shown by Gaston Nsavyimana [6] that the digester will be fed at the flow time of the experiment with varying amounts of acetate. Here, we will work with a half-reaction constant [2] where the concentration of volatile fatty acid (acetate) corresponds to 50% of the concentration of the initial substrate [13].
μs2=μcmax2×Cs2Kds2+Cs2E20
2.3.3 Effect of organic acid inhibitor
Several models have been developed to study the effect of the inhibitor on anaerobic digestion. The first of them is mainly interested in methanogenesis under the hypothesis that it would be the limiting step in the overall anaerobic digestion process [14].
2.3.3.1 Effect of organic acid inhibitor on the performance of the acidogenesis biomass
This effect is modeled as a function of the acetic acid inhibition constant. The reaction rate is given by the following more synthetic model, called AM2.
μs1′=μcmax1×Cs1Kds1+Cs11−K1ac×Cs1E21
with:
μs1′ is the reaction rate of the acidogenesis biomass.
2.3.3.2 Effect of organic acid inhibitor on the performance of methanogenic bacteria
The inhibitory effect of organic acids on methane bacteria is modeled by including an inhibition term. It is in this sense that Haldane [13] proposed an equation called the Haldane equation to represent the inhibition of the growth of methanogens at high substrate concentrations.
The Haldane equation below is used to model the growth of bacteria [1, 13].
μ′s2=μcmax2×Cs2Kds2+Cs2+Cs2Ki−22E22
with
Cs2=Cs1100×50E23
The specific growth rate of methanogenic bacteria is chosen according to the temperature. Here, we have taken this value because the internal temperature of the pits is between 20°C and 35°C.
2.4 PH modeling
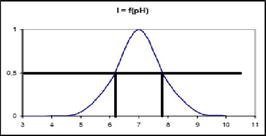
PH is a parameter that can have a negative impact on anaerobic digestion. It is regulated by volatile fatty acids (VFAs), the bicarbonates, and the ammonia. The inhibition caused by pH is modeled by the AMD1 model and expressed as [15].
Inib=1+2×100,5pH+−pH−(1+10pH+−pH−+10pH−−pH+)E24
Where pH+ and pH− are obtained graphically by the Figure 2 for an inhibition coefficient of 0.5. More, the values of pH+ and pH− are according to the values measured in the center of Ngoundiane represented in the Table 2.
S.T
Infir
P.A
P.B
B.S.P
Tower
Resto
L.R
pHav
7.30
7.01
7.02
7.40
7.42
6.64
7.45
Table 2.
PH measured in the center of Ngoundiane.
So, we have pH− = 6.2 and pH+ = 7.8
And Inib is the inhibition,
Infir is the infirmary,
P.A is the Pavillon A,
P.B means the Pavillon B,
B.S.P is the pedagogic service block,
L.R corresponds to the lecture room.
The graphic where the inhibition coefficient is the follower.
2.5 Influence of the temperature
The temperatures have an important place in the methanization. Here, we work in mesophyll with the temperature measured in the center of Ngoundiane. These temperatures are represented in the Table 3.
Hours (h)
8 h
10 h
12 h
14 h
16 h
18 h
T (°C)
29.5
28.2
28
27.5
30
34.5
Table 3.
Temperature of the septic tank.
2.5.1 Nitrification rate
The performance of a nitrification or denitrification reactor is due to the nitrate formation and nitration rates given, respectively by the following formulas [14].
VNtiT=VNti20°C×1.07T−20E25
and
VNtaT=VNta20°C×1.04T−20)E26
Where the nitrification and nitration formation rates are depended of the temperature and shown in the Table 4.
Phases
Acetogenesis
Methanogenesis
VNti(mgN/l/h) 20°C et pH = 7.2
22.2±5.1
10.9±1.2
VNta(mgN/l/h) 20°C et pH = 7.2
8.9±1.9
0
Table 4.
Nitrification rate in 20°C and pH =7.2.
The rate of nitrification is between 7.5 mgN/l/h and 17.6mgN/l/h for temperatures ranging from 25°C to 29°C and for a pH that varies from 8.5 to 8.7 [16].
The kinetics of nitrification can explain an interruption (shunt) of nitrate in the reactor. It also provides an idea of their biodegradability because a decrease in this rate causes a variation in the nitrogen load at the inlet and incomplete nitrification. If we observe an equality of the speeds at the inlet and outlet, we can say that there is no degradation of nitrogen [16].
2.5.2 Kinetic coefficient of growth of bacteria by day
Temperature plays a primary role in anaerobic digestion. It promotes the activity and growth of bacteria. The kinetic coefficient of growth of microorganisms is modeled by the following relation [13]:
Ccinet=0.013×T–0.129E27
2.6 Modeling of actual biogas production
The methanization is not only the conversion of acetate in the presence of water but also the reduction of CO2 by hydrogen into methane (CH4) thanks to hydraulic bacteria (hemicellulolytic, anylolytic, and proteolytic bacteria).
CH3COOH+H2O→CH4+H2CO370%CH4
CO2+4H2→CH4+2H2O30%CH4
This biogas production can be modeled by the time-independent “steady-state” methods based on the mass of biodegradable organic matter and the potential for biogas production.
2.6.1 Volume of produced methane
The volume production (Pv) also called technological yield is linked to the daily production of biogas (Vbio) and to the useful volume of the digester (Vu) by the following equation:
Pv=VbioVu=Nmg3/md3E28
2.6.2 Evaluating the produced methane
The methane flow is modeled by the following equation [3].
QCH4=VReac×μs2×K2×Cs2E29
The characteristics of the digester, such as temperature and organic load, accompany the operation in biogas production. It is in this sense that we made our studies with human wastes and at mesophilic temperatures (T).
2.7 Viscosity
Viscosity (Visc) plays an important role in anaerobic digestion because it allows us to have an idea about the resistance to the movement of the fluid in its reactors.
According to Heléne Caillet, viscosity increases with increases with solid and volatile solid concentration but decreases with increased temperature due to enhanced mobility of polymer chains. Indeed, the viscosity can also be predicted from the pH by applying the equation, which is presented as follows [17]:
ViscPa.s=−0.0135pH2+0.1965pH–0.667E30
2.8 Investment cost of the digester
The investment cost of the methanizer is the sum between the acquisition and installation costs of the digester.
First, the construction cost is defined as the costs for labor written as [3].
Ccost=CVFm3×VuE31
Vu is the capacity of the reactor.
Secondly, the acquisition costs of the digester (Cac) represents the expenses related to the construction materials of the digester [6].
Cac=3.14×Daq×ρgaz×Hdig×Cc/KgE32
and
Daq=Ddig×2.5×Ddig+1.2E33
where
Daq is the acquired diameter,
Hdig corresponds to digester height.
After, we make a research on the digester excavation cost (Cexa) in FCFA. The digester cost of digging the pit, Cexa, is the expressed as:
Cexa=π4×Ddigest+0.33×Ddigest2×Hdigest×CVFm3E34
Also, the coating cost represents the product of the necessary volume of reinforced concrete times its volume cost [4].
The volume of the reactor is sufficient to fight against any overflow of organic matter. The capacity of the gasometer is
Vstok=0.5m3/h=12m3/d.
The values for gas pipe diameter and length can be found in Table 5 for clarity.
For Dcg = 12.5 mm
For Dcg = 16 mm
Veg (m/s)
5.97868577
Veg(m/s)
3.649150743
Re
5813.972142
Re
4542.165736
Re˃2400; turbulent regime
Re˃2400; turbulent flow
λ
0.036188355
λ
0.038492076
Lc(m)
1.895905487
Lc(m)
6.124406929
Interpretation
Lc = 1.89 m is very small; 12.5 mm diameter is excluded
Lc = 6.12 m is sufficient; We take Dcg = 16 mm
Table 5.
Determination of the diameter of gas pipes and their length.
Concerning the value of the resistance found in our study, it is more important than those found by Aline Lebranchu [18]. We will increase the thickness of the digester by applying coating to it in order to adjust its resistance. The resistance is expressed in kelvin per watt (K/W).
The variations in acetogenesis and methanogenesis biomasses in the anaerobic digestion of septic tank are represented in the Table 6.
average
Cs1 (g/l)
3
6
9
12
15
18
10.5
Cs2 (g/l)
1.5
3
4.5
6
7.5
9
5.25
μs1 (d−1)
0.356
0.55
0.671
0.754
0.814
0.860
0.668
μs2 (d−1)
0.541
0.625
0.659
0.678
0.689
0.697
0.67
μ′s2 (d−1)
0.253
0.172
0.127
0.101
0.83
0.071
0.134
μ′s1 (d−1)
0.148
0.114
0.093
0.078
0.068
0.06
0.094
Table 6.
Variation in acetogenesis and methanogenesis biomasses in the anaerobic digestion of septic tank residues at the Ngoundiane site.
This table is obtained using Excel. It helped us to better see the evolution of microorganisms within methanization represented in the Figures 4 and 5 (obtained by the software: origin-pro).
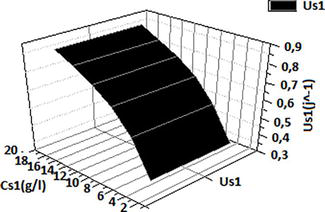
Figure 4.
The growth function of acidogenesis bacteria as a function of substrate concentration.
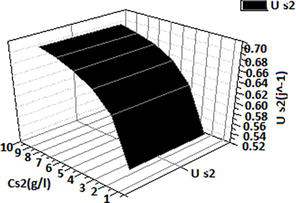
Figure 5.
The growth function of methanogenesis biomass as a function of substrate concentration.
Therefore, the results obtained on the modeling of methanogenic biomass are shown in the Figure 6.
Figure 6.
Values of the inhibition coefficient of methanogenic bacteria as a function of Ph.
In the absence of factors inhibiting the microbial mortality, the microbial growth rate μs(d−1) increases at the proliferation profile of the concentration of the substrate introduced into the anaerobic reactor in mesophyll, as shown in the Figures 4 and 5. The maintenance of the growth of microorganisms can be ensured by the addition of additives, such as substrates rich in sugar (carrots) and cooked foods rich in starch (rice) [19], the solution of sodium hydroxide (NaOH) with a concentration of 0.5 mol/L, the sodium carbonate (Na2CO3) towards neutrality (pH = 7). These parameters increase the C/N ratio and stabilize the pH for the good progress of anaerobic fermentation [19, 20]. Our values are identical to those calculated by Laurent Lardon [2] which are between 0.2 d−1 and 0.8d−1.
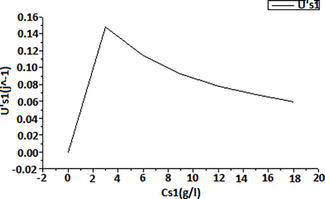
About the function of acidogenesis and methanogen biomass taking into account inhibition, the Figures 7 and 8 show the operating diagrams of the system with inhibition for increasing values of organic matter entering the device.
Figure 7.
The growth function of acidogenic microorganisms with inhibition.
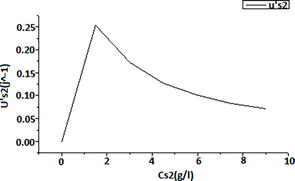
Figure 8.
The growth function of methanogenesis bacteria with inhibition.
Here, we find that the growth of microorganisms (μs) is a function of substrate. It increases to a certain concentration (3 g/liter for the substrate or organic matter, 2 g/liter for acetate) and then decreases. This decrease in the level of microbial biomass μs′d−1 becomes more important by increasing the value of the concentration of the substrate (acetate). A high concentration of hydrogen can also inhibit the growth of acetogenic bacteria. This hydrogen comes from volatile fatty acids (VFAs) and from the simple substrate (Cs). Indeed, the removal of bacteria can be explained by the acceleration of their rate of division. On the other hand, a high concentration of acetate can inhibit the growth of hydrogenotrophic methanogenic bacteria. In fact, anaerobic digestion (anaerobic degradation) is accompanied by the production of intermediate substrates called volatile fatty acids. However, in the literature, a quantity of volatile fatty acids (VFAs) greater than 3000 mg/l leads to an inhibition of the methanization process of this substrate in accordance to our study as it is seen Figure 7. Our values are identical to those calculated by Laurent Lardon and Jonathan Hess [2, 14] which are between 0.05 d−1 and 0.35d−1.
Moreover, the inhibition linked to pH obtained on the calculation of this inhibition is10−7. It is very small and cannot affect the growth of anaerobic microorganisms.
Microorganisms need nitrogen for their cell structure.
In a nutshell, the nitrification rate obtained in our study is represented in the Table 7.
VNti(T) acid
37
38
39
42
44
49
43
VNti(T) met
18
19
19
21
21
29
21
Table 7.
Variation of the nitrification rate.
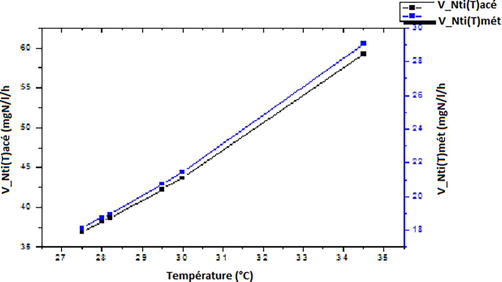
These resultants allow to plot the Figure 9 represented the evolution of the nitrification rate compared to the temperature.
Figure 9.
Nitrification rate.
In Figure 9, we have shown the effect of temperature on the rate of nitrate formation, which becomes the substrate for methanogenic bacteria, allowing the production of biogas.
It shows that the rate of nitrification increases with temperature in mesophyll. According to the results obtained, the values found are higher than those calculated by Bourser. The range of 7.5 to 17.6 mgN/l/h for a temperature that varies between 25°C and 29°C. These values differ from the findings of Yenigün and Demirel’s work [21]. Their work shows that the same anaerobic digestion carried out in mesophyll and thermo-phile does not result in the same amount of ammonia in the medium. Specifically, it resulted in 30-mg/liter and 200-20 mg/liter, respectively [21]. Rousseau et al. [22] state that nitrite and nitrate ions cause the pH to change and cause charge balances. Indeed, denitrification allows the production of CO2 and N2, which influences the quality of the biogas. At low concentrations, ammoniacal nitrogen in the free, non-ionized NH3 or ionized NH4+ form [23] can neutralize VFAs, which helps maintain a neutral pH. It is generally accepted that a concentration between 50 and 200 mg/l stimulates anaerobic digestion [23]. In this case, the results obtained in our research favor the methanization of sludge. However, ammoniacal nitrogen can be toxic when the concentrations vary between 2 and 3 g/l for the bacterial population [17].
As for the volume production of biogas, the volume production Pv is 0.2 m3biogaz/m3 digester.
This result is identical to that found by Markowski et al, which is 0.17 m3biogaz/m3 digester [24].
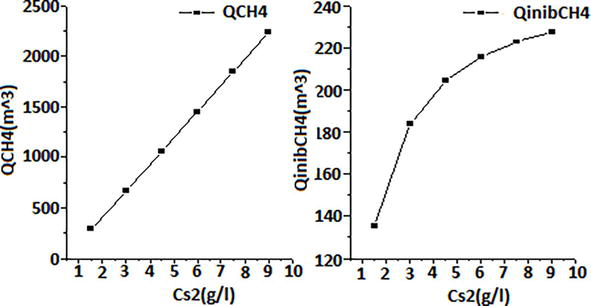
In the Figure 8 is shown the evolution of the flow of biogas produced as a function of the acetate respectively without and with inhibition (Figure 10).
Figure 10.
Evolution of the flow of biogas produced as a function of the acetate, respectively without and with inhibition.
It is clearly noted that the production of biogas increases with the growth of acetate under normal conditions but decreases with the presence of inhibitor. To confirm these conclusions, we compare the evolution of VFAs and methane flow for these two curves. We noticed an evolution of VFAs which grow up to a certain concentration (3 g/l) and decrease causing a decrease in the flow of biogas thanks to the inhibition of methanogenic bacteria by these VFAs. In addition, the production of methane depends on the growth rate of bacteria.
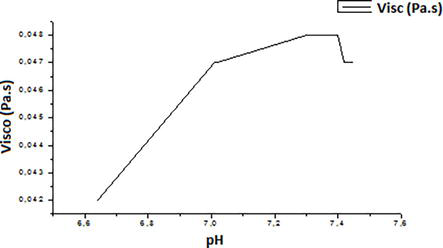
As part of the viscosity, the Figure 11 represents the viscosity as a function of pH.
Figure 11.
Representation of viscosity as a function of pH.
The analysis of the curve allows us to see the change in viscosity as a function of the pH. It is noted that the viscosity increases rapidly with the acidic pH (6) and becomes stable for the pH, which are around neutrality (pH = 7) in accordance with the results found by Culioli et al. [25]. The behavior of effluents within reactors can depend on the solid concentration, the age of the sludge, its type, and the temperature which characterize the pH as it can see in the work done by P. Rousseau et al., [22].
The average value found in our study for viscosity is evaluated at 0.046 Pa.s.. We saw that our result is in the range of those found by those of Laporte [26], Koblan Wilfried et al. [27], and Heléne Caillet [17], which range from 0.0010 Pa.s to 1.29 Pa.s, from 0.018 to 1.3 Pa.s, and from 0.018 Pa.s to 0.445 Pa.s, respectively.
About the construction cost of our digester, the total investment cost comes to 1156860FCFA.
Throughout this study, we tried to develop the solutions related to the recovery of residues from septic tanks. We also investigated the links between feed, the bacterial activity, and the biogas production using two-step mathematical modeling with and without inhibition to ensure the process stability and regulate the quality of the biogas produced for recovery. Indeed, it has been shown that the value of the parameters influences the rate of biogas produced. Likewise, the increase of the concentrations of the substrates at the inlet of the reactor for a model without biomass mortality (without inhibition) favors the increase of the biogas produced. The study showed that the model without inhibition produces more biogas than the model with inhibition.
The obtained results in our research show clearly that for fixed entry concentrations, there is a maximum level of methane obtained with the weakening of the inhibition of hydrogenotrophic methanogenic bacteria marked by an increase in the concentration of acetoclastic methanogenic bacteria and that of acetate that is quite low.
Upon validation, our models identified a link between feed, digester allkalinity, and biogas quality. In addition, they make it possible to detect inhibition regimes marked by a decrease in the quantities studied.
References
1.Kokoh E. Anaerobic lagooning: modeling combining primary reduction and anaerobic degradation [doctoral thesis]. 2009. p. 128
2.Lardon L. Modeling of Biofilms of Anaerobic Digestion by Multi-Agent System, Statement of DAA, Agro TIC2001. p. 79
3.Abunde Neba F, Asiedu NY, Addo A, Morken J, Osterhus SW, Seidu R. A coupled modeling design and investment parameters for optimal operation of methane bioreactors: Attainable region concept approach. Article de revue. Renewable Energy, ISSN: 09601481. 2020;148:1054-1064
4.Amededjihunde Hypolite Hounnou, Chamagne Didier Fréderic Dubas, Antoine Cokou Vianou. Technical-economic dimensioning of penstocks for micro-hydroelectric power stations using generic algorithms. Journal de la Recherche Scientifique de l'Université de Lomé (Togo). 2019;21(1):113-122
5.Lansing S, Botero RB, Martin JF. Waste treatment and biogas quality in small scale agricultural digestors. Bioresource Technology. 2008;99:5881-5890
6.Nsavyimana G. Modeling of physical and biological processes in septic tanks and routes for recovering sludge drain: Application A Bujumbura-Burundi [thesis]. University of Liège and Faculty of Sciences: "Sanitation and Environment" Unit, 2014-2015
7.Coulibaly L, Jen-Marie, Oattara P, Tiho S. Potential in agopastoral biogas and human excreta from the watershed of the Sassandra River (Cote d’Ivoire). Journal of Sustanaible development in Africa. 2012;14(4)
8.Kouawa T. Treatment of Faecal Sludge by Drying Beds in a Sudano-Sahelian Climate Other [thesis]. University of Strasbourg; 2016. French. NNT: 2016STRAD018. p.20
9.Tedjani S, Nouri S. Analytical study and numerical simulation of one-dimensional heat diffusion [thesis for master]. University of Science and Technology Houari Boumediene; 2020. pp. 6-14
10.Mactar F. Problem of Conduction in Permanent Regime. Thermal Transfer Course. Alioune DIOP University of Bambey UFR Satic. Department of Physics; 2015
11.Aboubakar, Boli Z, Mbofung CMF. Study of the biogas potential of animal waste: Cattle dung and poultry droppings from a zootechnical center in Maroua - Cameroon. Revue des Energies Renouvelables. 2016;19(3):449-450-452-453-454
12.Tedjani S, Nouri S. Analytical study and numerical simulation of one-dimensional heat diffusion [thesis for master]. University of Science and Technology Houari Boumediene, Faculty of Physics; 2020. pp. 6, 7, 14. Available from: https://www.researchgate.net/publication/341940123
13.Eynard J. Modeling, dynamic optimization and control of a methanizer by anaerobic digestion [thesis]. 2007. p. 81
14.Hess J. Modeling the Quality of Biogas Produced by a Methanogen Fermenter and Regulation Strategy in View of its Valuation. University of Nice – Sophia Antipolis – UFR Sciences Doctoral School Information and Communication Sciences and Technologies. pp. 69-123
15.Rouez M. Anaerobic Degradation of Solid Waste: characterization, Influencing Factors and Models [thesis order number 2008SAL0061]. National Institute of Applied Sciences of LYON, Doctoral School of Chemistry; 2008. pp. 76-79 95–99
16.Rousseau P. Study, modeling and optimization of a process for treating pig slurry by coupling anaerobic digestion and biological nitrogen treatment. Environmental Engineering. Doctorate in Chemistry, Rennus University. 2009:3870
17.Caillet H. Optimization of the Anaerobic Digestion of Sugar Cane Vinaisse: Modeling and Experimentation at the Laboratory Scale. [doctoral thesis]. University of Reunion, N 542; 2019. p. 243. Available from: https://tel.archives-ouvertes.fr/tel-02894979
18.Lebranchu A. Study of the Methanation Process in an Anaerobic Digester on a Pilot Scale: Impact Mixing and Gas-Liquid Transfer on the Performance of Biogas Production. Genius of Processes. University of Lorraine; 2017 French. NNT: 2017LORR0336. Tel-01916424
19.Djaafri M, Kaloum S, Khelafi M, Tahri A, Salem F, Kaidi K, et al. Methanization of organic waste from university residence of the African university of the city of Adrar southwest of Algeria, ISSN: 2028-2508. Journal of Materials and Environmental Science. 2014:2484-2488
20.Ahmed T, Mohammed D, Mostefa K, Kamel K, Slimane K, Zohra B. Production of biogas from potato waste. In: Conference Paper. 2016
21.Laura A. Study of scientific and technological obstacles for the understanding and optimization of the discontinuous dry methanization process of by-products of agricultural origin [PhD thesis]. University of Technology of Compiegne Specialty Process Engineering; 2016. pp. 37-38
22.Rousseau P, Steyer P, Volokey EIP, Bernet N, Béline F. Combined anaerobic digestion and biological nitrogen removal for piggery wastewater treatment: A modelling approach. Water Sciences, Techno. 2008;5(2):21-28
23.Liu T, Sung S. Ammonia inhibition on thermophilic Aceticlastic Methanogenesis. Journal Water Sciences and Technology. 2002;45(10):113-120
24.Markowski M, Treneusz A, Krzemieniewski B. Optimizing low-temperature biogas production from biomass by anaerobic digestion. Renewable Energy. 2014;69:219
25.Culioli J, Bon JP, Maubois JL. Study of the Viscosity of Retentates and Pre-Cheeses Obtained after Treatment of Milk by Ultrafiltration on a Membrane. Vol. 538. Rennes: Laboratory of Dairy Research and Technology, INRA; January 1974. pp. 11-12
26.M. Laporte. Study of two-phase flow at the millimeter and micrometric scale: applications to foams [doctoral thesis]. 2014
27.Koblan Wilfried E, Benchabane A, Bekkour karim. Comparative study of the rheological properties of polyethylene oxide (PEO) bentonite mixture of different molecular masses. In: 18th French Congress of Mechanics, Grenoble, 27–31 août 2007, ffhal-03361696. pp. 1-6
Written By
Ibrahima Niane, Amadou Diao, Fakoro Souleymane Dia and Senghane Mbodji
Submitted: 03 December 2023Reviewed: 15 January 2024Published: 05 March 2024