Open Access is an initiative that aims to make scientific research freely available to all. To date our community has made over 100 million downloads. It’s based on principles of collaboration, unobstructed discovery, and, most importantly, scientific progression. As PhD students, we found it difficult to access the research we needed, so we decided to create a new Open Access publisher that levels the playing field for scientists across the world. How? By making research easy to access, and puts the academic needs of the researchers before the business interests of publishers.
We are a community of more than 103,000 authors and editors from 3,291 institutions spanning 160 countries, including Nobel Prize winners and some of the world’s most-cited researchers. Publishing on IntechOpen allows authors to earn citations and find new collaborators, meaning more people see your work not only from your own field of study, but from other related fields too.
Habitat fragmentation is a big threat to biodiversity because habitat fragmentation reduces the total patch area, isolates the patches, and increases the edge of patches. The objectives of this study were to investigate how protected area (PA) size affects habitat fragmentation and what caused habitat fragmentation in the PAs. The study focused on 180 PAs in Thailand, including 58 wildlife sanctuaries and 122 national parks. The land use/land cover data of Thailand were acquired from the Department of Land Development of Thailand and used to quantify forest habitat fragmentation in terms of the number of patches, patch density, proportion of forest, and clumpiness index. There were significant linear relationships between the total area and number of patches and between total area and patch density. Large PAs, with a total area larger than 1, 600 km2, had significantly lower patch density than medium and small PAs. However, 128 of the 180 PAs in Thailand were small-sized with high patch density due to agricultural expansion making up approximately 10% of the protected areas. Large PAs with a size of 1600 km2 or larger are preferable over small PAs in order to reduce habitat fragmentation and contribute to biodiversity conservation.
Center of Excellence for Ecoinformatics, School of Science, Walailak University, Thailand
Mullica Jaroensutasinee*
Center of Excellence for Ecoinformatics, School of Science, Walailak University, Thailand
Orranan Chuachart
Center of Excellence for Ecoinformatics, School of Science, Walailak University, Thailand
Elena Sparrow
International Arctic Research Center, Department of Natural Resources and Environment, University of Alaska Fairbanks, AK, USA
*Address all correspondence to: mullica.jn@gmail.com
1. Introduction
Habitat fragmentation leads to biodiversity loss and extinction risk resulting from a single large landscape broken apart into many isolated smaller patches [1, 2]. Habitat fragmentation drives habitats to shrink, ultimately resulting in habitat loss. This fragmentation limits the number of individuals in an area and affects species richness and abundance [3]. Habitat fragmentation increases the proportion of edge to the total area, causing the edge effect. This edge effect enables the stress of microenvironment variation to some species [4]. Fragmented habitats have a smaller total area, while some species need large home ranges to survive, for example, hornbill and jaguar [5, 6]. Although the landscape can become fragmented by nature (e.g., water bodies), human activities (e.g., urban and crop expansion) accelerate habitat fragmentation [7]. Protected areas (PAs), as defined by the International Union for Conservation of Nature (IUCN), are clearly defined landscapes managed to conserve nature by legal or other effective means [8]. Within PAs, policies are established to avoid disturbance, such as limiting human visitations and activities and deforestation. PAs are practical tools to prevent fragmentation by maintaining the continuity of habitats [9]. Thus, it is necessary to study factors that would maximize the effectiveness of PAs.
Thailand’s lush rainforests are home to a vibrant array of biodiversity and provide crucial ecosystem services. Still, they face a growing threat: forest fragmentation and significant landscape changes in the last half-century [10]. Between 1945 and 2020, Thailand’s forest cover substantially declined from 61 to 31.64% [11]. Breaking up extensive, continuous forests into smaller, isolated patches significantly impacts the country’s sustainability. The significant causes of forest fragmentation in Thailand are agriculture intensification, infrastructure development and urban expansion, and resource extraction [12, 13]. Thailand’s booming agricultural sector, particularly for agrarian commodities such as rubber, rice, oil palm, tea, sugar cane, corn, and cassava, has driven extensive deforestation, increased soil erosion in watershed areas, and desertification, fragmenting once-contiguous forests [14, 15]. Infrastructure development and urban expansion reinforce economic growth and captivate foreign investors for sustainable production and productivity. The Thai government invests in infrastructure supplemented by external financing, such as hydroelectric dams, roads, mining, telecommunications, airports, and oil and gas pipelines [12]. In the past, illegal logging and mining have been the primary drivers of Thailand’s forest fragmentation.
Forest fragmentation directly affects environmental sustainability, resulting in biodiversity loss, disrupted water cycle, carbon stock reduction, and ecosystem service loss [16, 17, 18, 19]. Thai forest area and fragmentations negatively correlated with three environmental parameters: temperature, rainfall, and relative humidity [20]. Forest fragmentation gives rise to higher temperatures for three main reasons. First, deforestation releases carbon into the atmosphere, increasing greenhouse gases and global temperature [21]. Second, highly fragmented forests generate a lower rate of evaporation and photosynthesis in the forest, increasing the temperature in the atmosphere [22]. Third, forest fragmentation alters cloud-formed condensation, wind, and water flow, causing higher temperatures and drier areas [22]. In addition, forest fragmentation also leads to reduced rainfall and relative humidity [23]. An intact forest landscape produces high rainfall and relative humidity from plant photosynthesis and transpiration processes [24].
Forests are an important ecosystem and key economic sector in Thailand, bringing 3.9 billion USD in exports in 2020 [13]. The Thai government aims to raise the national forest cover to 40% by 2036 by protecting intact forest landscapes, preventing forest fragmentation, and promoting sustainable practices [25]. This study investigated (1) how PA size influences habitat fragmentation within their boundaries and what size of PA is enough to slow down habitat fragmentation and (2) which human activities expand into and disturb PAs by studying the land use/land cover (LULC) in PAs. This study helps us better understand the effectiveness of PA size to support making effective administrative policies, PA plans, and PA design.
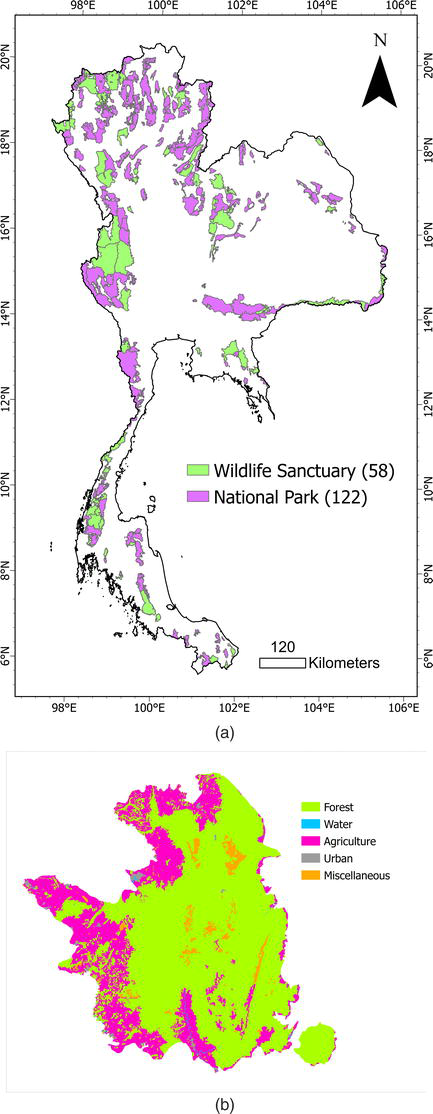
This study included all 180 PAs in Thailand, composed of 58 wildlife sanctuaries and 122 national parks. Spatial data of the PAs were downloaded from the World Database on Protected Areas (WDPA) [8] in shapefiles. According to the IUCN, PAs were classified into six management categories of I–VI (with Ia and Ib as subdivisions). Still, Thailand had only five categories of PAs (Ia, II, III, IV, and VI). In this study, we focused on two of the most strict PAs: Ia PAs were “wildlife sanctuary” and II PAs were “national park” (Figure 1a).
Figure 1.
Thailand map and protected areas: (a) 180 protected areas in Thailand (green = 58 wildlife sanctuaries and purple = 122 national parks) and (b) LULC types in an example for Phu Luang wildlife sanctuary with 5 LULC types (green = forest land, blue = water body, pink = agricultural land, gray = urban and built-up land, and orange = miscellaneous land).
National parks differed from wildlife sanctuaries because they were less protected and allowed human visitation and recreation [26]. We divided the 180 PAs into three categories: small, medium, and large PAs using the Natural Break (Jenks) method [27]. The Natural Break (Jenks) method allowed us to categorize the PAs by minimizing class variance. With this method, the 180 PAs were divided into 123 small (24.372–618.974 km2), 49 medium (618.975–1677.277 km2), and eight large (1677.278-3730.748 km2) PAs with a standard deviation of 14.4, 38.5, and 226 km2, respectively. To further quantify habitat fragmentation, the land use/land cover (LULC) data of Thailand in shapefiles were acquired from the Department of Land Development of Thailand. The LULC data were analyzed from THEOS, Landsat 8OLI, Sentinel-2 satellites, and ground observation from 2019 to 2022. The LULC was classified into five types: forest land, water bodies, agricultural land, urban and built-up land, and miscellaneous land (Figure 1b).
2.2 Habitat fragmentation estimation
FRAGSTATS version 4.2 [28] was used to quantify habitat fragmentation in the PAs. To prepare files before analysis, the LULC shapefiles were rasterized into 30 × 30 m2 cells by maximum combined areas cell assignment type. Habitats were defined as forest habitats, so LULC types other than forest land were selected as the background to create the binary forest and non-forest maps. The habitat fragmentation metrics were then calculated based on the eight-neighbor rule. Four class-level metrics were chosen: (1) the proportion of forest defined as the percentage of forest habitat in the total area of a given PA, (2) the number of patches defined as the number of isolated mosaics of forest land cells, (3) the patch density defined as the number of patches divided by the total area in km2, and (4) the clumpiness index defined as the proportional deviation of the proportion of like adjacencies of the forest land from that expected if the patches were randomly distributed. The clumpiness index was 0 when patches were randomly distributed, 1 when patches aggregated, and − 1 when patches disaggregated [6, 29].
2.3 Data analysis
Simple linear regression was used to examine the relationship between the total area of the PAs and the four habitat fragmentation metrics (proportion of forest, number of patches, patch density, and clumpiness index). The Kruskal-Wallis test and Dunn’s multiple comparison tests were used to examine the differences in habitat fragmentation among the three sizes of protected areas.
2.4 Protected area size comparisons
The PAs in Thailand have an average total area, number of patches, patch density, proportion of forest, and clumpiness index equal to 583.45 km2, 70 patches, 0.144 patches/km2, 87.35%, and 0.83, respectively. They have a wide range of total area, with the largest at 3730.75 km2 and the smallest at 24.37 km2. The lowest proportion of forest habitat in a protected area was half (50.91%) of the total area. The number of patches in a protected area was as high as 432. The patch density ranged from 0.002 to 1.123 patches/km2. There was a protected area with clustered patches (clumpiness index = 0.98) and one with dispersed patches (clumpiness index = −1.00) (Table 1).
Mean
Median
Maximum
Minimum
S.D.
Total area (km2)
583.45
425.33
3730.75
24.37
565.37
Number of patches
70
41
432
1
84
Patch density (patches/km2)
0.144
0.119
1.123
0.002
0.135
Proportion of forest (%)
87.35
89.88
99.98
50.91
10.23
Clumpiness index
0.83
0.88
0.98
−1.00
0.21
Table 1.
Habitat fragmentation metrics of the protected areas (n = 180) in Thailand.
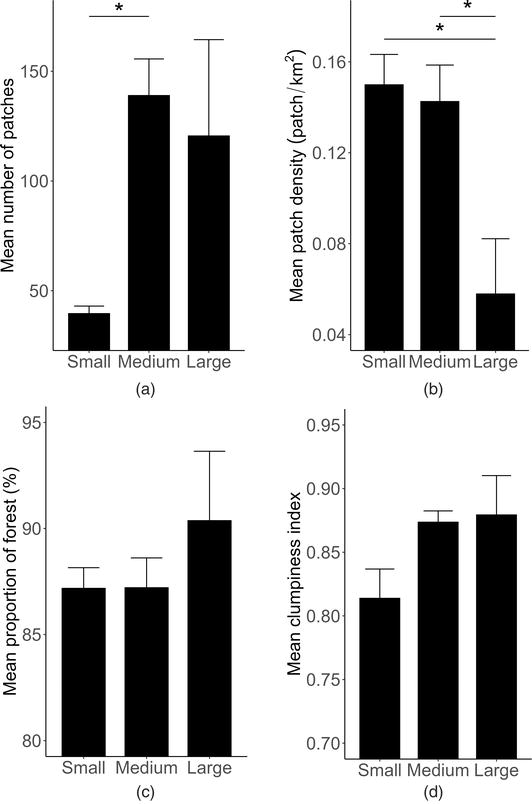
Comparing the three PA sizes, the medium PAs had a higher number of patches than the small PAs, but there were no differences in others (Kruskal-Wallis test: H2 = 34.44, P < 0.01; Dunn test: Z = 5.71, P < 0.05, Figure 2a). The large PAs had less patch density than both the small and medium PAs (Kruskal-Wallis test: H2 = 6.24, P < 0.05; small PAs: Dunn’s test: Z = −2.48, P < 0.05; medium PAs: Dunn’s test: Z = −2.34, P < 0.05, Figure 2b). However, there was no significant difference between the PA size and the proportion of forest (Kruskal-Wallis test: H2 = 1.043, ns, Figure 2c) nor between the PA size and the clumpiness index (Kruskal-Wallis test: H2 = 1.62, ns, Figure 2d). The patch density of the wildlife sanctuaries (mean ± SD = 0.12 ± 0.11 patches/km2) was significantly less than the national parks mean ± SD of 0.16 ± 0.14 patches/km2, Kruskal-Wallis test: H2 = 3.87, P < 0.05).
Figure 2.
Habitat fragmentation metrics and PA sizes: Small, medium, and large sizes (*P < 0.05).
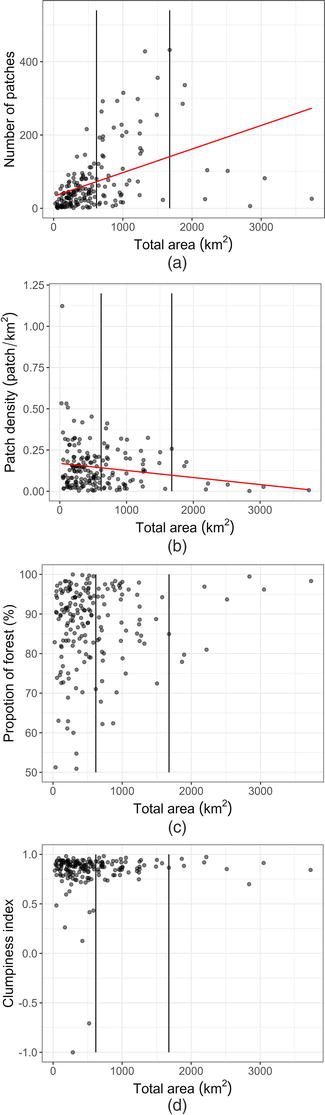
2.5 Total area affecting habitat fragmentation
Total area was positively associated with the number of patches but negatively associated with the patch density (simple linear regression: number of patches: R2 = 0.19, F(1,178) = 41.07, P < 0.001, y = 0.064x + 32.88, Figure 3a; patch density: R2 = 0.032, F(1,178) = 5.86, P < 0.05, y = −0.000043x + 0.17, Figure 3b). Total area was not associated with the proportion of forest and clumpiness index (proportion of forest: F(1,178) = 2.51, ns, Figure 3c; clumpiness index: F(1,178) = 0.85, ns, Figure 3d).
Figure 3.
Total area and habitat fragmentation metrics: (a) number of patches, (b) patch density, (c) proportion of forest, and (d) clumpiness index. Two black lines delineate small, medium, and large PAs.
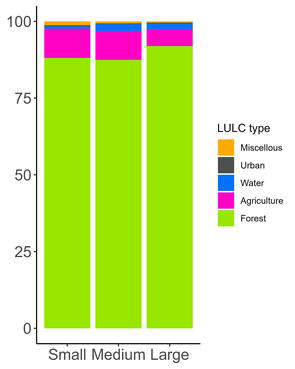
2.6 Land use/land cover types in the protected areas
Forest land LULC made up the highest proportion 88.06, 87.41, and 91.92% of the small, medium, and large PAs, respectively. The second highest LULC type was agricultural land, which comprised 9.56, 9.43, and 5.33% of the small, medium, and large PAs, respectively. The remaining LULC types (water body, urban and built-up land, and miscellaneous land) comprised only 2.38, 3.16, and 2.75% in the small, medium, and large PAs, respectively (Figure 4).
Figure 4.
LULC types in the small, medium, and large PAs (green = forest land, blue = water body, pink = agricultural land, gray = urban and built-up land, and orange = miscellaneous land).
Results of this study revealed that the mean forest proportion of the PAs in Thailand was 87% which is comparable to 85% found in a previous study in Thailand [30]. The forest cover percentages in the IA and II PA categories were reported to be around 80% and 75% globally, respectively [31]. In our study, the mean patch density and clumpiness index of the PAs in Thailand were 0.14 patches/km2 and 0.83, respectively. These metrics indicate that the degree of habitat fragmentation contributed to the adequacy of PAs for wildlife species. Low patch density and high clumpiness index show high connectivity in the PAs. The PAs with high connectivity increase subpopulation survival by allowing populations among patches to meet, mate, and forage successfully [5, 32].
Our study showed 123 small PAs out of 180 PAs, ranging from 24 to 618 km2, indicating that most of the PAs in Thailand are small with high patch density. Small PAs with high habitat fragmentation lead to lowering the interior edge ratio, speeding up the breaking rates of small patches, reducing the mean patch size, and increasing the isolation among patches [1]. Our study also found that habitat fragmentation in wildlife sanctuaries was higher than in national parks because of management policy differences. National parks have stricter rules and regulations with severe penalties, for example, prohibiting human activities, closing to the public, and having fixed and defined park boundaries, compared to wildlife sanctuaries. Local people cannot collect non-timber forest products (e.g. honey, fruits, and berries) from national parks, preventing the downgrading of large-scale ecosystems, which is a cause of habitat fragmentation [33].
Our study is among the first in Thailand to demonstrate that PA size influences habitat fragmentation with a negative association. The results are consistent with previous studies [34, 35]. Our results indicated that, at least in Thailand, the PA size has to be larger than 1600 km2 to slow down human activities such as slash-and-burn farming, rural development, and urbanization. Like many developing countries, Thailand’s main habitat loss comes from converting forests to cropland for high-priced food [36, 37], rubber plantation, and biofuel crops. Besides causing habitat fragmentation, these planted fields can support fewer species than forests [38]. In addition, our results also indicated that some forest land has been converted to housing developments, roads, and industrial sites. Rural development and urban expansion in Thailand are related to road construction, leading to land use changes from forest land to agricultural land. The fragmented PAs may become too small to support large territorial species for their food and mates and for migratory species to find places to feed in their migratory routes. A key benefit of large PA size is preventing edge effect, which causes changes in microclimate and alters the ecological systems around the interior and exterior portions of the fragments [39].
3. Policies needed to reduce fragmentation in Thailand
Like many developing nations, Thailand faces the challenge of a fragmented landscape across various sectors. This fragmentation hinders efficient governance, economic development, and social cohesion. A multi-pronged approach involving policy interventions in different areas is crucial to address this issue. Here are some key policy considerations:
3.1 Land use and urban planning
Land use and urban planning are two key policies needed to reduce forest fragmentation in Thailand. The three key areas focused on are spatial planning, urban zoning, and infrastructure development. First, spatial planning implements comprehensive national and regional spatial plans that guide development around strategic centers, promoting efficient land use and reducing sprawl. Second, urban zoning can be implemented by reinforcing clear and transparent zoning regulations delineating areas for different activities, minimizing land-use conflicts, and promoting mixed-use development. Lastly, infrastructure development is another major driver of fragmentation. Prioritize investment in infrastructure networks (transportation, water, and sanitation) that connect fragmented urban and rural areas, fostering greater accessibility and economic integration.
3.2 Governance and institutional reform
Governance and institutional reform are needed to reduce forest fragmentation in Thailand. Three key focuses are decentralization, streamlined regulations, improved data sharing, and transparency. Decentralization can be undertaken by enhancing local government autonomy and capacity to manage their affairs while promoting intergovernmental coordination and collaboration to address regional challenges. Streamlined regulations can be employed by simplifying and harmonizing regulatory frameworks across different sectors and agencies, reducing bureaucratic hurdles, and promoting business environment consistency. Improved data sharing and transparency would foster collaboration and information exchange between government agencies, the private sector, and civil society to facilitate informed decision-making and address fragmentation challenges.
3.3 Economic development and social inclusivity
Economic development tends to work against forest fragmentation everywhere in the world. If Thailand can use economic development as a positive driving force to reduce forest fragmentation, we should focus on these three areas: target incentives, skill development, and social safety nets. For targeted incentives, Thailand should design and implement targeted incentives for businesses and industries to invest in underdeveloped or fragmented areas, promoting economic diversification and regional development. For skills development, we should invest in skills training and education programs that equip individuals with the skills to thrive in a globally integrated economy, reducing income inequality and social fragmentation. For social safety nets, strengthening social protection programs to address vulnerabilities and ensure equitable access to opportunities for all, fostering greater social cohesion, and reducing inequality need to be addressed.
3.4 Forest management strategies for protected areas expansion
Expanding protected areas plays a crucial role in safeguarding Thailand’s natural heritage and ensuring the long-term survival of its unique flora and fauna. The 1950s saw the Royal Thai government take decisive action against deforestation, establishing protected areas and launching dedicated reforestation programs, with a target of maintaining at least 50% of the country’s forest cover (Thai Forestry Sector Master Plan, 1993) [30, 40]. Responding to rapid deforestation, the 1985 National Forest Policy set a 40% national forest cover goal, with 15% designated as strictly protected areas and 25% dedicated to sustainable resource utilization [10]. Thailand’s unwavering dedication to environmental stewardship is evident in the impressive network of protected areas established in 2005. With 103 national parks, 84 forest reserves, and 55 wildlife sanctuaries stretching across the country, Thailand is a testament to preserving natural heritage for future generations [41]. With the National Park Act and the Wild Animal Reservation and Protection Act (2019) now in place, Thailand’s stunning landscapes and abundant wildlife have a brighter future. These comprehensive laws equip authorities with enhanced tools to combat poaching, manage tourism responsibly, and promote sustainable practices within protected areas, laying the foundation for a flourishing natural heritage for years. Forest management strategies for protected area expansion in Thailand should focus on three areas: (1) collaborative landscape management, (2) ecological restoration and connectivity, and (3) science-based decision-making.
3.4.1 Collaborative landscape management
Collaborative landscape management is crucial in community forests and buffer zones. We empower local communities to manage and steward forests within their traditional territories, proven effective in reducing deforestation and promoting sustainable practices. Local communities will be planted with a sense of ownership and responsibility for their land, leading to improved conservation outcomes. By surrounding protected areas with a buffer of well-managed forest, connectivity between habitat patches operates as dispersal corridors, allowing for vital animal movement and gene flow and preventing demographic and genetic depression of resident populations [42]. Buffer zones around protected areas provide specific benefits: reducing habitat fragmentation, minimizing physical or chemical edge effects (e.g., agricultural pesticides, soil erosion, fires), promoting sustainable resource use, preventing encroachment, and protecting against encroachment and harmful activities like illegal logging and poaching [43]. Effective buffer zone management strategies have four key areas: community participation, land-use planning, livelihood diversification, and monitoring and enforcement. In many regions, securing adequate funding and resources for long-term buffer zone management remains challenging. Raising awareness and public support for buffer zone conservation is crucial for garnering wider commitment and participation. By effectively managing buffer zones, we can create a win-win situation for people and nature. These crucial transitional areas can safeguard the ecological integrity of protected areas while fostering sustainable livelihoods and promoting harmonious relationships between communities and the natural world.
3.4.2 Ecological restoration in Thailand: Reviving nature’s tapestry
Habitat loss, deforestation, and unsustainable practices have fragmented landscapes and threatened precious biodiversity. Ecological restoration aims to heal damaged ecosystems, returning them to a state closer to their original biodiversity and functionality. Ecological restoration can involve various practices, from planting native trees and restoring degraded mangrove forests to controlling invasive species and reintroducing native fauna [44]. Engaging local communities in restoration efforts fosters ownership and long-term sustainability. Communities can participate in tree planting, seed collection, and monitoring activities, building a connection to the revived ecosystem. Utilizing ecological data and understanding each degraded ecosystem’s needs are crucial for effective restoration. This approach ensures the right species are planted in the right places, and those restoration efforts are tailored to the unique challenges of each site. Third, a holistic perspective addressing the underlying causes of environmental damage, such as unsustainable land-use practices or pollution, is essential for the long-term success of restoration efforts. Finally, innovation and adaptation by embracing new technologies and approaches can accelerate and enhance restoration processes. For example, drone-based seed dispersal holds promise for reforesting large areas efficiently [45].
3.4.3 Science-based decision-making
Science-based decision-making in forest management is a data-driven approach that utilizes sound scientific principles and evidence to inform forest management decisions. This management involves gathering and analyzing relevant data, utilizing scientific models and tools, engaging stakeholders, and monitoring and adapting. Gathering and analyzing relevant data include ecological data such as species composition, forest health, and soil quality, as well as socioeconomic data on local communities and forest-based industries. Utilizing scientific models and tools such as advanced models and simulations can predict the ecological and economic consequences of different management decisions, allowing for informed choices. Engaging stakeholders by consulting with experts, local communities, and forest workers ensures all perspectives are considered and fosters broader decision support. Monitoring and adapting by regularly monitoring the outcomes of implemented decisions and adapting management practices based on new data and changing circumstances is essential for continuous improvement.
Considering decisions’ long-term ecological and economic implications, this approach promotes sustainable practices that safeguard biodiversity and forest health for future generations. Data-driven decisions minimize negative impacts on ecosystems, such as soil erosion, water pollution, and habitat loss. Informed decision-making optimizes timber production, carbon sequestration, and other ecosystem services, contributing to a thriving forest-based economy. Publicly available data and open communication with stakeholders build trust and transparency in forest management practices. Examples of science-based decision-making are precision forestry (i.e., GIS, remote sensing, and precision data collection techniques that allow for targeted forest management interventions, optimizing resource utilization, and minimizing environmental impact).
3.4.4 Challenges and opportunities
Thailand’s journey toward sustainable forest management demands a multifaceted approach. Here are four key hurdles in balancing conservation with human needs: (1) balancing conservation needs with communities’ livelihoods near or within protected areas, (2) addressing illegal logging, poaching, and encroachment effectively, (3) securing adequate funding and resources for long-term protected area management, and (4) raising awareness and public support for protected area expansion and sustainable forest management practices. By implementing these strategies and addressing the challenges, Thailand can continue to expand its protected areas and ensure the long-term health and resilience of its diverse and irreplaceable ecosystems. Remember, a healthy future for Thailand’s forests goes hand-in-hand with a thriving future for its people and wildlife.
Protected areas provide sustainability of natural ecosystems and support species diversity. There is a huge interest in how large the PAs should be to be able to conserve diverse fauna and flora. In this study, the PA size was negatively associated with habitat fragmentation. Large PAs of 1600 km2 or larger are preferred over small PAs to reduce habitat fragmentation due to agricultural land expansion and contribute to biodiversity conservation. Thailand is now in a concerning situation as there are 128 small PAs out of 180 PAs. Maintaining these small-size PAs and slowing down habitat fragmentation rates would be a significant challenge for Thailand to tackle.
We would also like to thank Professor Surendra N. Kulshreshtha for providing suggestions on previous versions of this manuscript and David C. Chang for providing English language and editing support through their comments on previous versions of this work. This research was partly funded by the DPST scholarship to O. C. and the Center of Excellence for Ecoinformatics, Walailak University.
Conceptualization, K.J.; methodology, K.J., O.C., and M.J.; formal analysis, K.J. and O.C.; investigation, K.J.; data curation, P.B.; writing—original draft preparation, K.J. and O.C.; writing—review and editing, K.J., O.C., M.J. and E.B.S.; project administration, K.J.; funding acquisition, K.J. All authors have read and agreed to the published version of the manuscript.
References
1.Haddad NM, Brudvig LA, Clobert J, Davies KF, Gonzalez A, Holt RD, et al. Habitat fragmentation and its lasting impact on Earth’s ecosystems. Science Advances. 2015;1(2):e1500052. DOI: 10.1126/sciadv.1500052
2.Crooks KR, Burdett CL, Theobald DM, King SRB, Di Marco M, Rondinini C, et al. Quantification of habitat fragmentation reveals extinction risk in terrestrial mammals. National Academy of Sciences of the United States of America. 2017;114(29):7635-7640. DOI: 10.1073/pnas.1705769114
3.Debinski DM, Holt RD. A survey and overview of habitat fragmentation experiments. Conservation Biology. 2001;14(2):342-355. DOI: 10.1046/j.1523-1739.2000.98081.x
4.Matlack GR. Microenvironment variation within and among forest edge sites in the eastern United States. Biological Conservation. 1993;66(3):185-194. DOI: 10.1016/0006-3207(93)90004-K
5.Olsoy PJ, Zeller KA, Hicke JA, Quigley HB, Rabinowitz AR, Thornton DH. Quantifying the effects of deforestation and fragmentation on a range-wide conservation plan for jaguars. Biological Conservation. 2016;203:8-16. DOI: 10.1016/j.biocon.2016.08.037
6.Suttidate N. Evaluating the utility of protected area status and conservation legislation in tropical forest conservation using satellite data: A case study of the great hornbill in Thailand. Journal of Tropical Ecology. 2022;38(3):127-133. DOI: 10.1017/S0266467421000560
7.Barlow J, Lennox GD, Ferreira J, Berenguer E, Lees AC, MacNally R, et al. Anthropogenic disturbance in tropical forests can double biodiversity loss from deforestation. Nature. 2016;535(7610):144-147. DOI: 10.1038/nature18326
8.UNEP-WCMC. Protected area profile for Thailand from the world database on protected areas [Internet]. 2023. Available from: https://www.protectedplanet.net/
9.Santiago-Ramos J, Feria-Toribio JM. Assessing the effectiveness of protected areas against habitat fragmentation and loss: A long-term multi-scalar analysis in a Mediterranean region. Journal for Nature Conservation. 2021;64:126072. DOI: 10.1016/j.jnc.2021.126072
10.Appanah S, Lamb D, Durst P, Thaung TL, Sabogal C, Gritten D, et al. Forest landscape restoration for Asia-Pacific forests: A synthesis. In: Appanah S, editor. Forest Landscape Restoration for Asia-Pacific Forests. Bangkok: FAO and RECOFTC; 2016
11.Royal Forest Department. Thailand’s Forestry Statistics Data Report 2020. Bangkok: Planning and Information Office, Royal Forest Department; 2021. (In Thai)
12.Hosonuma N, Herold M, De Sy V, De Fries RS, Brockhaus M, Verchot L, et al. An assessment of deforestation and forest degradation drivers in developing countries. Environmental Research Letters. 2012;7(4):044009
13.The United Nations Food and Agriculture Organization (FAO) and The United Nations Environment Programme (UNEP). The state of the World’s forests 2020. In: Forests, Biodiversity and People. Rome: FAO; 2020. 214 p. DOI: 10.4060/ca8642en
14.Wangpakapattanawong P, Tiansawat P, Sharp A. Forest restoration at the landscape level in Thailand. In: Appanah S, editor. Forest Landscape Restoration for Asia-Pacific Forests. Bangkok: FAO and RECOFTC; 2016
15.Wijitkosum S. The impact of land use and spatial changes on desertification risk in degraded areas in Thailand. Sustainable Environmental Research. 2016;26(2):84-92
16.Bennett L. Deforestation and Climate Change. Washington DC: The Climate Institute; 2017. 1400 p
17.Houspanossian J, Giménez R, Jobbágy E, Nosetto M. Surface albedo raise in the south American Chaco: Combined effects of deforestation and agricultural changes. Agricultural and Forest Meteorology. 2017;232:118-127
18.Mapulanga AM, Naito H. Effect of deforestation on access to clean drinking water. National Academy of Sciences of the United States of America. 2019;116(17):8249-8254
19.Gatti LV, Basso LS, Miller JB, Gloor M, Gatti Domingues L, Cassol HL, et al. Amazonia as a carbon source linked to deforestation and climate change. Nature. 2021;595(7867):388-393
20.Kamolrattanakul K, Tungkananuruk K, Rungratanaubon T, Sillberg CV. Analytical approach to deforestation effect on climate change using metadata in Thailand. Environment Asia. 2022;15(1):154-165. DOI: 10.14456/ea.2022.14
21.West TA, Börner J, Fearnside PM. Climatic benefits from the 2006-2017 avoided deforestation in Amazonian Brazil. Frontiers in Forests and Global Change. 2019;2:52
22.Chakravarty S, Ghosh SK, Suresh CP, Dey AN, Shuklab G. Deforestation: Causes, effects and control strategies. Global Perspectives on Sustainable Forest Management. 2012;1:1-26
23.Staal A, Flores BM, Aguiar AP, Bosmans JH, Fetzer I, Tuinenburg OA. Feedback between drought and deforestation in the Amazon. Environmental Research Letters. 2020;15(4):044024
24.Schlesinger WH, Jasechko S. Transpiration in the global water cycle. Agricultural and Forest Meteorology. 2014;189:115-117
25.Ministry of Natural Resources and Environment. 20-year strategic plan for the ministry of natural resources and environment (B. E. 2560-2579) [Internet]. 2024. Available from: https://www.mnre.go.th/en/about/content/1065
26.Dudley N, editor. Guidelines for Applying Protected Area Management Categories. Gland, Switzerland: IUCN; 2008. 86 p
27.ESRI. What is the Jenks optimization method? [Internet]. 2024. Available from: https://support.esri.com/en/technical-article/000006743
28.McGarigal K, Cushman SA, Ene E. FRAGSTATS v4: Spatial Pattern Analysis Program for Categorical and Continuous Maps. Amherst: University of Massachusetts; 2012
29.Kupfer JA. Landscape ecology and biogeography. Progress in Physical Geography: Earth and Environment. 2012;36(3):400-420. DOI: 10.1177/0309133312439594
30.Trisurat Y. Applying gap analysis and a comparison index to evaluate protected areas in Thailand. Environmental Management. 2007;39(2):235-245. DOI: 10.1007/s00267-005-0355-3
31.Leberger R, Rosa IMD, Guerra CA, Wolf F, Pereira HM. Global patterns of forest loss across IUCN categories of protected areas. Biological Conservation. 2020;241:108299. DOI: 10.1016/j.biocon.2019.108299
32.Slattery Z, Fenner R. Spatial analysis of the drivers, characteristics, and effects of forest fragmentation. Sustainability. 2021;13(6):3246. DOI: 10.3390/su13063246
33.Ferraro PJ, Hanauer MM, Miteva DA, Canavire-Bacarreza G, Pattanayak SK, Sims KRE. More strictly protected areas are not necessarily more protective: Evidence from Bolivia, Costa Rica, Indonesia, and Thailand. Environmental Research Letters. 2013;8(2):025011. DOI: 10.1088/1748-9326/8/2/025011
34.Armsworth PR, Jackson HB, Cho S-H, Clark M, Fargione JE, Iacona GD, et al. Is conservation right to go big? Protected area size and conservation return-on-investment. Biological Conservation. 2018;225:229-236. DOI: 10.1016/j.biocon.2018.07.005
35.Cho SH, Thiel K, Armsworth PR, Sharma BP. Effects of protected area size on conservation return on investment. Environmental Management. 2019;63(6):777-788. DOI: 10.1007/s00267-019-01164-9
36.Vongvisouk T, Broegaard RB, Mertz O, Thongmanivong S. Rush for cash crops and forest protection: Neither land sparing nor land sharing. Land Use Policy. 2016;55:182-192. DOI: 10.1016/j.landusepol.2016.04.001
37.Hurni K, Fox J. The expansion of tree-based boom crops in mainland Southeast Asia: 2001 to 2014. Journal of Land Use Science. 2018;13(1-2):198-219. DOI: 10.1080/1747423x.2018.1499830
38.Fitzherbert EB, Struebig MJ, Morel A, Danielsen F, Bruhl CA, Donald PF, et al. How will oil palm expansion affect biodiversity? Trends in Ecology and Evolution. 2008;23(10):538-545. DOI: 0.1016/j.tree.2008.06.012
39.Magnago LFS, Rocha MF, Meyer L, Martins SV, Meira-Neto JAA. Microclimatic conditions at forest edges have significant impacts on vegetation structure in large Atlantic forest fragments. Biodiversity and Conservation. 2015;24(9):2305-2318. DOI: 10.1007/s10531-015-0961-1
40.Wikramanayake E, Dinerstein E, Loucks CJ, Olson DM, Morrison J, Lamoreux J, et al. Terrestrial Ecoregions of the Indo-Pacific: A Conservation Assessment. Washington, Covelo & London: Island Press; 2002. 643 p. DOI: 10.1017/S0030605303000218
41.Singh M, Griaud C, Collins CM. An evaluation of the effectiveness of protected areas in Thailand. Ecological Indicators. 2021;125:107536. DOI: 10.1016/j.ecolind.2021.107536
42.Pulsford I, Lindenmayer D, Wyborn C, Lausche B, Vasilijević M, Worboys GL, et al. Connectivity conservation management. In: Worboys GL, Lockwood M, ASF K, Feary S, Pulsford I, editors. Protected Area Governance and Management. Canberra: ANU Press; 2015. pp. 851-888. Available from: https://www.iucn.org/content/protected-area-governance-and-management
43.Perello LFC, Guadagnin DL, Maltchik L, dos Santos JE. Ecological, legal, and methodological principles for planning buffer zones. Natural Conservation. 2012;10:3-11. DOI: 10.4322/natcon.2012.002
44.Peres CA, Terborgh JW. Amazonian nature reserves: An analysis of the defensibility status of existing conservation units and design criteria for the future. Conservation Biology. 1995;9:34-46. DOI: 10.1046/j.1523-1739.1995.09010034.x
45.Liu Y, Zhao D, Zhao J, Liu J, Zhang H, Ma X, et al. Influence of the operating parameters of an unmanned pine seeding system on the final seeding uniformity. Industrial Crops and Products. 2023;205:117439. DOI: 10.1016/j.indcrop.2023.117439
Written By
Krisanadej Jaroensutasinee, Mullica Jaroensutasinee, Orranan Chuachart and Elena Sparrow
Submitted: 01 January 2024Reviewed: 09 January 2024Published: 09 February 2024