Open Access is an initiative that aims to make scientific research freely available to all. To date our community has made over 100 million downloads. It’s based on principles of collaboration, unobstructed discovery, and, most importantly, scientific progression. As PhD students, we found it difficult to access the research we needed, so we decided to create a new Open Access publisher that levels the playing field for scientists across the world. How? By making research easy to access, and puts the academic needs of the researchers before the business interests of publishers.
We are a community of more than 103,000 authors and editors from 3,291 institutions spanning 160 countries, including Nobel Prize winners and some of the world’s most-cited researchers. Publishing on IntechOpen allows authors to earn citations and find new collaborators, meaning more people see your work not only from your own field of study, but from other related fields too.
Glaciers are an inherent component of the landscape, culture, and environment in the high mountain areas of the Himalayas. Glacier distribution and its impacts are diverse in various landforms and landscape scales. Past studies on glaciers have focused on the individual, river basins, or at the country level, but none have been analyzed at the transboundary landscape level. This study investigates the spatial distribution of glaciers in the transboundary Kailash sacred landscape (KSL) at multiple time scales. The study revealed that 3.8% of the total landscape area is covered by glaciers. Altogether, 1941 glaciers were identified, covering 1169.04 ± 27.71 km2 area in 2020, most of which are highly concentrated in the southern part of the landscape in the Kali and West Seti basins. From 1990 to 2020, these glaciers have retreated significantly by 25.5% of their area. Oppositely, due to the shrinkage and fragmentation of individual glaciers, the number of glaciers has increased by 7.8%. The glacier retreat rate is higher at elevations below 5500 masl, and glaciers below 3500 masl have disappeared completely after 2010. Systematic long-term glacier monitoring is required, and the data can be utilized to project water resource availability based on various climatic and glacio-hydrological models.
*Address all correspondence to: sudan.maharjan@icimod.org
1. Introduction
Glaciers are an inherent component of the landscape in the high mountain areas of the Hindu Kush Himalaya (HKH) region, having religious and cultural significance in many societies [1, 2]. They play a pivotal role in freshwater supply for agriculture, industrial and domestic use, hydropower generation, and recreation [3, 4]. The HKH region, often dubbed as the third pole, holds 60,000 km2 of glacier area [5], equivalent to 8.5% of the world’s total. Global glacier data is available from various initiatives such as the Global Land Ice Measurements from Space (GLIMS) [6], Randolph Glacier Inventory (RGI) [7], the Gamdam Glacier Inventory (GCI) [8], and the Second Chinese Glacier Inventory (CGI) [9]. These databases provide an understanding of the regional coverage of glaciers for a particular period and are widely used in cryo-hydrological modeling [10]. The databases were compiled and generated using various mapping methods and data sources, and their accuracy varies across subregions and basins. For the systematic change analysis, it is necessary to generate the data from consistent data sources and methods.
Glaciers are very sensitive to changes in temperature. They have been retreating, shrinking, and thinning rapidly [11, 12, 13, 14, 15, 16, 17, 18] due to a rise in global temperature, most notably since the late 1970s [19]. The trend of temperature rise is projected to continue resulting in the expected loss of approximately 36% of glacier ice by the end of this century in the HKH region [18, 20]. Many studies show the decrease in glacier area throughout the Himalayas and Tibetan Plateau [12, 13, 15, 21, 22, 23]. The changes vary spatially depending on size, shape, morphological and topographical characteristics, and local and regional climatic conditions. The studies at the country level show a drastic retreat of glaciers – in Nepal, it has retreated by 24% and in Bhutan by 23% during the 1980–2010 period, and in Afghanistan by 13.8% between 1990 and 2015 [12, 13, 24, 25].
Alongside retreat and shrinkage, glaciers in the region are also thinning significantly and losing ice mass. Between 2000 and 2016, the loss of ice mass across the Himalayas has doubled compared to 1975–2000 [26]. However, in some areas, especially in the Karakorum (northern Pakistan), glaciers are advancing mostly in individual surges, without significant changes in glacier area [18, 27, 28].
The recession of glaciers in the region also resulted in an increase in debris-covered ice [29, 30], and the elevation of debris-covered parts is moving upward [31]. Thick debris cover on ice insulates the ice from melting, but if it is covered by a thin layer, the melting rate will further accelerate. In addition, the formation of new glacial lakes and expansion of glacial lakes either attached to or close by glaciers have also increased. This increases the risks of glacial lake outburst flood (GLOF), threatening the life and infrastructure of communities living downstream [32, 33].
Past studies on glaciers have focused on individual, river basins or at the country level, but none have been analyzed at the transboundary landscape level. Glaciers in the HKH region are water sources for transboundary rivers such as the Ganges, Brahmaputra, and Indus. Therefore, the shrinking of glaciers and the impact on river hydrology will have serious implications for the population living downstream. Hence, the information on individual scale or river basins or mountain ranges is not sufficient to cover the various issues and impacts at the landscape level. This research aims to understand the status of glaciers in a transboundary landscape and to analyze their physical characteristics and changes in the area between 1990 and 2020. The information from this study will support effective conservation and management of the landscape.
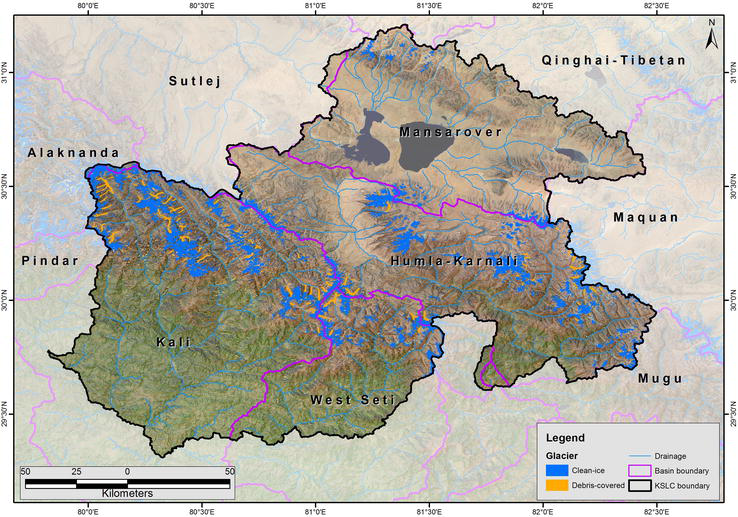
The Kailash Sacred Landscape (KSL) is a transboundary landscape extending across the southwestern portion of the Tibet Autonomous Region (TAR) of China, four districts in the western region of Nepal, and the northeastern flank of Uttarakhand State in India [34]. The KSL covers an area of 31,000 km2 and has three major rivers flowing through it – Mahakali (Kali), west Seti, and Humla-Karnali; tributaries of Ghaghara River and one major Manasarovar interior basin (Figure 1). The Ghaghara River, a major left-bank tributary of the Ganges, originates as the Karnali River (known as Kongque He in Chinese) in the higher Himalayas of the southern Tibetan Autonomous Region (TAR), China. Following southeast through Nepal and crossing the Siwalik range, it splits into branches and rejoins south of the Indian border. The river then continues its course through Uttar Pradesh and Bihar states, eventually mearing with Ganges. Almost 75% of the KSL is covered by the tributaries of the Ganga River, and around 25% of the area is covered by the Manasarovar inland catchment. Less than 1% of the area falls in the Indus Basin.
Figure 1.
Distribution of glaciers in various river basins in the Kailash sacred landscape.
The KSL represents a diverse and multicultural landscape [35]. The landscape is characterized by numerous sacred sites, including high-altitude lakes, snow peaks, glaciers, and a network of religious places across the three countries [35]. The Mt. Kailash and Manasarovar Lake are the most important holy sites for five religions and a destination for many pilgrims. It shows great variations in altitude and topography. The elevation ranges from 380 masl, the lowest along the river valley of Kali, to 7500 masl, the highest peak in the Humla basin in the northern part of the landscape. The ecosystems of the landscape vary widely from subtropical to temperate, alpine, and cold high-altitude desert types. The melting of snow, glaciers, and permafrost in the high mountain areas of the landscape are major sources of freshwater for all the major rivers and tributaries, especially during the dry season.
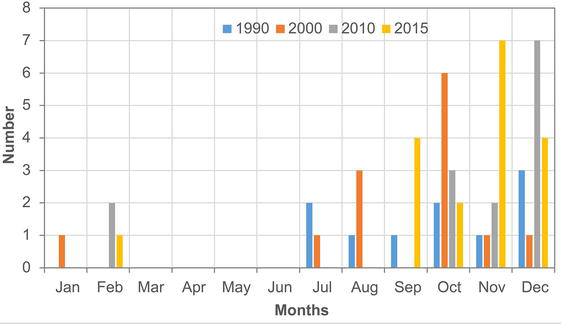
The study used various series of Landsat (Thematic Mapper (TM), Enhanced Thematic Mapper (ETM) + and OLI) images as it has a long historical record and is freely accessible through the USGS web portal. The acquired images for all time periods (1990, 2000, 2010, and 2020) were from October to December, except for a few images from January to September (Figure 2). One-year buffer time was used to get the best quality images, except in 1990, for which a 2-year buffer was used, if the images of the selected period were of low quality. Data gaps due to scan line error in ETM+ images, especially for 2010, were anticipated by overlaying the two images of the subsequent month as the seasonal changes within 2 to 3 months are nominal. Overall, seven tiles of Landsat images cover the complete area of KSL in which a major part of the glaciated area is covered by two tiles (144/39 and 145/39). Altogether, 40 Landsat images were used to prepare four-time data from 1990 to 2020 and included 10 Thematic Mapper (TM) images for 1990, one Thematic Mapper (TM) and 12 Enhanced Thematic Mapper plus (ETM+) images for 2000, 8 TM and 6 ETM+ images for 2010, 4 OLI images for 2020 glacier data.
Figure 2.
Seasonal distribution images used for glacier mapping with respect to representative years.
Terrain characteristics such as slope, elevation, and aspect are also important parameter for the identification of glaciers. Higher resolution DEMs such as ASTER GDEM and SRTM 30 m are available, but they consist of many voids in the higher Himalayan region. Hence, this study used the void-filled SRTM 90 m DEM for glacier mapping and data generation.
3.2 Glacier mapping method
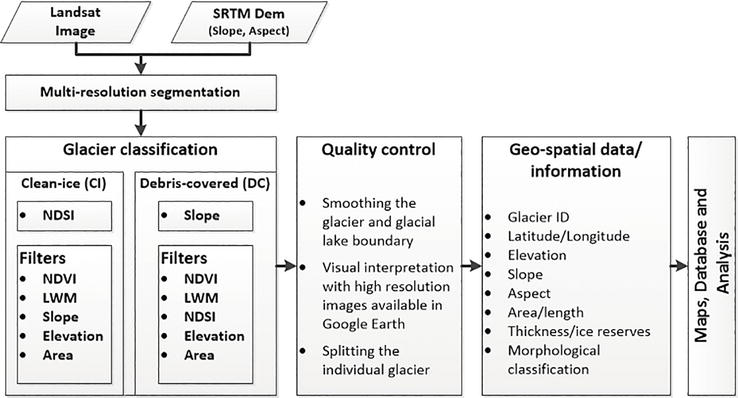
The present study adopted a semi-automatic object-based image classification method [12, 13, 36], as illustrated in Figure 3. Primary Landsat images of 2020 were used to create image objects based on homogenous characteristics of pixels. The multi-resolution segmentation process was applied with an appropriate scale factor to create image objects so that the boundary of image objects exactly follows the glacier boundary. These image objects were classified by developing separate rule sets for clean-ice (CI) and debris-covered (DC) glaciers based on the spectral and spatial characteristics of the image objects. We applied widely used spectral indices NDSI for the classification of CI objects as the primary rule, and other various indices such as NDVI, LWM, and other spectral and spatial characteristics, including terrain information and area, were used for filtering misclassified objects from the primary rule. After the classification of CI glacier objects, a similar process was applied for classifying DC glaciers using slope as the primary classification rule in the remaining unclassified objects. All the final classified CI and DC image objects were merged and then exported to a vector file.
Figure 3.
Flow chart of glacier mapping and glacier database generation (modified [36], p. 12).
The vector-based glacier polygons were thoroughly checked by overlaying on the respective images, and some manual correction was done in shadow, seasonal snow cover, turbid/frozen proglacial lakes, and especially the boundary of the DC glacier and its terminus. The glacier boundary was smoothed automatically to remove the zigzag boundary formed due to the pixel size of the images. Each glacier within the glacier polygons was manually separated based on the hydrological flow direction [36, 37, 38]. The detailed characteristics of individual glaciers were calculated, and analysis was done in the ArcGIS environment using DEM and various tools [36, 37, 38].
The glaciers of other time periods (2010, 2000, and 1990) were prepared manually by using the same final glacier data of 2020 overlaying on the respective images of 2010, 2000, and 1990 so that there are no discrepancies of overlapping in all the time series datasets.
3.3 Uncertainty
The uncertainty in glacier boundaries typically depended on the quality of images used, interpretation made by individuals, and contrast between the glacier and adjacent features [39, 40, 13]. The study used little or no snow cover and cloud-covered images for mapping as far as possible to generate quality boundaries from automatic processes. The manual correction was made for overshadows, seasonal snow covers, and low contrast between DC glacier boundaries and adjacent terrain by overlying the respective images and visual cross-checking on high-resolution images available on Google Earth images to maintain the quality of the glacier boundary. In order to minimize discrepancies between decadal time data, the semi-automatically mapped glacier boundaries of 2020 were overlaid on the representative images of 1990, 2000, and 2010 to manually prepare glacier boundaries of the respective time periods. This process reduced most of the errors in the glacier outlines; uncertainty only remains on the position of glacier outlines with respect to the image resolution, which is dependent on and could not be greater than half of its resolution. Hence, the uncertainty of glacier boundaries was calculated as the root mean square of each glacier area from the glacier polygon and the area was calculated as the total number of pixels bounded by the glacier boundary with a buffer (half of the image resolution) increment [13]. Overall, the uncertainty of the glacier area of each time data ranged from 2 to 3% of the total area, which also matched other previous estimates [13, 41, 42].
4.1 Overall distribution and shrinkage of glaciers
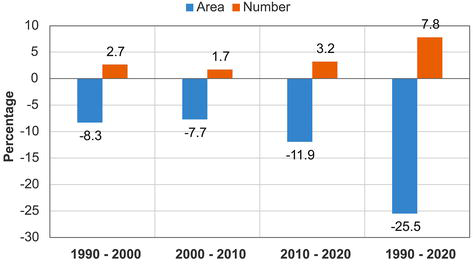
The study revealed 1941 glaciers covering a surface area of 1169.04 ± 27.71 km2, which is equivalent to 3.8% of the total landscape area in 2020 (Table 1). Almost 13.3% of the total glacier area is covered by debris. The majority of the glaciers (91%) are in the Ghaghara basin, which is one of the major tributaries of the Ganges River. Within the basins, the Kali sub-basin consists of almost 39% of glaciers in KSL, covering 45% of the total area of glaciers in the landscape. Similarly, the second highest number (more than 38%) and area (38%) coverage is in the Humla-Karnali sub-basin. The Manasarovar inland basin only consists of 9% of glaciers, with an area coverage of 6% of the total glacier area in the KSL. Overall, the number of glaciers has increased by 7.8%, while the glacier area has decreased by 25.5% in three decades from 1990 to 2020 (Figure 4), with a drastic decrease in recent decades, i.e., 2010–2020 (11.9%), compared to previous decades.
Year
Basin
Sub-basin
Glacier Number
Area (km2)
CI
DC
Total
CI
DC
Total
Largest
2020
Ghaghara
Kali
751
57
751
429.94 ± 10.89
93.44 ± 0.9
523.38 ± 12.84
49.46 ± 1.29
Humla
739
42
739
406.37 ± 8.75
43.81 ± 0.45
450.18 ± 9.49
12.53 ± 0.27
West Seti
282
13
282
105.81 ± 2.18
17.78 ± 0.1
123.59 ± 2.5
12.33 ± 0.26
Total
1772
112
1772
942.12 ± 21.75
155.03 ± 1.47
1097.15 ± 24.69
49.46 ± 1.29
Manasarovar
169
0
169
71.89 ± 2.47
0 ± 0
71.89 ± 2.47
7.13 ± 0.26
Total
1941
112
1941
1014.01 ± 24.61
155.03 ± 1.47
1169.04 ± 27.71
49.46 ± 1.29
2010
Ghaghara
Kali
738
56
738
503.21 ± 9.16
90.03 ± 0.46
593.24 ± 10.45
50.83 ± 0.9
Humla
706
43
706
462.16 ± 8.68
46.19 ± 0.3
508.35 ± 9.31
14.30 ± 0.27
West Seti
266
13
266
126.23 ± 2.12
16.4 ± 0.11
142.63 ± 2.35
13.09 ± 0.22
Total
1710
112
1710
1091.6 ± 19.91
152.62 ± 0.89
1244.22 ± 22.06
50.83 ± 0.9
Manasarovar
170
0
170
83.17 ± 2.03
0 ± 0
83.17 ± 2.03
7.58 ± 0.18
Total
1880
112
1880
1174.77 ± 22.18
152.62 ± 0.89
1327.39 ± 24.42
50.83 ± 0.9
2000
Ghaghara
Kali
735
56
735
542.64 ± 11.17
91.08 ± 0.47
633.72 ± 12.6
52.14 ± 1.03
Humla
683
42
683
509.47 ± 7.48
46.1 ± 0.33
555.57 ± 7.97
14.52 ± 0.21
West Seti
255
13
255
138.69 ± 1.94
19.86 ± 0.11
158.55 ± 2.18
14.75 ± 0.21
Total
1673
111
1673
1190.8 ± 20.76
157.04 ± 0.96
1347.84 ± 22.85
52.14 ± 1.03
Manasarovar
175
0
175
90.47 ± 2.2
0 ± 0
90.47 ± 2.2
9.37 ± 0.23
Total
1848
111
1848
1281.27 ± 23.32
157.04 ± 0.96
1438.31 ± 25.51
52.14 ± 0.87
1990
Ghaghara
Kali
709
55
709
608.16 ± 9.7
81.17 ± 0.55
689.33 ± 10.66
54.5 ± 0.22
Humla
673
41
673
556.07 ± 7.69
39.49 ± 0.31
595.56 ± 8.07
15.5 ± 0.22
West Seti
243
13
243
168.88 ± 2.11
16.33 ± 0.14
185.21 ± 2.28
16.0 ± 0.2
Total
1625
109
1625
1333.11 ± 19.47
136.99 ± 1.02
1470.1 ± 20.97
54.5 ± 0.87
Manasarovar
175
0
175
98.26 ± 1.74
0 ± 0
98.26 ± 1.74
9.7 ± 0.17
Total
1800
109
1800
1431.37 ± 21.38
136.99 ± 1.02
1568.36 ± 22.91
54.5 ± 0.87
Table 1.
Number and area of clean-ice and debris-covered glaciers in the Kailash sacred landscape.
Figure 4.
Percentage changes in number and area of glaciers from 1990 to 2020.
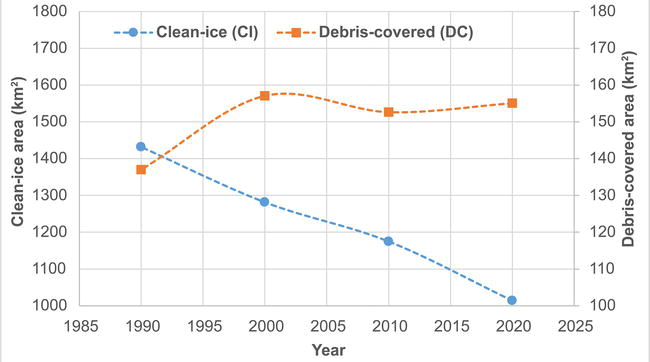
4.2 Distribution and changes in clean-ice(CI) and debris-covered (DC) glaciers
Glaciers are classified into clean-ice (CI) and debris-covered (DC) depending upon their composition. Clean-ice glaciers are formed due to accumulation and compaction of seasonal snow cover, whereas DC glaciers are part of glaciers derived from erosion and transportation of debris and generally overlay the clean-ice portion of glaciers. Out of 1941 glaciers, 112 glaciers have both components of CI and DC, and the rest have only CI. The area covered by DC glaciers is more than 13% of the total glacier area in the KSL. The highest area coverage by DC glacier is in the Kali sub-basin, and the lowest is in the West Seti sub-basin. The Manasarovar inland basin consists only of CI glaciers.
The area percentage of DC glaciers has increased from 8.7 to 13.3%, while CI glaciers decreased from 91 to 87% from 1990 to 2020 (Figure 5), with a marked variation in the individual basins. Within this time period, the DC glacier area increased from 6.6 to 9.7% in the Humla-Karnali basin, 11.8 to 17.8% in the Kali basin, and 8.8 to 14.4% in the West Seti basin. Not much change was noticeable in the DC glacier area between 2000 and 2010. The increase in DC and decrease in CI glacier area indicate that glaciers are melting, and exposure of the debris transported along the CI glacier and covering the clean-ice portion. Debris cover on the glacier plays an important role in insulating the glacier from rapid melting [43, 44, 45]. In contrast, a thin layer of debris and dust particles on the surface of glacier ice accelerates the melting of the glaciers.
Figure 5.
Changes in DC and CI glacier area from 1990 to 2020 in KSL.
The CI glaciers maintain a higher slope than DC glaciers. In the KSL, the mean slope of glaciers ranges from 10 to 60 degrees, with a negligible number of glaciers less than 10 degrees and higher than 60 degrees. The mean slope of CI glaciers ranged from 23 to 31 degrees, and DC glaciers from 12 to 13 degrees. The mean slope of CI glaciers in the Kali and West Seti basins was slightly higher and ranged up to 31 degrees, whereas the mean slope of Manasarovar glaciers was only 23 degrees.
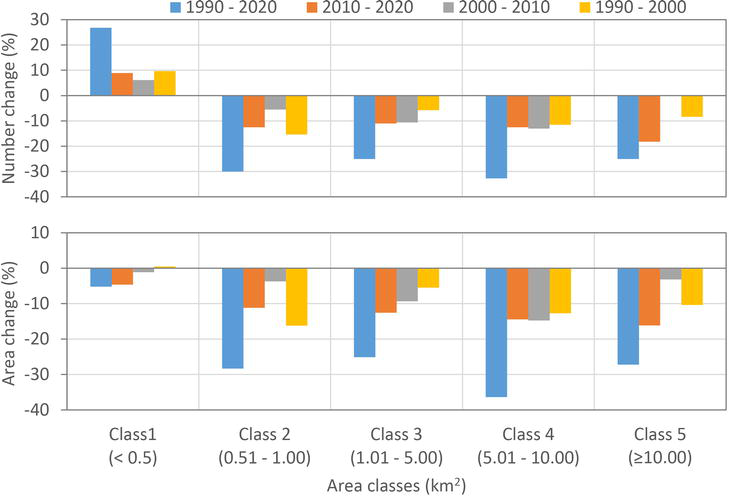
4.3 Distribution and changes in glacier size
The present study mapped glaciers larger than or equal to 0.02 km2. Milam Glacier (G080074E30524N), covering an area of 49.5 km2 in 2020, is the largest glacier in the KSL. It is one of the major sources of the Goriganga River, which is a major tributary of the Kali River. For the analysis, glaciers were divided into five size classes: Class 1 (<0.5 km2), Class 2 (0.05–1 km2), Class 3 (1–5 km2), Class 4 (5–10 km2), and Class 5 (> = 10 km2). The distribution of glaciers in each glacier size class showed an inverse relationship between number and area coverage. The number of glaciers in class 1 was the highest, whereas the area coverage was relatively less compared to other size classes. Almost 77% of glaciers were of size less than 0.5 km2 (Class 1), but they covered only 18.5% of the total glacier area in the KSL. In contrast, class 3 consisted of only 11% of glaciers, covering more than 1/3 (36%) of the glacier area in the KSL. A similar pattern was also observed in each sub-basin in the KSL.
The size of glaciers strongly affected changes in the number and area of glaciers in the region. The shrinkage of larger glaciers fragmented to smaller glaciers was indicated by an increment in the glacier number of class 1 size and a decrease in other size classes (Figure 6). The number of smaller glaciers (Class 1) increased in each decade, whereas larger glacier numbers decreased. However, the glacier area of all size classes decreased in each decade. Comparatively, changes in areas of larger glaciers were higher than in smaller glaciers. The maximum glacier area loss (33%) was in class 4 from 1990 to 2020, and glaciers larger than 10 km2 (class 5) showed a 25% loss in 30 years. The size of the largest glacier in the region also decreased by more than 9% (54.5 km2 in 1990 to 49.5 km2 in 2020).
Figure 6.
Changes in number and area of glaciers in various glacier size.
The mean glacier area also decreased from 0.87 to 0.6 km2 from 1990 to 2020, indicating that the glaciers in the KSL are retreating, shrinking and fragmented, and the retreat rate has significantly increased in recent decades.
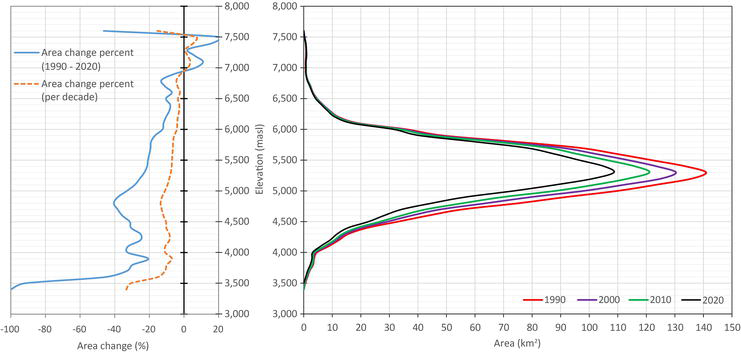
4.4 Terrain characteristics of glaciers and their shrinkage
The glaciers in the landscape were distributed from 3500 to 7650 masl in which the highest elevation glaciers were found in the Humla-Karnali basin and the lowest elevation glaciers from the Kali sub-basin. The glaciers in the Manasarovar basin are distributed in a narrow elevation zone from 5262 to 6717 masl. The hypsographic distribution of glaciers in the region showed that 88% of the glacier area was concentrated within 4500 to 6000 masl elevation, with the highest concentration (more than 40%) between 5000 to 5500 masl (Figure 7).
Figure 7.
Distribution and retreat of glaciers at various elevation zones from 1990 to 2020 in KSL.
Glacier area in all the elevation zones decreased with the maximum glacier area changes at an elevation range from 5000 to 5500 masl (Figure 7). Glacier areas have not changed significantly above 6500 masl and below 4000 masl, although the area percentage change rate showed that the maximum area decrease was below 4000 masl and increased above 7000 masl. The decreased area below 4000 masl indicated the retreat of the glacier terminus and upward shifting of glacier elevation, whereas the increased area in higher elevation was due to permanent snow deposition. However, the glacier area in these elevation ranges was less than 1 km2. Glaciers below 3500 masl disappeared completely from 2010 onward. The lowest elevation of the glacier moved up from 3438 masl in 1990 to 3509 masl in 2000, 3532 masl in 2010, and 3577 in 2020. This indicated that glaciers have retreated by more than 100 m in 30 years.
The lowest-elevation glacier is highly sensitive to temperature, thereby influencing higher rates of ablations. The glacier retreat percent in lower elevations is higher, as shown in Figure 7. The loss percent below 3700 masl is greater than 30% in 30 years, and greater than 25% is at the elevation zone between 4500 and 5100 masl from 1990 to 2020. The area loss percentage at the highest concentration zone from 5000 to 5500 masl ranges from 20 to 40% at each 100 m elevation zone. The loss percent above 5500 masl and below 7000 masl is less than 20% in each 100 m elevation zone. Above 7000 masl, the area has increased by 9 to 20% in each 100 m elevation with an area converging of less than 1 km2.
The slope of the glaciers also plays an important role in glacier retreat. Glaciers cannot exist in slopes greater than 60 degrees. The majority of glaciers in the KSL have mean slopes of 12 to 31 degrees and, most commonly, less than 26 degrees. Most CI glaciers lie in the upper reaches of the glaciers and attain higher mean slopes than DC glaciers. There is a clear demarcation between the mean slopes of CI and DC glaciers. CI glaciers in the KSL have an average slope above 20 degrees (ranging between 22 and 31 degrees), and DC glaciers have an average slope below 15 degrees (ranging between 12 and 13 degrees).
No significant changes were observed in the average slope of the glaciers or in CI and DC glaciers from 1990 to 2020. The distribution and retreat of the glacier area show the highest changes between slopes of 20 and 30 degrees. More than 50% of the total area changes within the 30-year period, as well as in the decadal period, was observed in this average slope range. Similarly, the second highest is from the 10 to 20 average slopes of the glaciers. This indicates that the major retreat rate is in CI glaciers in the region, and debris insulated the melting of clean ice. The number and area of glaciers of average slope range below 10 degrees has increased, indicating glacier fragmentation and shrinkage.
The glacier aspect is another critical factor that affects the melting of glacier ice. The north-facing glaciers experience less incident solar radiation and a less energetic melt regime [46]. The glaciers in KSL are distributed mostly in the southern faces with the highest number of glaciers in the southeast and southwest aspect. The area coverage of glaciers is highest in the southeast and south, indicating that most large glaciers face the southern aspect. Less than 10% of glaciers are in the northern faces, in which 3 percent of glaciers are facing the northern aspect.
The rate of glacier shrinkage is also higher in the southern aspect. More than 27 percent of the total shrinkage area was in the south in the 30-year period. Similarly, more than 21 percent of glaciers have retreated in the southeast and southwest aspects. The glacier shrinkage is significantly less in the northern aspect, with less than 1 percent of total area shrinkage in this region. The shrinkage pattern is similar for all times as well as in all basins.
The present study provides comprehensive information about glacier status and its shrinkage from 1990 to 2020 in the KSL. The study adopted a semi-automatic object-based image classification method to generate the base datasets of glaciers in the KSL. Furthermore, manual intervention on shadow and low contrast difference between the glacier boundary and adjacent terrain along the lateral and distal part of glacier boundary increases the accuracy of glacier boundary. Also, to reduce mapping time and neglect discrepancies in the glacier boundary in each time period, the time series glacier data was prepared by manual editing of base data overlaying on the respective images of the years. The manual editing has some impact on individual glacier area, which is rectified by 2% while smoothing the glacier outlines [13], and the uncertainty of ±1 pixels was considered for the position of its outline. Overall, the dataset was prepared using the same spatial and spectral resolution with a consistent method and approach supported by visual interpretation, which provides reliable information on glacier changes over a 30-year period.
The study supports understanding spatial patterns of glacier characteristics such as glacier area, size, types, and topographic area variation and its changes over time throughout the landscape. The study clearly reveals the rapid shrinkage of glaciers in the landscape, with a loss of 25% of its glacier area in three decades. The decadal glacier change data shows the rate of glacier area loss increased to 1.2% per year between 2010 and 2020 from 0.83% per year between 1990 and 2000, indicating the acceleration of glacier area loss in recent decades. This rate of area loss varies in each basin and on individual glaciers, depending upon its size, type, and topographic positions. The difference between glacier area loss and its size indicates that area loss by smaller glaciers (<0.5 km2) is nominal in comparison to the area loss by bigger glaciers, but comparably, the actual glacier area loss proportion of each smaller glacier is higher. Some small glaciers have disappeared completely, and some have reduced their size to less than the mapping threshold of 0.02 km2, which is not considered in this study. Nearly 5.2% of the glacier area was lost from the glacier size of <0.5 km2 between 1990 and 2020 due to the melting and shrinkage of smaller glaciers influenced by climate change. However, the glacier number has increased by 27% due to the retreat or fragmentation of glaciers larger than 0.5 km2. In contrast, both the number and area of glaciers larger than 0.5 km2 have decreased. This pattern has also been observed in other parts of the region [5, 12, 13, 24, 25], indicating that the number of smaller glaciers will increase in the future with the shrinking and fragmentation of larger glaciers.
The topographic characteristics of the glaciers also show their significant influence on glacier changes. The glacier area loss in the lower elevation zones is distinctive as the lowest elevation of the glacier has moved from 3429 masl in 1990 to 3577 masl in 2020. Glaciers below 3500 masl vanished completely after 2010, and more than 22% of the area was lost at elevations below 4000 masl. However, the surface area loss is very low, below 4000 masl, compared to losses at elevations from 4500 to 5500, which is the highest area loss in all decades. In contrast, the glacier area has slightly increased above 7000 masl, indicating snow accumulation and the formation of permanent ice on mountain slopes. Other topographic characteristics such as slope and aspect also play prominent roles in the existence of glaciers and their area changes. Low-slope glaciers are more susceptible to area changes in response to climate change. In KSL, glacier slopes mainly range up to 50 degrees, with a few portions of glacier area above 50 degrees. Proportionally, area change is higher in high-degree sloped glaciers, whereas the area loss and coverage are higher between 20 and 30 degrees. Similarly, the distribution and area loss is higher in the southern aspect of glaciers.
A reduction in CI glacier area has been observed from 1990 to 2020 as these types of glaciers respond quickly to a warming environment in a shorter period than debris-covered glaciers. The increased area percentage of debris-covered glaciers over 30 years indicated that the landscape has less precipitation and high temperature, which rapidly increased the glacier melting process, thinning the glacier fronts, CI to be exposed to bare rock and/or becoming a part of debris glaciers. Sometimes, a rapid recession can also detach CI from DC because of the steepness of the topography or vertical cliff over which the glacier has been passing. In addition, the pace of recession on DC glaciers can form supraglacial ponds on the surface and expansion of glacial lakes attached to or near the glaciers. This suggests that detailed monitoring is required to better characterize the response of the glaciers to the surroundings in the KSL.
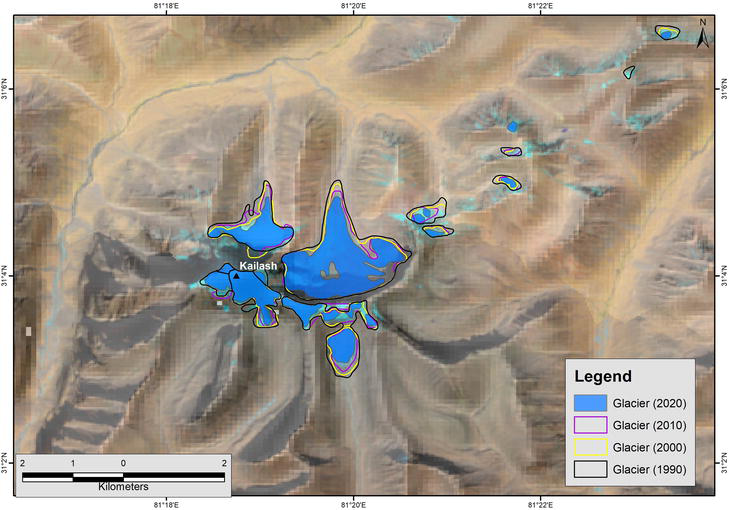
The landscape is also rich in religious and cultural heritage. The Mt. Kailash and adjacent Lake Manasarovar are spiritual focal places for millions of followers of Hinduism, Buddhism, Jainism, Sikhism, and Bon religions [47]. Mount Kailash is covered by a glacier ice cap (Figure 8), which is split into four glaciers based on their hydrological flow. The Polung and Gangjam glaciers in the north and northeast [48] have retreated 25.4 and 35.2% within a 30-year period, respectively. Overall, the glaciers on Mt. Kailash have retreated by 26.7% during the 30-year period. The shrinkage of glaciers in the mountain will expose the underlying rock and reduce the beauty and significance of this sacred mountain peak. Moreover, the Manasarovar Lake is also fed by several glaciers around the valley. Overall, the glacier area around the Manasarovar inland valley decreased by 27% during the study period. The recession of glacier mass, in the long run, will reduce meltwater supply into the lake, which will reduce the size of lakes and other water bodies and impact their water quality [49, 50]. In many religions, particularly Hinduism and Buddhism, water bodies are believed to hold purifying and cleansing powers and are essential for ceremonies and prayers [51]; therefore, changes in water quality and quantity due to glacial changes are likely to have implications on cultural practices associated with water bodies in the landscape.
Figure 8.
Shrinking and retreating glaciers in the Mt. Kailash region from 1990 to 2020.
Shrinkage in glaciers increases uncertainties in water supplies as well as disaster risks, further exacerbating the vulnerability of the mountain communities to climate change, threatening water, food, and energy security in upstream and downstream areas of the landscape. Initially, the rapid melting of glaciers might lead to an increase in glacier melt runoff and the river flow lasting some decades, but with the gradual reduction in glacier mass, the river flow will also decline in the long term [52]. This alteration in the contribution of glacier meltwater to the rivers will have adverse impacts on the ecosystem services, affecting upstream as well as downstream populations [53, 54]. Many hydropower and irrigation systems such as Dhauliganga Hydropower (230 MW) in India, Chameliya Hydropower (30 MW) in Nepal, and many traditional and modern irrigation systems in the upstream and downstream areas of the landscape play an important role in agriculture and food production, will be impacted in the long run.
Rapid glacier recession also increases the formation and expansion of glacial lakes especially below the retreating terminus. This increases the risks of glacial lake outburst flood (GLOF) events, threatening lives, livelihood, and property, including infrastructures and cultural heritage. The recurring GLOF event in the Limi Valley of Humla District in Nepal has threatened the settlement, as well as one of the oldest Buddhist monasteries in the country [32]. Thus, there is an urgent need to take appropriate adaptive and mitigation measures to reduce further acceleration of risks. Though overall trends of decline in glaciers are clear, factors influencing the susceptibility of glaciers to changes, such as type, size, aspect, slope, elevation, proximity to water bodies, and presence of thick or thin layers of debris, vary. Detailed information on these characteristics and variations in response is needed to support accurate projections of future glacier change under different climate scenarios using glacier modeling.
The present datasets of glaciers from 1990 to 2020 revealed that the glaciers have retreated significantly. Due to the shrinking, retreating, and fragmenting of individual glaciers, the number of glaciers had increased, and the area decreased. Overall, the glacier area has decreased by 25.5%, and the number of glaciers has increased by 7.8% (141) over the period of 30 years. The loss in glacier area was only 15% in 20 years from 1990 to 2010, but an additional loss of 11% occurred in 10 years between 2010 and 2020, indicating the recent loss of glaciers was almost double that of the previous decades. Decreases in glacier area accompanied by an increase in the number of glaciers are clear evidence of fragmentation because of uneven shrinkage of individual glaciers. Therefore, the number of smaller glaciers increased, while the glacier area of glaciers of all sizes decreased. Small glaciers and low-elevation glaciers are more sensitive to climate change and melt faster. Some of the smaller glaciers present in 1990 had disappeared by 2010, and so on. However, the retreat rate is higher in lower elevations, and the glaciers below 3500 masl completely disappeared in 2010. The distribution of glacier area and its retreat amount was higher at elevations ranging from 5000 to 5500 masl. Moreover, glaciers on steep slopes facing the southern aspect and frontal parts of the glaciers associated with glacial lakes are retreating faster. The majority of the glaciers in KSL are facing the southern aspect, and the retreat rate of the glaciers in the south, southwest, and southwest aspect is significantly higher (more than 20 percent in SE and around 50% in S and SW).
Separate information for CI and DC glaciers will serve as an important parameter in climate change models. The reduction of CI glacier area by 29 percent and the increment of DC glaciers by 13 percent within 30 years indicates a distinct response to climate warming.
The present study concluded that the glacier system is very complex, and spatial changes vary depending on its topographic setup in terms of altitude, slope, aspect, and composition. However, the study shows that the glaciers in the region are steadily depleting, and its trend of retreat will continue in the future with a changing climate. However, the present increase in the melting of glaciers might enhance economic opportunities and productivity of the region by surplus supply of freshwater for livelihood, agriculture, and hydropower generation. It is also necessary to understand the availability of these water resources, which will be depleted with the reduction of glaciers in the long run. At the same time, some of the glaciers in the region represent cultural sites. Each year, thousands of pilgrims visit these places, which signifies the importance of glaciers. Hence, the systematic monitoring and observed changes must be assessed in the long run, and these data can be utilized for future projections of water resource availability using various climatic and glacio-hydrological models. Also, these datasets are very useful for planning and management of water resources and for disaster risk reduction.
We are indebted to Janita Gurung and Miriam Jackson for their full support in this work. Thank you to the following Tribhuvan University staff – Kabiraj Paudyal & Ramita Bajracharya from the Central Department of Geology, Mamata Sayami & Subash Acharya from the Department of Geology, Trichandra Multiple College, and Anita Tuitui & Earina Sthapit from the Central Department of Hydrology and Meteorology for support during preparation and mapping of glaciers. The study was supported by the Cryosphere intervention (previously Cryosphere initiative) and Kailash Scared Landscape Conservation and Development Initiative in ICIMOD. Landsat data are courtesy of NASA and the USGS. The SRTM elevation model version is courtesy of NASA’s Jet Propulsion Laboratory and was further processed by the Consultative Group for International Agriculture Research. ICIMOD gratefully acknowledges the support of its core donors: the Governments of Afghanistan, Australia, Austria, Bangladesh, Bhutan, China, India, Myanmar, Nepal, Norway, Pakistan, Sweden, and Switzerland.
The views and interpretations in this publication are those of the authors. They are not necessarily attributable to ICIMOD and do not imply the expression of any opinion by ICIMOD concerning the legal status of any country, territory, city, or area of its authority, or concerning the delimitation of its frontiers or boundaries, or the endorsement of any product.
References
1.Drew G. A retreating goddess? Conflicting perceptions of ecological change near the Gangotri-Gaumukh glacier. Journal for the Study of Religion, Nature, and Culture. 2012;6:3. DOI: 10.1558/jsrnc.v6i3.344
2.Knight PG. Glacier: Nature and Culture. London: Reaktion Books; 2019
3.Huss M, Bookhagen B, Huggel C, Jacobsen D, Bradley RS, Clague JJ, et al. Toward mountains without permanent snow and ice. Earth’s Future. 2017;5:418-435. DOI: 10.1002/2016EF000514
4.Tuladhar S, Pasakhala B, Maharjan A, Mishra A. Unravelling the linkages of cryosphere and mountain livelihood systems: A case study of Langtang, Nepal. Advances in Climate Change Research. 2021;12(1):119-131. DOI: 10.1016/j.accre.2020.12.004
5.Bajracharya SR, Maharjan SB, Shrestha F, Guo W, Liu S, Immerzeel W, et al. The glaciers of the Hindu Kush Himalayas: Current status and observed changes from the 1980s to 2010. International Journal of Water Resources Development. 2015;31(2):161-173. DOI: 10.1080/07900627.2015.1005731
6.Armstrong R, Raup B, Khalsa SJS, Barry R, Kargel J, Kieffer H. GLIMS Glacier Database. Boulder CO, USA: National Snow and Ice Data Center; 2011
7.Pfeffer WT, Arendt AA, Bliss A, Bolch T, Cogley JG, Gardner AS, et al. The Randolph consortium. The Randolph glacier inventory: A globally complete inventory of glaciers. Journal of Glaciology. 2014;60(221):537-552. DOI: 10.3189/2014JoG13J176
8.Nuimura T, Sakai A, Taniguchi K, Nagai H, Lamsal D, Tsutaki S, et al. The GAMDAM glacier inventory: A quality-controlled inventory of Asian glaciers. The Cryosphere. 2015;9(3):849-864. DOI: 10.5194/tc-9-849-2015
9.Guo W, Liu S, Xu J, Wu L, Shangguan D, Yao X, et al. The second Chinese glacier inventory: Data, methods, and results. Journal of Glaciology. 2015;61(226):357-372. DOI: 10.3189/2015JoG14J209
10.Jiang S, Nie Y, Liu Q , Wang J, Liu L, Hassan J, et al. Glacier change, supraglacial debris expansion and glacial lake evolution in the Gyirong River basin, Central Himalayas, between 1988 and 2015. Remote Sensing. 2018;10:986
11.Bajracharya SR, Mool PK, Shrestha BR. Impact of Climate Change on Himalayan Glaciers and Glacial Lakes- Case Studies on GLOF and Associated Hazards in Nepal and Bhutan. Kathmandu: ICIMOD; 2007. DOI: 10.53055/ICIMOD.470
12.Bajracharya SR, Maharjan SB, Shrestha F, Bajracharya OR, Baidya S. Glacier status in Nepal and decadal change from 1980 to 2010 based on landsat data. ICIMOD; 2014;2:1-60. DOI: 10.53055/ICIMOD.591
13.Bajracharya SR, Maharjan SB, Shrestha F. The status and decadal change of glaciers in Bhutan from 1980's to 2010 based on the satellite data. Annals of Glaciology. 2014;55(66):159-166. DOI: 10.3189/2014AoG66A125
14.Ives JD, Shrestha RB, Mool PK. Formation of glacial lakes in the Hindu-Kush Himalayas and GLOF risk assessment. ICIMOD. 2010:1-44. DOI: 10.53055/ICIMOD.521
15.Bolch T, Kulkarni A, Kääb A, Huggel C, Paul F, Cogley JG, et al. The state and fate of Himalayan glaciers. Science. 2012;336(6079):310-314. DOI: 10.1126/science.1215828
16.Mernild SH, Lipscomb WH, Bahr DB, Radic V, Zemp M. Global glacier changes: A revised assessment of committed mass losses and sampling uncertainties. The Cryosphere. 2013;7:1565-1577. DOI: 10.5194/tc-7-1565-2013
17.Gardent M, Rabatel A, Dedieu JP, Deline P. Multitemporal glacier inventory of the French Alps from the late 1960s to the late 2000s. Global and Planetary Change. 2014;120:24-37. DOI: 10.1016/j.gloplacha.2014.05.004
18.Wester P, Mishra A, Mukherji A, Shrestha AB. The Hindu Kush Himalaya Assessment—Mountains, Climate Change, Sustainability and People. Cham: Springer Nature Switzerland AG; 2019
19.IPCC. The Physical Basis: Contribution of Working Group I to the Fifth Assessment Report of the Intergovernmental Panel on Climate Change. Cambridge, UK; New York, NY, USA: IPCC; 2013
20.Kraaijenbrink P, Bierkens M, Lutz A, Immerzeel WW. Impact of a global temperature rise of 1.5 degrees Celsius on Asia’s glaciers. Nature. 2017;549:257-260. DOI: 10.1038/nature23878
21.Bolch T, Pieczonka T, Benn DI. Multi-decadal mass loss of glaciers in the Everest area (Nepal Himalaya) derived from stereo imagery. The Cryosphere. 2011;5:349-358. DOI: 10.5194/tc-5-349-2011
22.Yao TD, Thompson L, Yang W, Yu WS, Gao Y, Guo XJ, et al. Different glacier status with atmospheric circulations in Tibetan plateau and surrounding. Nature Climate Change. 2012;2:663-667. DOI: 10.1038/NCLIMATE1580
23.Xiang Y, Gao Y, Yao T. Glacier change in the Poiqu River basin inferred from Landsat data from 1975 to 2010. Quaternary International. 2014;349:393-401. DOI: 10.1016/j.quaint.2014.03
24.Maharjan SB, Shrestha F, Azizi F, Joya E, Bajracharya B, Bromand MT, et al. Monitoring of glaciers and Glacial Lakes in Afghanistan. In: Bajracharya B, Thapa RB, Matin MA, editors. Earth Observation Science and Applications for Risk Reduction and Enhanced Resilience in Hindu Kush Himalaya Region. Cham: Springer; 2021. DOI: 10.1007/978-3-030-73569-2_11
25.Maharjan SB, Joya E, Rahimi MM, Azizi F, Muzafari KA, Bariz M, et al. Glaciers in Afghanistan: Status and changes from 1990 to 2015. Research Report. ICIMOD and NWARA. 2021. DOI: 10.53055/ICIMOD.784.
26.Maurer JM, Schaefer JM, Rupper S, Corley A. Acceleration of ice loss across the Himalayas over the past 40 years. Science Advances. 2019;5:6. DOI: 10.1126/sciadv.aav7266
27.Bhambri R, Bolch T, Kawishwar P, Dobhal DP, Srivastava D, Pratap B. Heterogeneity in glacier response in the upper Shyok valley, Northeast Karakoram. The Cryosphere. 2013;7(5):1385-1398. DOI: 10.5194/tc-7-1385-2013
28.Minora U, Bocchiola D, D’Agata C, Maragno D, Mayer C, Lambrecht A, et al. Glacier area stability in the Central Karakoram National Park (Pakistan) in 2001-2010: The “Karakoram anomaly” in the spotlight. Progress in Physical Geography: Earth and Environment. 2016;40(5):629-660. DOI: 10.1177/0309133316643926
29.Bolch T, Buchroithner M, Pieczonka T, Kunert A. Planimetric and volumetric glacier changes in the Khumbu Himal, Nepal, since 1962 using Corona, Landsat TM and ASTER data. Journal of Glaciology. 2008;54(187):592-600. DOI: 10.3189/002214308786570782
30.Azam MF, Wagnon P, Berthier E, Vincent C, Fujita K, Kargel JS. Review of the status and mass changes of Himalayan-Karakoram glaciers. Journal of Glaciology. 2018;64:61-74. DOI: 10.1017/jog.2017.86
31.Lamsal D, Sawagaki T, Watanabe T. Digital terrain modelling using Corona and ALOS PRISM data to investigate the distal part of Imja glacier, Khumbu Himal, Nepal. Journal of Mountain Science. 2011;8:390-402. DOI: 10.1007/s11629-011-2064-0
32.Kropáček J, Neckel N, Tyrna B, Holzer N, Hovden A, Gourmelen N, et al. Repeated glacial lake outburst flood threatening the oldest Buddhist monastery in North-Western Nepal. Natural Hazards and Earth System Sciences. 2015;15(10):2425-2437. DOI: 10.5194/nhess-15-2425-2015
33.Jha LK, Khare K. Glacial Lake outburst flood (GLOF) study of Dhauliganga basin in the Himalaya. Peter Christian Speldewinde (reviewing editor) cogent. Environmental Science. 2016;2:1-13. DOI: 10.1080/23311843.2016.1249107
34.Zomer RJ, Trabucco A, Metzger M, Oli KP. Environmental stratification of Kailash sacred landscape and projected climate change impacts on ecosystems and productivity. In: ICIMOD Working Paper, ICIMOD. 2013. p. 1. DOI: 10.53055/ICIMOD.578
35.ICIMOD. Transboundary Landscapes: Kailash Sacred Landscape Conservation and Development Initiative. 2020. Available from: https://www.icimod.org/initiative/ksl
36.Bajracharya SR, Shrestha B. The Status of Glaciers in the Hindu Kush-Himalayan Region. Kathmandu: ICIMOD; 2011. DOI: 10.53055/ICIMOD.551
37.Maharjan SB, Shrestha F, Bajracharya SR. Training manual on application of remote sensing and geographic information systems for mapping and monitoring of glaciers, introduction to geographic systems (GIS) and ArcGIS. ICIMOD Manual. 2017/11. DOI: 10.53055/ICIMOD.702
38.Bajracharya SR, Maharjan SB, Shrestha F. Training manual on application of remote sensing and geographic information systems for mapping and monitoring of glaciers using eCognition software. ICIMOD Manual. 2017/10. DOI: 10.53055/ICIMOD.701
39.Stokes CR, Shahgedanova M, Evans IS, Popovnin VV. Accelerated loss of alpine glaciers in the Kodar Mountains, South-Eastern Siberia. Global and Planetary Change. 2013;101:82-96. DOI: 10.1016/j.gloplacha.2012.12.010
40.DeBeer CM, Sharp MJ. Recent changes in glacier area and volume within the southern Canadian cordillera. Annals of Glaciology. 2007;46:215-221. DOI: 10.3189/172756407782871710
41.Bolch T, Menounos B, Wheate R. Landsat-based inventory of glaciers in western Canada, 1985-2005. Remote Sensing of Environment. 2010;114(1):127-137. DOI: 10.1016/j.rse.2009.08.015
42.Frey H, Paul F, Strozzi T. Compilation of a glacier inventory for the western Himalayas from satellite data: Methods, challenges, and results. Remote Sensing of Environment. 2012;124:832-843. DOI: 10.1016/j.rse.2012.06.020
43.Mattson LE, Gardner JS, Young GJ. Ablation on debris covered glaciers: An example from the Rakhiot glacier, Panjab, Himalaya. In: Snow and Glacier Hydrology (Proceeding of the Kathmandu Symposium, November 1992). Vol. 218. IAHS Publication; 1993
44.Reznicheko N, Davies T, Shulmeister J, McSaveney M. Effects of debris on ice-surface melting rates: An experiment study. Journal of Glaciology. 2010;56(197). DOI: 10.3189/002214310792447725
45.Immerzeel WW, Kraaijenbrink PDA, Shea JM, Shrestha AB, Pellicciotti F, Bierkens MFP, et al. High resolution monitoring of Himalayan glacier dynamics using unmanned aerial vehicles. Remote Sensing Environment. 2014;150:93-103. DOI: 10.1016/j.rse.2014.04.025
46.Marshall S, White E. Alberta Glacier Inventory and Ice Volume Estimation. Canmore: Crowfoot Ice Research and Consulting; 2010. Available from: https://albertawater.com/dmdocuments/01_2010_12_Alberta_Glacier_Inventory_and_Ice_Volume_Estimation_Marshall_et_al%20(15).pdf
47.Pandey A, Kotru R, Pradhan N. Kailash sacred landscape: Bridging cultural heritage, conservation, and development through a transboundary landscape approach. In: Verschuuren B, Furuta N, editors. Asian Sacred Natural Sites. Routledge; 2016. pp. 145-158
48.Juyal N, Thakkar PS, Sundriyal YP. Geomorphic evidence of glaciation around mount Kailash (inner Kora): Implication to past climate. Current Science. 2011;100(4) http://www.jstor.org/stable/24073091
49.Sharma BM, Nizzetto L, Bharat GK, Tayal S, Melymuk L, Sanka O, et al. Melting Himalayan glaciers contaminated by legacy atmospheric depositions are important sources of PCBs and high-molecular-weight PAHs for the Ganges floodplain during dry periods. Environmental Pollution. 2015;206:588-596. DOI: 10.1016/j.envpol.2015.08.012
50.Sun X, Wang K, Kang S, Guo J, Zhang G, Huang J, et al. The role of melting alpine glaciers in mercury export and transport: An intensive sampling campaign in the Qugaqie basin, inland Tibetan plateau. Environmental Pollution. 2017;220:936-945. DOI: 10.1016/j.envpol.2016.10.079
51.Singh RPB. Water symbolism and sacred landscape in Hinduism: A study of Benares (Varasani). Erdkunde. 1994;48(3):210-227. DOI: 10.3112/erdkunde.1994.03.05
52.IPCC. Climate change 2014- impact, adaptation and vulnerability. In: Part B: Regional Aspects. Contribution of Working Group II to the Fifth Assessment Report of the Intergovernmental Panel on Climate Change. IPCC: Cambridge Univ. Press, USA; 2014
53.Milner AJ, Kahmis K, Battin TJ, Brittain JE, Barrand NE, Fureder L, et al. Glacier shrinkage driving global changes in downstream systems. Proceedings of the National Academy of Sciences of the United States of America. 2017;114:9770-9778
54.Mukherji A, Sinisalo A, Nüsser M, Garrard R, Eriksson M. Contributions of the cryosphere to high mountain communities of the Hindu Kush Himalaya: A review. Regional Environmental Management. 2019:127-154, 211-245. DOI: 10.1007/s10113-019-01484-w
Written By
Sudan Bikash Maharjan, Tenzing Choyal Sherpa, Finu Shrestha and Binaya Pasakhala
Submitted: 19 January 2024Reviewed: 20 January 2024Published: 03 April 2024