
Abstract
This chapter summarizes proposals to expand the capabilities of lidar measurements of the Earth’s atmosphere as a structural stratified medium with complex thermodynamics. The generalized structure of the revealed, statistically stable horizontal optical inhomogeneities of the surface layer and their dynamics are taken as an informative indicator of the thermodynamic stability of the atmosphere in the zone even beyond the limits of measurements. A special statistical method for analyzing the two identified structures is used. It is based on the separate fixation and statistical averaging of the intervals between local maxima and minima of the lidar backscattering signal and the analysis of the time dynamics of such an interval component of the signal during the night, under anticyclone conditions. It assumed that this approach makes it possible to identify certain statistically stable structures of atmospheric inhomogeneities of varying connectivity, depending on the overall thermodynamic stability of the atmosphere. In addition, a specific method is tested to search for emerging and temporarily stable anomalies of such a structure of atmospheric inhomogeneities, but associated with a violation of the thermodynamic stability of the atmosphere. Such a filtration method (identification of a certain anomaly against the background of an extended organized structure of inhomogeneities) showed high efficiency in model experiments compared to standard filtration methods.
Keywords
- lidar measurements
- atmosphere
- optical inhomogeneities
- structure
- signs of organization
- thermodynamic stability
- anomaly
- backscattering signal
- sampling
- temporal organization of radiation and registration
1. Introduction
Classical lidar measurements of the atmosphere assumed obtaining information about the properties of the medium by recording and special processing of the backscattering signal, usually in the photon counting mode. The received signal assumes its digitization and sampling with a given constant resolution. As a result, we get a certain sequence of numeric values that are used in subsequent processing to restore the properties of the medium based on such a signal [1, 2]. This approach to the organization of measurements grew out of laboratory experiments conducted in an environment with stable properties and stable thermodynamics. This standard technology for measuring and processing the received signal leads to an exponential increase in technical problems when trying to develop such an approach. These difficulties led to a reorientation of lidar systems to create models and maps of objects based on a signal directly reflected from the underlying surface. The purpose of the research is to find ways to circumvent the identified problems for the further development of lidar measurements of atmospheric properties directly, to increase their effectiveness by revising the temporary organization of sampling and digitization of the received signal and reorientation to more effective and informative research directions. The complex of ideas was formed by 1989.
One of such directions is the study of the processes of formation of the structure of optical inhomogeneities in the atmosphere. Under certain conditions, the atmosphere is a stratified medium in which the so-called internal gravitational waves arise and propagate [3, 4, 5]. The sources are: flows over an inhomogeneous surface, local jumps in the thermodynamic characteristics of the medium (on medium seals, on atmospheric fronts, on sources of turbulence in the boundary layer above the surface, during convection under the temperature inversion layer. Favorable conditions for the formation of such structures arise in the surface layer, especially at night, in anticyclone conditions.
In the presence of surface temperature inversion and extended fields of polluting urban aerosol, at the boundaries of stratification layers, the amplitude of internal waves increases, becoming longer than the wavelength, which leads to loss of stability and collapse of waves. The potential energy of the wave is used to mix the medium in the collapse zone, which leads to the formation of turbulent spots of relative uniformity in density. Moreover, they have sharp boundaries and a long scattering time (scattering velocity ~ 10 cm/s). Stable stratification of the medium helps to suppress turbulence in the flow, but in such spots it exists for a long time. This helps to retain a relatively coarse aerosol in such spots, which usually settles under the influence of gravity, which leads to intense light scattering on such structures. The degree of scattering increases with increasing power of the turbulent structure and with the concentration of the polluting aerosol, which serves as a kind of “developer” of the structure of inhomogeneities.
Indeed, visual [6], radar [7, 8], radiometric [9], lidar [10, 11, 12, 13], and radar [14, 15] measurements indicate the presence of similar ordered structures in the atmosphere. In some cases, their length in the horizontal plane reaches tens or even hundreds of kilometers. The time of their existence varies from seconds (for small-sized structures), minutes, to several hours. The size of the registered formations for the surface layer varies from meters to hundreds of meters, and their contrast varies accordingly from percent to tens of percent. A certain condition for the stability of these ordered structures is the stability of the vertical stratification of the medium, which in this case can be maintained in time intervals from several minutes to several days. However, the existing data only allow us to state the existence of a connection, without specifying the conditions of its existence, due to the low efficiency and insufficient information content of the measurements carried out. Local measurements at a limited number of points do not allow us to specify the nature and features of the relationship of the structure of inhomogeneities of atmospheric formations with the meteorological situation and its stability. The assumption that variations in the power of the scattering signal are determined by fluctuations in the attenuation coefficient of backscattered radiation associated with fluctuations in aerosol density in turbulent structures is confirmed by a whole set of data [5, 6, 16, 17]. This suggests the prospects of using lidar systems for this type of tasks, with a certain agreement between the properties of the equipment and the medium under study.
2. Formulation of the problems
By now, the energy growth of lidar systems is achieved with a significant increase in weight, dimensions and a clear violation of environmental safety. With the radiation energy unchanged, a decrease in the measurement error is accompanied by a deterioration in the spatial resolution along the sounding path. Increasing the accuracy of measurements has limitations due to the temporal variability of the medium itself. Under these conditions, attempts to reduce the measurement error of the signal by increasing the signal registration gate or by accumulating the signal in a series of measurements are blocked by a concomitant deterioration in spatial and temporal resolution. Such limitations are caused by a number of implicit contradictions present in the technologies of remote measurement and processing of the obtained results, which have escaped the attention of researchers.
2.1 Conflict 1
The confrontation between the zone of ongoing large-scale processes under study and the desire for hardware sampling of the incoming signal with increasing resolution. This excludes the assumption of the medium as a coherent whole formation, with obviously complex thermodynamics, and reduces the entire analysis of the properties of a specific, virtually isolated point of the medium (in the extreme case).
2.2 Conflict 2
The confrontation between the requirement to increase the required energy of the pulsed laser used, to increase both the measurement range and the spatiotemporal resolution of the recorded signal while reducing the environmental safety of the measurements. The harmful effects on natural processes are increasing and the danger of irreversible effects on humans and wildlife is increasing.
2.3 Conflict 3
The confrontation between the orientation to measuring the properties of the medium at a point and volumetric thermodynamic processes that affect the overall organization and stability of the spatial and temporal structure of the inhomogeneities of the medium.
2.4 Conflict 4
The confrontation between the need to smooth out signal changes caused by the structure of its inhomogeneities, background noise, and the need to amplify signal changes caused by the appearance of abnormal inhomogeneity in the medium (not peculiar to its equilibrium state).
3. Overcoming technologies
3.1 Technology 1
Overcoming the
Moreover, the length of the route corresponds to the zone of single signal scattering and provides a signal-to-noise ratio of at least the selected one in each sample, and the noise consists of external illumination and internal noise of the equipment itself. Similarly, the second sequence of counts of the far half of the route is formed by forming an initial count from the scattering signal of the probing signal from the far half of the route (Figure 1).
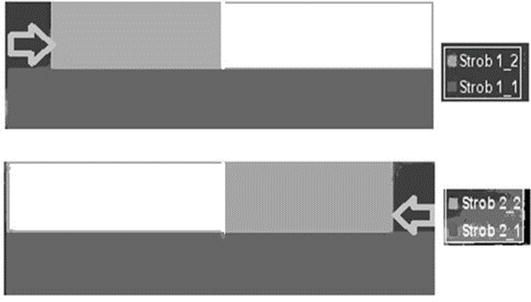
Figure 1.
The principle of the temporary organization of double (counter) discretization of samples of the backscattered lidar signal.
The rationale for the chosen discretization is based on numerical simulations based on real measurements with a constant sampling step carried out in the laboratory of condensed matter at the Belarusian State University [3, 4, 5]. The results of such a comparative experiment [6] are shown in the Figure 2.
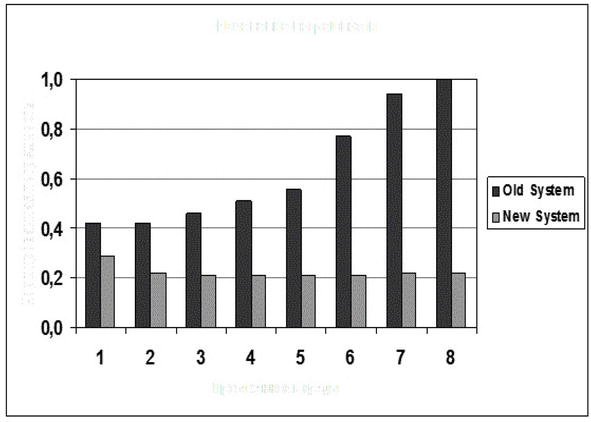
Figure 2.
The dependence of the normalized measurement error on the length of the measurement zone for registration gates or pulses of probing radiation commensurate with the length of the measurement zone (
The presented graph is illustrative. Eight measurement error values are given, normalized for the error at the end of the selected sounding route for the old system, with a characteristic atmospheric attenuation coefficient of 0.3 km-1 and a uniform step along the route. The specific quantitative characteristics of such modeling are presented in detail in Refs. [17, 18].
For the proposed sampling technology of the incoming signal, the error varies slightly from strobe to strobe over most of the route, which makes it possible to reduce hardware requirements due to the small dynamic range of the recorded signal.
The restoration of the characteristics of the medium with the required resolution is achieved by sequentially comparing neighboring pairs of samples having a constant initial (final) boundary of each sample and differing in the final boundaries for the selected sampling step (see Figure 1).
The simulation results showed that the proposed measurement scheme makes it possible to carry out measurements at a high level of daytime illumination conditions, while maintaining an error in the range of ~1 … 10% [19]. In addition, the approach used makes it possible to shift the task of improving measurement accuracy from an area related to the environment to an area related only to hardware capabilities, to an area more subject to control.
3.2 Technology 2
Overcoming the
3.3 Technology 3
Overcoming the
Lidar studies of the atmosphere at night in the surface layer under conditions of a fairly stable anticyclone [19] have shown that the structure of horizontal optical inhomogeneities is quite regular [22, 23]. In some cases, this is clearly observed as the collapse of so-called internal waves (such as Kelvin-Helmholtz waves). A clear example of this situation is presented below (Figure 3).
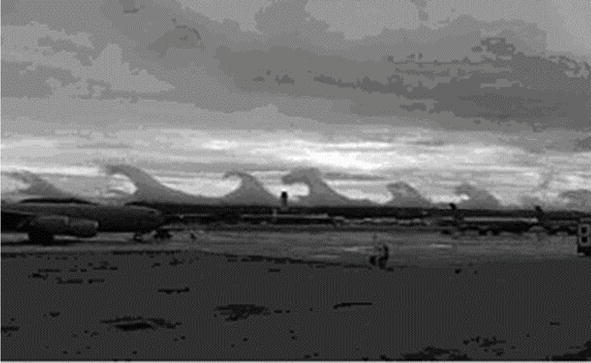
Figure 3.
Clouds along the horizon in Birmingham, Alabama, December 16, 2011 (image credit: ABC 33/40 in Birmingham).
Lidar sensing makes it possible to register a backscattering signal from the atmosphere as the radiation pulse passes through the selected sensing path. Subsequent processing of such a signal using a special technique allows us to uniquely correlate the structure of the transformed signal with the structure of atmospheric inhomogeneities [24]. The complex nature of such structures and their dynamics forced us to abandon the initial harmonic analysis, exclude the amplitude characteristic of the signal from consideration and switch to an independent analysis of the intervals between local maxima or minima of the transformed signal using statistical analysis. Previously, a model experiment was conducted in which the harmonic signal was distorted in a certain way. In harmonic analysis, such distortions appear as a weak expansion of the peak of the corresponding correlation function (when compared with an accurate sine wave). In our case, such distortion manifests itself as a clear additional peak, which indicates a high probability of detecting such distortions in a fairly simple way (Figure 4).
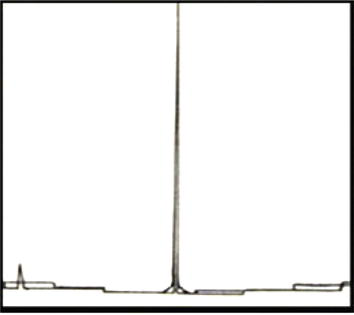
Figure 4.
Normalized cross-correlation function of power spectra or time interval distributions between signal extremes for accurate and distorted sinusoids, respectively (numerical simulation).
In the case of processing real lidar signals, the ultimate goal was to obtain a model in the form of a generalized interval structure of inhomogeneities [11, 12]. The mathematical expectations of the
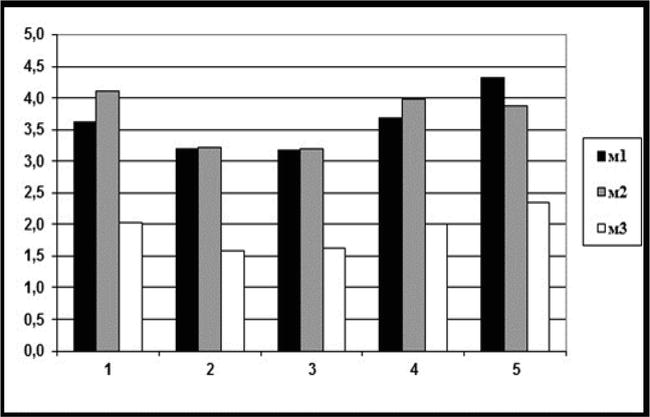
Figure 5.
The results of determining the generalized interval between the elements of the structure of different types (
As can be seen, there is a changing difference between the “positive” (
3.4 Technology 4
Overcoming the
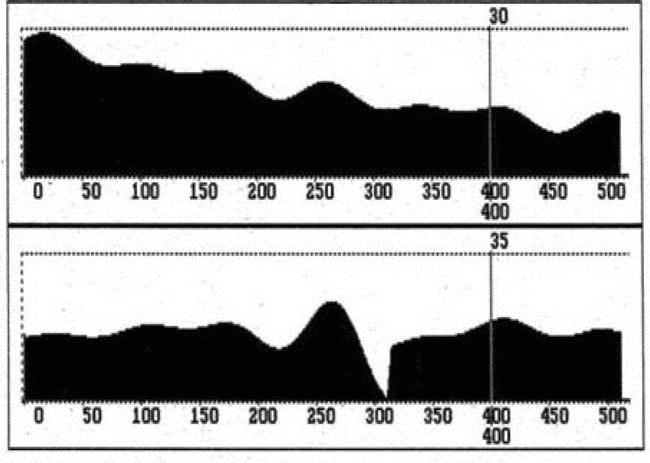
Figure 6.
A model signal with an introduced difference at the noise level and an imposed structure (upper graph) and filtering results revealing such a drop (lower graph), where the ordinate axis is the magnitude of the signal, and the abscissa axis is the number of samples.
Filtration allows you to clearly identify the boundary of the difference. The signal after the drop exceeds the original value. In this case, linear and median filtering are not effective and do not allow identifying the introduced drop in the model signal (Figure 7).
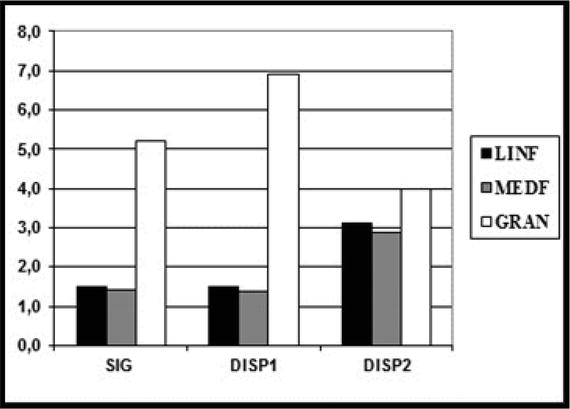
Figure 7.
Results of comparison of the proposed processing of the incoming scattering signal (nonlinear filtering—GRAN) with linear and median filtering methods (LINF, MEDF). DISP1, DISP2—dispersion before and after the introduced signal difference, SIG1, 2, 3—signals at the ratio between the maximum value, drop and noise: 10:1:1; 10:1:5; 10:1:10, respectively.
It should be expected that the transition from an anticyclone-type situation to a cyclone will cause a significant transformation of the structure of heterogeneities, even before the appearance of obvious thermodynamic signs of such a transition. The conducted studies suggest that the occurrence of thermodynamic instability of the atmosphere, even outside the observation zone, leads to a proactive sharp violation of the stability of the structure of optical heterogeneities of the atmosphere, long before a visible significant change in the situation in the observation zone. Predictors of such a change may be some kind of soliton-type anomalies and can be clearly identified by the described filtering.
3.5 Technology 5
One of the visual options for representing a meteorological situation may be the creation of a generalized model structure of inhomogeneities (based on the results of a large-scale array of real measurements) as a basis for creating a visual image of a developing nonlinear process in a continuous environment, as an integral object.
A structure such as the surface of a model material (similar to the structure of a hologram) can be used as a holographic visual image of the process. The final stage of the proposed technology may be the use of information about the unit cell of the structure of inhomogeneities to create a kind of model of the surface of the material with a structure similar to that of a hologram. The dynamics of the generated holographic images of the structure of inhomogeneities will allow us to visualize the process of changing the stability of the situation. The more catastrophic the change, the more complex the recorded structure and the formed holographic image acquires greater clarity. You can even use the symbolic name of such an image - “Smile of the Devil”. His “facial expressions” will allow, without going into complex mathematical operations, to quickly fix the degree of catastrophism of developing processes. One of the visual options for representing the meteorological situation may be the creation of a generalized model structure of heterogeneities (based on the results of a volumetric array of real measurements) as a basis for creating a visual image of a developing nonlinear process in a continuous environment, as an integral entity.
4. Conclusion
The proposed set of technologies for measuring, recording, and processing remote measurements makes it possible to create lidar sensors for monitoring the stability of a meteorological situation and use them in a network of standard weather stations.
Such technologies are applicable for a wide range of tasks for processing noise-like signals from various continuous media, where it is possible to relate the complexity of the structure of heterogeneities to the “thermodynamic” stability of the situation, for example, in the banking sector or sociological research.
References
- 1.
Vladimirovich ZV. Lidar Control of the Stratosphere. Novosibirsk: Ross. Acad. Sci. Sib. Department Institute of Atmospheric Optics; 2004. 306 p - 2.
Bezrukova NA, Chernokulsky AV, Izvestiya RAS. Russian studies of clouds and precipitation in 2015-2018. Physics of Atmosphere and Ocean. 2020; 56 (4):397-417. DOI: 10.31857/S0002351520040021 - 3.
Gossard E, Hook W. Waves in the Atmosphere, Mir, 1978. 532 p - 4.
Lighthill D. Waves in Liquids. Mir, 1981. 598 p - 5.
Barenblatt GI, Monin AS. On the possible mechanism of the phenomenon of discoid formations in the atmosphere. Doklady USSR Academy of Sciences. 1979; 246 (4):834-837 - 6.
Grechko GM, Gurvich AS, Romenenko YV. The structure of density inhomogeneities in the stratosphere according to observations from the Salyut 6 orbital station. Izvestia of the USSR Academy of Sciences, FAO. 1980; 16 (4):339-344 - 7.
Gjssard EE, Richer JH. View of internal waves of limited amplitude as measured by high-resolution radar. Journal of the Atmospheric Sciences. 1970; 27 :971-973 - 8.
Philip MT, Kent GS. Short-period temporal variations of the atmospheric aerosol layer. In: 9-th Int. Laser Nadar Conf. Laser Atmos. Stud; Munich. 1979. pp. 161-162 - 9.
Jonson WB, Evans WE. Lidar measurements of the diffusion of plumes from high pipes. In: 3-rd Conference on Laser Radar Studies of Atmosphere Conference Abstracts; Jamaica. 1970. p. 12 - 10.
Voevodin YM, Zadde GO, Matvienko GG, Samokhvalov IV. Spatial inhomogeneities of the backscattering coefficient according to lidar sensing data. In: Issues of Laser Sensing of the Atmosphere. Nauka; 1976. pp. 45-53 - 11.
Werner C. Lidar measurement of atmospheric aerosol as a function of relative humidity. Opto-Electronics. 1972; 4 (2):125-132 - 12.
Voevodin YM, Zadde GO, Matvienko GG, Samokhvalov IV. Investigation of aerosol statistical characteristics based on laser sensing data. In: XI All-Union Conference on the propagation of Radio Waves. Tez. dokl., part II; Kazan. 1975. pp. 116-118 - 13.
Golev IN, Parfenov OP, Kaprielov VN, Ivlev IK. Lidar observations of internal gravitational waves. Doklady Bolgarskoj Akademii Nauk. 1986; 39 (1):43-46 - 14.
Kalistratova MA, Nesterova TN, Petenko IV, Smirnov AS, Time NS, Shurygina EA. Measurement of statistical characteristics of an echo signal during acoustic sounding of the atmosphere. Izvestia of the USSR Academy of Sciences, FAO. 1986; 22 (9):987-990 - 15.
Kalistratova MA, Petenko IV, Shurygin EA. Sodar studies of the wind velocity field in the lower troposphere. Izvestia of the USSR Academy of Sciences, FAO. 1987; 23 (5):451-461 - 16.
Goldshtik MA, Stern VN. Structural turbulence in dissipative systems. Preprint 47-81. Novosibirsk; 1981. 47 p - 17.
Polkanov YA. Identification of Self-Organization Processes of Continuous Medium Inhomogeneities. Using the Example of Lidar Measurements of the Atmosphere. LAP Lambert Academic Publishing; 2012 - 18.
Polkanov YA. Looking at remote sensing the timing of an organisation’s point of view and the anticipation of today’s problems. In: Remote Sensing of Planet Earth. Yann Chemin Publisher; 2012. Available from: https://www.intechopen.com/chapters/27100 - 19.
Polkanov YA. The possibility of improving the accuracy of the measurement of a light-scattering signal in the atmosphere. Radiotekhnika i Elektronika. 1988; 33 :2599-2603. Available from:http://adsabs.harvard.edu/abs/1988RaEl…33.2599P - 20.
Polkanov YA. Sounding of the environment by means of the un-impulse of the low-power continuous source. In: Singh UN, Pappalardo G, editors. Proceedings of SPIE – Volume 6750 Lidar Technologies, Techniques, and Measurements for Atmospheric Remote Sensing III. 2007 - 21.
Polkanov YA. Remote sensing of the self-organizing systems by dark. Pulse International Journal of Remote Sensing Applications. 2012; 2 (3). Available from:https://issuu.com/sep2011--now/docs/ijrsa10050-20120926-105928-6154-242 - 22.
Polkanov YA. Regularity of the structure of the heterogeneities in the scattering of optical radiation and their connection with meteorological parameters. Proceedings of the USSR Academy of Sciences. Physics of the Atmosphere and Ocean. 1985; 21 (7):720-726 - 23.
Polkanov YA. On the timing of the signal to the structure of the inhomogeneity of an extended medium. Electronic Periodic Peer-Reviewed Scientific Journal. 2022; 110 :63. Available from:https://sci-article.ru/stat.php?i=1666770216 - 24.
Polkanov YA, Kudinov VN. One possibility of analyzing the periodic structure of a complex signal. News from universities. Instrumentation. 1989; 32 (4):6-11 - 25.
Polkanov YA. Dynamics of the structure of the scattering signal and its connection with the weather situation. Proceedings of the USSR Academy of Sciences. Physics of the Atmosphere and Ocean. 1989; 25 (6):599-603 - 26.
Polkanov YA. Structural-statistical frequency analysis of time series. Electronic Periodic Peer-Reviewed Scientific Journal. 2022; 110 :22. Available from:https://sci-article.ru/stat.php?i=1665135403 - 27.
Polkanov YA. Consistency of changes in the structure of optical inhomogeneities of the atmosphere and a set of meteorological parameters. Meteorology and Hydrology. 1991; 3 :39-48. Available from:http://cat.inist.fr/?aModele=afficheN&cpsidt=5237241 - 28.
Polkanov YA. A method for determining the position of optical inhomogeneity of the atmosphere. Auto. USSR certificate N1448907, class. G01W1/00 dated 06/01/86, publ. 09/01/88 - 29.
Polkanov YA. One possibility of identifying anomalous heterogeneity of the atmosphere (nonlinear filtering method). Optics of the Atmosphere and Ocean. 1992; 5 (7):720-772