Open Access is an initiative that aims to make scientific research freely available to all. To date our community has made over 100 million downloads. It’s based on principles of collaboration, unobstructed discovery, and, most importantly, scientific progression. As PhD students, we found it difficult to access the research we needed, so we decided to create a new Open Access publisher that levels the playing field for scientists across the world. How? By making research easy to access, and puts the academic needs of the researchers before the business interests of publishers.
We are a community of more than 103,000 authors and editors from 3,291 institutions spanning 160 countries, including Nobel Prize winners and some of the world’s most-cited researchers. Publishing on IntechOpen allows authors to earn citations and find new collaborators, meaning more people see your work not only from your own field of study, but from other related fields too.
The present study systematically explores the impact of variations in heating temperature and pH levels on the electrochromic features of electrodeposited TiO2 thin films. Notably, a TiO2 film prepared in an acidic medium and annealed at 450°C demonstrated exceptional EC properties. It exhibited a high transmission modulation of 17.18%, an impressive coloration efficiency of 58.8 cm2/C, and rapid switching kinetics. These results highlight the significance of optimizing synthesis conditions for TiO2 thin films to enhance their electrochromic performance. The findings of this research contribute valuable insights into tailoring the electrochromic behavior of TiO2, emphasizing the importance of pH and annealing temperature in achieving enhanced EC properties. The identified optimal conditions for TiO2 thin films open new avenues for the development of efficient and cost-effective electrochromic materials. This research advances the understanding of TiO2’s electrochromic capabilities and provides a promising candidate for diverse electrochromic applications, thereby expanding the potential impact of electrochromism in various technological fields.
The Institute of Science, Dr Homi Bhabha State University, Mumbai, India
Anamika Vitthal Kadam*
The Institute of Science, Dr Homi Bhabha State University, Mumbai, India
*Address all correspondence to: anamiak@iscm.ac.in
1. Introduction
Electrochromism, a fascinating energy conversion phenomenon, has captured the attention of researchers due to its potential applications in diverse fields, including displays, smart windows, antiglare mirrors, and encryption devices [1, 2, 3, 4]. It involves the adoption of innovative strategies to reduce energy consumption in buildings, particularly through advanced window technologies, presents significant opportunities. Among these advancements, electrochromism-based smart windows have been developed and utilized in specialized markets for several decades. These windows possess the capability to modify their optical characteristics, such as transmittance and reflectance, with the application of minimal voltage. This distinct feature empowers them to effectively manage solar heat gain, contributing to the establishment of a comfortable indoor environment while optimizing energy utilization [1, 2, 3, 4]. The applications of electrochromism-based smart windows are extensive, ranging from automotive and mass transportation to skylights and displays [1, 2, 3, 4]. Importantly, the integration of these windows can result in substantial energy savings for buildings. Reports suggest potential reductions of up to 25% in heating and cooling energy consumption, a 50% decrease in lighting energy needs, and a 30–40% decrease in peak power demand [1, 2, 3, 4]. Beyond their energy-efficient attributes, these windows also afford privacy protection for occupants [1, 2, 3, 4]. The adaptability and demonstrated advantages of electrochromism-based smart windows emphasize their increasing popularity and underscore their pivotal role in advancing sustainable and energy-efficient building technologies across diverse sectors.
It involves the manipulation of electronic bands within chromic materials by an external electric field, resulting in a discernible change in their position and intensity. This change in electronic bands primarily arises from variations in the dipole moment of electronic excitation, with transition polarizability responsible for shifts in intensity [5]. Chromic materials are typically categorized into various assemblies: conducting polymers, small organic molecules, and inorganic metal oxides [6, 7, 8]. These EC sources play a crucial role in modulating solar energy entering buildings, contributing to energy conservation by minimizing heating and cooling requirements [9]. Among these materials, TiO2 has garnered significant attention owing to its non-toxic nature, durability, price-effectiveness, high electrochemical stability, and robust oxidation capabilities [10]. Basically, TiO2 is a wide bandgap n-type semiconductor with a lattice structure suitable for cation intercalation, leading to the creation of additional electronic states within the material’s bandgap. These additional states influence the material’s optical properties, enabling light absorption in the visible spectral range [11]. TiO2 is well-known for its structural polymorphism, featuring phases such as rutile, anatase, and brookite. The control of d-electrons through doping is facilitated by the filling of the 4 s shell, making it more favorable to place the next electron into the 3d shell rather than the 4p shell [12, 13]. TiO2 naturally exists in a combination of crystalline and amorphous phases [14]. Notably, the amorphous phase of TiO2 (a-TiO2) exhibits a large surface area, enhancing catalytic reaction rates and providing opportunities for diverse doping options. Moreover, it is abundant in the environment and can be manufactured at room temperature, eliminating the need for energy-intensive calcination, thus reducing chemical costs and energy consumption [15]. In the amorphous phase of TiO2, a notable characteristic is the confinement of tail states in close proximity to the band gap, which differs from crystalline materials where tail states are entirely spread out and not confined [14]. These unique attributes of a-TiO2 have sparked renewed interest in its potential as an alternative to the crystalline phase [15]. Notably, a-TiO2 has found applications in enhanced photocatalysis [16, 17], dye removal from water [18], and resistive random-access memory [19].
Apart from a-TiO2, the crystal-like phases of TiO2, such as anatase and rutile, exhibit unique structural features, chemical attributes, and optoelectronic behavior that set them apart from one another [20, 21, 22, 23]. Anatase TiO2, in particular, has gained widespread recognition as an ideal material for EC applications, primarily due to its open structure, conducive to ion intercalation and deintercalation, resulting in improved EC performance [2]. The transformation of TiO2 from its natural amorphous or poorly crystalline phases to different crystalline phases involves heat treatment. The phase transition in the material is contingent not only on annealing temperatures but is also squeezed by a multitude of reasons, comprising the reactivity of metal alkoxides, the ratio of water to alkoxides, the pH of the reaction medium, the nature of the solvent employed, and the presence of additives. These combined variables play a crucial role in governing the structural transformation of the material, highlighting the intricate interplay between multiple parameters in the process [24, 25]. Understanding and controlling these factors are essential for modifying the material’s stuffs to meet specific application requirements, making them of significant interest in materials science and engineering [25]. For instance, annealing plays a considerable role in crystal phase formation. The study conducted by Hakki et al. [26] delved into the impact of thermal heating on the crystal structure and crystalline size of TiO2. The research findings revealed that at a temperature of 500°C, a pure crystalline anatase phase of TiO2 was formed. However, as the heating temperature was raised to 600°C, this anatase phase disappeared entirely, and only the rutile phase of TiO2 remained. This transition from anatase to rutile is a significant observation, as these are two distinct crystallographic forms of TiO2 with varying properties. Furthermore, when the annealing temperature was pushed to a high level of 700°C, the crystalline structure of the rutile phase was destroyed, resulting in TiO2 being in an amorphous, non-crystalline state. This amorphous state indicates an absence of long-range order in the material’s atomic arrangement. The research by Kim et al. [27] explored the influence of heating temperatures fluctuating from 350 to 750°C on both the capacitive and oxidant-generating characteristics of TiO2. Additionally, this annealing treatment was found to alter the EC properties of TiO2, as previously indicated in other studies [28, 29]. The pH value was identified as a crucial factor affecting the crystal structures of TiO2, consequently impacting various properties, including absorption, transmission, and scattering, as reported in previous research [24, 25]. The pH of the precursor solution was detected to enhance the degree of crystallinity, playing a pivotal role in the formation of different phases of TiO2, a finding consistent with existing literature [30, 32]. It is noteworthy that the pH level was found to have a substantial touch on the architectural and photocatalytic features of TiO2, underlining its importance in shaping the material’s characteristics [32]. It was found that the TiO2 films exhibited a porous structure and significant roughness on their surfaces under lower acidic conditions. In contrast, films were very dense and had relatively smooth surfaces under higher acidic conditions [32]. Consequently, many methods have been adopted to fabricate TiO2 films with improved EC performance, including the sol-gel technique [33], anodization [11], doctor blade technique [34], vapor deposition [35], hydrothermal [36], and electrochemical deposition [37]. Among them, sol-gel is particularly appealing due to its cost-efficiency and ease of depositing uniform large-area films suitable for window applications [33]. As this method can produce nanocrystalline TiO2 films, we may expect to see improved EC performance because of its nanocrystalline structure [33]. On the other hand, electrochemical deposition can also be favorable for obtaining TiO2 thin films since it has low reaction temperatures, flexible substrate selection, and easy scaling [37].
Moreover, Pat et al. [38] emphasized the synthesis of TiO2 as a highly preferred material using the linear accelerated e-beam evaporation technique to fabricate TiO2-coated materials on ITO and FTO glass substrates. Electrochemical assessments revealed that TiO2/ITO and TiO2/FTO exhibited coloration efficiencies of 26 cm2/C and 6 cm2/C, accompanied by achieving ∆T of 10 and 8, respectively. Notably, the TiO2-deposited layer’s optimal contact with ITO-coated glass resulted in superior CE and porosity compared to its deposition on FTO glass. Despite employing the linear accelerated e-beam evaporation technique for TiO2 fabrication, the low ∆T of 28.6% has rendered the synthesis costly and impractical for real-world applications. In 2020, Nunes et al. [39] reported the synthesis of EC TiO2 nanostructured films on gold-coated papers using a microwave-assisted hydrothermal method at a low temperature of 80°C. The TiO2 films, particularly those produced with nitric acid, demonstrated significant ∆T of (57%, 9%, and 22%) between colored and bleached states at 250, 550, and 850 nm, respectively, in reflectance mode. These films also exhibited high cycling stability, enduring up to 1500 cycles without a significant loss of EC behavior. Despite the simplicity of the hydrothermal method, the requirement for gold-coated papers as a substrate for film deposition limits the practical applicability. The use of gold-coated paper does not significantly enhance the EC properties, posing a constraint on the overall effectiveness of the approach. In 2021, Eyovge et al. [40] reported the use of co-axial electrospinning to structure non-woven webs of TiO2 nanofibers loaded with Ag, Au, and CuO nanoparticles for EC applications. The composite layers exhibited distinct electrochromic effects: TiO2 loaded with Ag displayed a black-brown color, Au showed a dark-blue color, and CuO showed a dark-green color. Among these, the Au/TiO2 layer proved the most promising for electrochromic applications, featuring a color modulation time of 6 seconds, transmittance modulation of 40%, coloration efficiency of 20 cm2/C, areal capacitance of 300 F/cm2, and cyclic stability of over 1000 cycles. Despite employing metal doping to enhance the EC properties of pristine TiO2, the study notes that the resulting CE values and stability are not significantly improved. This limitation underscores challenges in achieving substantial advancements even with the introduction of metal dopants, potentially hindering the practical viability of the approach at a commercial scale. In 2022, Almarri et al. [41] reported the synthesis of TiO2 deposited by dip coating, incorporating poly(3,4-ethylenedioxythiophene)-poly(styrenesulfonate) (PEDOT:PSS) to form TiO2 + PEDOT:PSS hybrid composite films. EC characterizations demonstrated the reversible color change of the flexible hybrid device from dark blue to white transparent in less than 1 second, with a high in situ transmittance modulation (∆T = 70%) at 750 nm. However, a notable drawback in the synthesis is the incorporation of organic species along with TiO2 to enhance EC performance, making the process complex and increasing synthesis costs. In 2023, Xing et al. [42] successfully engineered defect-rich brookite TiO2 nanorods (NRs) via colloidal approach and examined their electrochromic capabilities for potential energy storage applications. The EC characteristics of TiO2 NRs, particularly those with longer lengths, demonstrate rapid switching speeds (20 seconds for coloration and 12 seconds for bleaching), high coloration efficiency (84.96 cm2 C−1 at a 600 nm wavelength), and overall stability. While the CE of the produced TiO2 is notably higher than reported values in the literature, there remains a drawback in terms of the slow switching speed, indicating a need for improvement in this aspect of the electrochromic performance. The drawback of the mentioned synthesis lies in its complexity and potential cost implications due to the controlled engineering of defect-rich brookite TiO2 nanorods, limiting its practical scalability for widespread applications. In 2023, Aiempanakit et al. [43] synthesized TiO2 nanotubes (TNTs) and bamboo-type TNTs structure films by anodizing sputtered titanium (Ti) films on ITO glass, adjusting the anodization process with varying amounts of deionized water and ethylene glycol. The EC performance was influenced by the amorphous structure and high energy band gap (Eg) in TNTs before annealing, with the bamboo-like structure exhibiting the best electrochromic properties, achieving ∆T of 12.58%. Despite utilizing the sputtering and anodization method for the synthesis of TiO2 nanotubes and bamboo-type TNTs structure, the achieved low transmission modulation of only 12.58% renders it impractical for economic scale applications. Additionally, the time-consuming nature of the process further adds to its drawbacks. Additionally, the studies [26, 27, 28, 29, 30, 31, 32, 38, 39, 40, 41, 42, 43] demonstrate the annealing effect and pH on the EC properties of TiO2 deposited by different methods. Additionally,the thickness of the TiO2 film can be efficiently controlled by controlling the applied current voltage and deposition time [37]. The EC properties of TiO2 reported in the literature have been described in Table 1.
Sr. no
Sample
Method
EC properties
Ref
Optical modulation (ΔT%)
CE (cm2/C)
Response time (sec)
Stability (CV cycles)
tb
tc
1
TiO2
Anodization
—
—
30
30
50
11
2
TiO2
Chemical solution deposition
14.2
7.98
30
30
—
28
3
TiO2
Sol-gel method
—
—
300
300
—
33
4
TiO2
Doctor blade method
68
33.7
2.0
5.0
—
34
5
TiO2
hot filament metal oxide vapor deposition
67
226
13.0
5.4
2000
35
6
TiO2
electrodeposition
—
—
—
—
1500
37
7
TiO2
linear accelerated e-beam evaporation technique
10
26
—
—
—
38
8
TiO2
hydrothermal method
9.0
—
58
71
1500
39
9
TiO2
Electrospinning
5
2.31
9.6
10.8
1000
40
10
TiO2
Colloidal approach
66.87
84.96
20
12
1000
42
11
TiO2
Anodization
12.58
—
—
—
—
43
12
TiO2
electrodeposition
17.18
58.33
1.32
2.10
1500
Our work
Table 1.
EC properties of TiO2 reported in the literature.
Nevertheless, the influences of thickness, annealing temperatures, and pH on the EC activities of TiO2 via simple electrodeposition using PG (C3H8O2) have not been extensively explored. Therefore, the current investigation goals to sermon this knowledge gap by directing an orderly examination into the effects of thickness, annealing temperature, pH on the EC properties of electrodeposited TiO2.Till date, there is currently no comprehensive study that has systematically examined the combined impact of these parameters, including annealing temperature, and pH on the EC properties of TiO2 thin films. This research gap signifies the novelty and significance of the present study, as it seeks to shed light on how these factors collectively influence the EC behavior of TiO2 films. Furthermore, the utilization of TTIP as a precursor and PG as both a solvent and a binder present a promising approach for producing stable films at a reduced cost, which is an innovative aspect of this research that contributes to the advancement of materials synthesis and their practical applications.
The experimental exploration was segmented into Two specific components: Section A (variation in annealing temperature), and Section B (variation in pH levels).
2.1 Materials
The materials utilized in the work included Titanium isopropoxide (TTIP), C3H8O2, HCl, DDW, Ammonia (NH3), and ITO glass plates with a conductivity of 25 ohm-cm2 and dimensions of 3 × 1 cm2, employed as substrates.
2.2 Synthesis of TiO2 films
In this study, TiO2 films were synthesized through an electrodeposition method on ITO glass substrates. Before commencing the synthesis process, the ITO glass substrates underwent a rigorous cleaning procedure involving ultrasonication in distilled water and acetone for a duration of 15 minutes. All aqueous solutions utilized in the experiments were prepared meticulously using DDW. The primary objective of this synthesis was to precisely tailor and optimize the fabrication process of TiO2 films, with a specific emphasis on their suitability for EC applications. The synthesis procedure was initiated with systematic variations in heating temperatures within the range of 250–650°C (SECTION A). After comprehensive evaluation, it was monitored that an annealing temperature of 450°C yielded the most favorable anatase phase, resulting in the best EC application of TiO2. Therefore, this temperature was selected for further synthesis steps. Lastly, the pH of the precursor solution was subjected to optimization, ranging from acidic to basic. Through experimentation, it was found that an acidic pH level of the precursor solution facilitated optimal growth of TiO2 crystals with improved EC performance. Consequently, this pH level was chosen as the most suitable for the synthesis process (SECTION B). The synthesis process of TiO2 films commenced by preparing a 0.05 M solution through the vigorous mixing of TTIP with PG. To attain the target pH of 1.0, HCl was cautiously introduced in small drops to get the clear TTIP solution. The reaction ensued as TTIP and PG formed a complex, subsequently undergoing hydrolysis. This chemical transformation led to the production of TiO2 and propionaldehyde, marking a critical step in the fabrication of TiO2 films. In this reaction, PG served as both a solvent and a stabilizer, preventing the formation of unwanted byproducts (Eq. (1)).
TiO2 thin films were fabricated through the deposition process, utilizing a three-electrode electrochemical cell configuration. In this setup, graphite assisted as the counter electrode, an Ag/AgCl electrode was used as the reference electrode, and ITO was employed as the working electrode. The deposition of TiO2 thin films took place at ambient room temperature, with a consistent voltage of −0.4 V applied for a duration of 1000 seconds.
For SECTION A, after deposition, the TiO2 film was dried at room temperature and annealed at temperatures of 250°C, 450°C, and 650°C to induce crystallization, and they were designated as T250, T450, and T650, respectively. For SECTION B, HCl and NH4OH were used to adjust the pH of the precursor solution to pH values of 1, 6, and 10. After deposition, the TiO2 film was dried at ambient temperature and annealed at 450°C to induce crystallization, and they were named TA (pH = 1), TN (pH = 6), and TB (pH = 10).
2.3 Methods
For the identification of the crystal phase and to calculate various structural parameters of the obtained sample, XRD patterns were recorded using XPERT-PROMPD X-ray diffractometer with uKα radiation (λ = 1.5405 Å) in 2θ range of 10–80°. The surface morphology of the synthesized products was observed using FE-SEM (Gemini attached in EDS, Oxford, AZtecLive).). The FT-IR spectrum was recorded in the range of 500–4000 cm−1 at a resolution of 2 cm−1 using the Perkin–Elmer 1710 spectrophotometer. The absorbance spectra were obtained using a UV-Vis spectrophotometer (PerkinElmer, Lambda 750). The film thickness ranged from 360 to 430 nm, and was determined using a surface profiler (DEKTAK3ST, Veeco). For the purpose of revealing the chemical characteristics, X-ray photoelectron spectroscopy (XPS) (Thermo Fischer Scientific ESCALAB Xi+) was used. The electrochemical features like CV, CA, and EIS were performed using a three-electrode system (Electrochemical Analyzer 608, CH Instruments), the counter Electrode (Platinum electrode), RE (Ag/AgCl electrode) and a WE (TiO2 thin film) with an electrolyte solution containing 0.5 M LiClO4-PC.
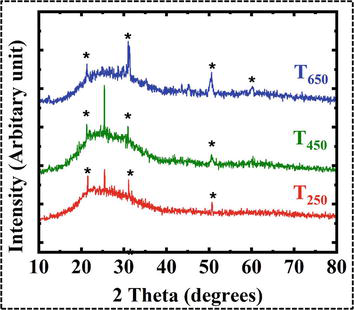
The crystalline phase of TiO2 films was studied using XRD measurements. The TiO2 material displayed a crystalline structure in both T250 and T450 films, evidenced by a distinctive diffraction peak observed at 2θ values of 25.3°, corresponds to the (101) Miller index corroborating the anatase phase (JCPDS files No. 21–1272) (Figure 1) [44, 45]. The (⁎) marked indicates substrate (ITO) peaks. It was perceived that while the temperature amplified from 250 to 450°C, the intensity of the anatase peak (101) was increased, implying an improvement of the crystalline structure and hence an increase in the crystallite size [46]. Another feature prevalent in diffractograms is the presence of a crystalline phase along with an amorphous phase associated with efficient ion intercalation/deintercalation, resulting in enhanced EC performance [47]. It was found that annealing at 650°C causes anatase to revert to an amorphous form, like in previous reports [26]. The average grain size is computed using Scherrer’s equation. Table 2 shows the crystallite sizes calculated, which range from 5.0 to 11 nm depending on the temperature of the thermal action. In our scenario, we noted that the point at which crystallinity becomes apparent in the films occurs at a minimal temperature, specifically 250°C. The variation in initiation temperatures for crystallization is directly associated with the specific precursor materials employed [48]. The XRD results of the TiO2 film developed for EC applications reveal the existence of anatase as well as brookite phases of TiO2, each possessing well-established electrochromic properties [38, 39, 40, 41, 42, 43, 44, 45]. Despite the presence of these multiple phases, there is a clear inclination in the literature to preferentially utilize the anatase phase of TiO2 in films designed for EC applications. This preference is rooted in the open structure of the anatase phase, which facilitates efficient ion intercalation and deintercalation, ultimately leading to an improved overall EC performance [2].
Figure 1.
XRD analysis of annealed TiO2 films.
Sample
Nature
Crystalline size (nm)
T250
amorphous+crystalline
5.2
T450
amorphous+crystalline
10.4
T650
amorphous
—
Table 2.
Crystalline size of annealed TiO2 films.
3.1.2 FE-SEM analysis
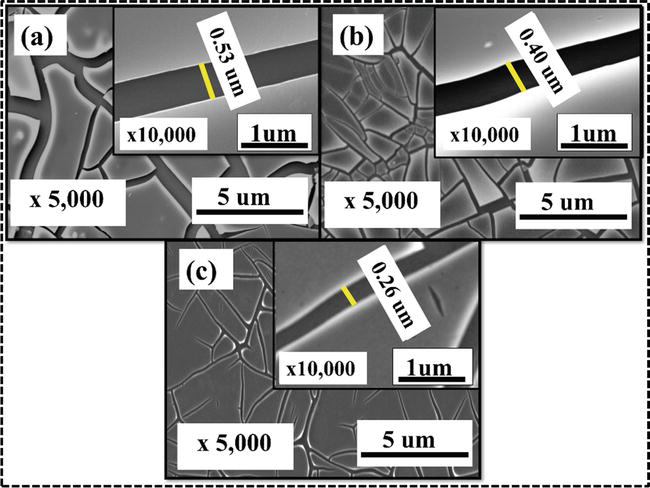
Figure 2 illustrates characteristic FE-SEM images of TiO2 explored as a function of temperature. A change in the annealing temperature, apart from variations in crystalline structure observed in XRD, is also responsible for significant changes in the morphology of TiO2 film.. It can be seen that annealed TiO2 displays a very cracked morphology similar to the crack morphology of nanocrystalline Titania [49], typical of the annealed film where cracks are formed when capillary stress exceeds the tensile stress of the film [49]. It is also observed that cracks spread entirely throughout the film, referred to as channeling cracks. Besides the damage, it also exhibits portions of agglomerated points (Figure 2(d)), similar to those observed by Leftheriotis and Yianoulisa [50]. The crack morphology observed in TiO2 films facilitates the easy penetration of electrolyte ions within the film, making the film more favorable for efficient ion diffusion during intercalation and deintercalation [51]. The present study may conclude that the crack morphology is obtained due to the tensile stress applied by a more viscous solvent (PG) on TiO2 nanoparticles. Additionally, TiO2 films form a uniform and densely packed structure with a proliferation in heating treatment from 250 to 650°C, implying a reduction in crack spacing and a decline in EC performance due to insufficient ion percolation.
Figure 2.
FE-SEM analysis of annealed TiO2 films at (a) 250°C (b) 450°C (c) 650°C.
3.1.3 FTIR analysis
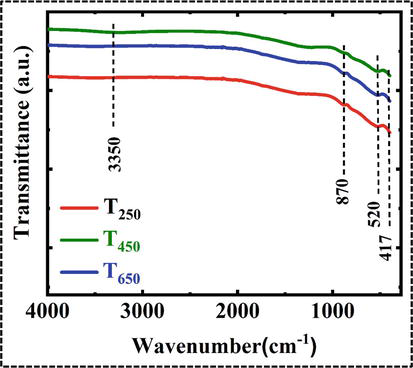
Chemical bonding between Ti and O2 atoms in annealed TiO2 films was scrutinized through the utilization of FT-IR spectroscopy.
Distinctive vibrational modes of the synthesized TiO2 material were identified at wavenumbers of 417 cm‑1, 520 cm‑1, and 870 cm‑1, and these can be credited to the stretching vibrations within the inorganic Ti–O–Ti network (Figure 3) [52, 53]. Furthermore, a band at 3350 cm−1 is ascribed to the stretching vibrations associated with hydroxyl groups (Ti-OH) originating from residual alcohol and hydroxyl groups [52, 53]. It was noteworthy that the annealing treatment resulted in a reduction in the intensity of the stretching vibration at 870 cm‑1. This phenomenon is attributed to the existence of both the anatase and amorphous phases of TiO2 with increasing annealing temperature. In its amorphous state, TiO2 typically exhibits a characteristic signal around 870 cm−1 [54]. The diminished intensity of the stretching vibration at 870 cm−1 suggests the existence of nanograins of the anatase phase, even within the amorphous TiO2 films. Importantly, the absence of other absorption peaks, such as those associated with organic residues like –CH and –CH2 stretching vibrations in the range of 1400–2900 cm‑1, indicates the absence of carbon contamination in the films. These findings align with the appearances of the anatase phase of TiO2 as documented in existing literature [52, 53].
Figure 3.
FTIR analysis of annealed TiO2 films.
3.1.4 EC and electrochemical analysis
3.1.4.1 CV analysis
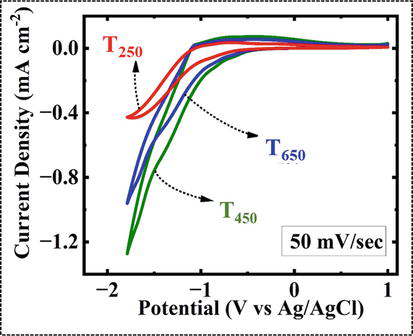
The EC investigation of annealed TiO2 films was carried out through CV analysis in the potential array spanning from −2 to 1 V, with reference to an Ag/AgCl electrode, at an examination rate of 50 mV/s, as depicted in Figure 4.
Figure 4.
CV analysis of annealed TiO2 films.
During the positive cycle of CV, it was observed that the annealed TiO2 films, particularly the T2 film, displayed redox peaks occurring at approximately −0.73 V, characteristic of the anatase phase of TiO2. Notably, these redox peaks exhibited slight shifts with increasing annealing temperature, possibly attributed to the heightened internal diffusion resistance within the film. The CV curve of the TiO2 film displays a distinctive duck-shaped profile, closely resembling the CV curves documented in previous literature [39, 40]. The T450 film has demonstrated a higher current density, which is indicated by the larger area under the CV curve. This improvement in performance can be attributed to the increased diffusion area owing to the crack morphology that the film offers to the electrolyte, surpassing the performance of other films. This underscores the beneficial impact of larger electrode surface areas on Li intercalation and deintercalation processes, aligning with the principles of the Randles-Sevcik equation [40, 55, 56].
3.1.4.2 CA analysis
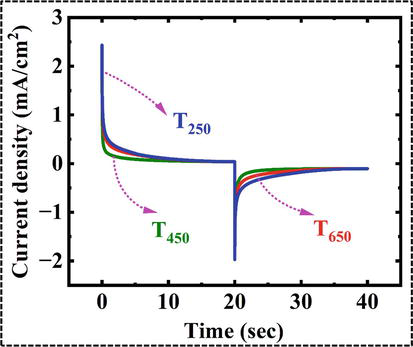
It is of paramount importance to accurately assess the period mandatory for the anodic or cathodic current to attain a stable level following the application of responsive voltages, particularly when transitioning between the colored and bleached states [57]. In our EC investigation, the amperometric i-t curve was instrumental in characterizing the switching kinetics of TiO2 films subjected to annealing at various temperatures. These films were immersed in a 0.5 M LiClO4-PC electrolyte for a duration of 20 seconds, as illustrated in Figure 5. The determination of response times for both the colored and bleached states of the TiO2 films is presented in Table 3. The switching kinetics of the coloration reaction in the T450 film is faster than in the T250 and T650 films. The quicker response of T450 originates from its island morphology, which facilitates easy and fast diffusion of ions within the film and improves the transmittance contrast and switching speed simultaneously.
Figure 5.
CA analysis of annealed TiO2 films.
Sample
Response time(sec)
%Tb
%Tc
%ΔT
(ΔOD)630nm
C.E (cm2/C)
tc
tb
T250
4.23
5.43
83.5
70.2
13.3
0.063
36.41
T450
1.32
2.10
82.3
64.5
17.18
0.010
58.83
T650
3.28
4.25
81.1
66.9
14.2
0.083
48.14
Table 3.
EC properties of annealed TiO2 films.
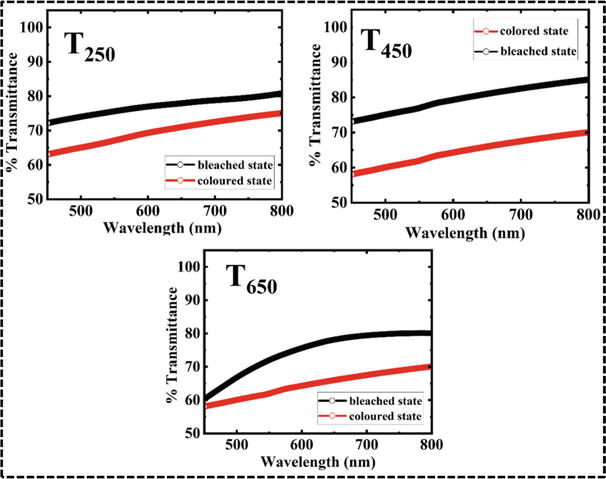
3.1.4.3 Optical analysis
The annealing treatment also affects the transmittance of TiO2 films. The optical transmittance of WO3, TiO2, and WT films was assessed using a spectrophotometer in both their colored and bleached states within a 0.5 M LiClO4-PC electrolyte (Figure 6). The change in optical density (ΔOD) was calculated using the following equation (Eq.2) [8]:
Figure 6.
The transmittance spectra of annealed TiO2 films in their colored and bleached states.
ΔODλ=630nm=log(TbTc)E2
Tb and Tc are the transmittance values for the bleached and colored states at 630 nm [8].
The CE, a vital parameter to probe the potential of the material as an EC material, was calculated at 630 nm using the following relation (Eq. 3) [8]:
CEλ=630nm=ΔOD630nmQiE3
Where ΔOD630nm=log(TbTc) And Qi = charge intercalated.
The T450 film in the current work exhibits the highest transmission modulation of 17.81% with CE of 58.38cm2/C at 630 nm. The main reason behind this is the enhanced ion and electron diffusion and can be attributed to the abundance of cracks and crevices within T450 film. After annealing the TiO2 film to a higher temperature (650 °C), CE decreased as ions and electrons could not intercalate and de-intercalate efficiently as the film tended to become smooth. Hence, the optimized annealing temperature of 450 °C has been chosen for the pH series.
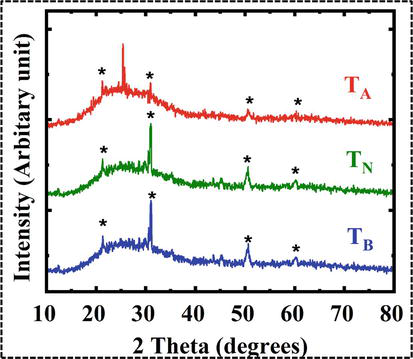
The XRD statistics of TiO2 films exhibited notable variations in response to modifications in the pH of the pioneer solution. Figure 7 provides an insightful depiction of the crystal structure and phase purity of TiO2 thin films manufactured under different pH conditions (pH 1, 6, and 10). Upon examination of the XRD profiles, it is evident both TA and TN films prominently display characteristic peaks of anatase phase at 2θ values of 25.3o corresponding to the (101) crystal planes (JCPDS files No. 21–1272) [44, 45]. Notably, the peaks marked with asterisks (*) represent the substrate (ITO) peaks. A discernible trend is observed in which the peak intensity diminishes with increasing pH values, indicating a reduction in crystalline size. The crystallite size of TiO2 films was quantified using Scherrer’s equation (Table 4). It is documented that the crystallite size can be effectively modulated by adjusting the pH of the precursor solution [58]. The reduction in crystallite size with rising pH can be ascribed to the repulsive forces operating between particles, preventing the coalescence of nanocrystalline entities, and impeding particle growth [59]. Furthermore, the existence of the anatase phase in the TA film, featuring a prominent peak at (110), signifies that the acidic environment fosters a more pronounced crystal growth compared to other pH conditions.
Figure 7.
XRD records of TiO2 films in different pH media.
Sample
Nature
Crystalline size (nm)
TA
amorphous+crystalline
10.4
TN
amorphous+crystalline
3.5
TB
amorphous
—
Table 4.
Crystalline size of TiO2 films in different pH media.
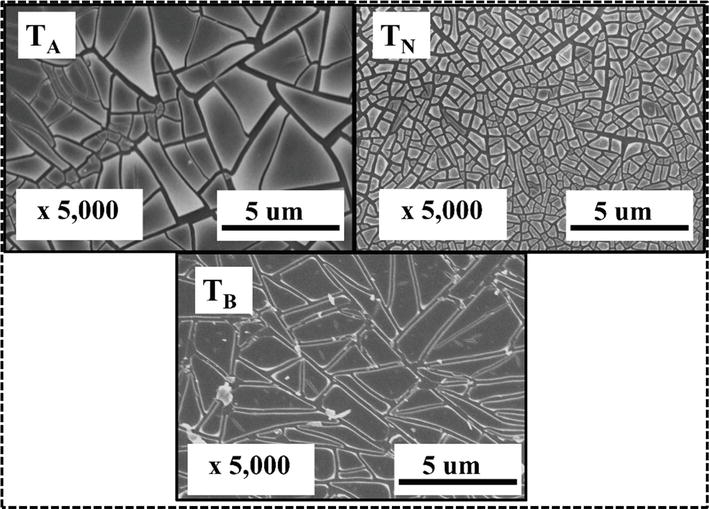
4.1.2 FE-SEM analysis
Figure 8 exhibits characteristic FE-SEM images of TiO2 investigated as a function of pH of precursor solution. As can be seen, TiO2 films exhibit channeling cracks, which are characterized by island-like crack patterns. It was observed that islands at higher pH have much larger sizes than islands at lower pH. As established by numerous scientific investigations, the surface charge of TiO2 is intrinsically induced by variations in pH [30]. Under acidic conditions, the presence of a robust repulsive charge among TiO2 particles diminishes the likelihood of coalescence. This phenomenon results in the creation of a more stable sol, ultimately leading to the development of cracks with larger dimensions. These pronounced cracks, in turn, facilitate the growth process [30]. According to FE-SEM images (Figure 8), growth rate of TiO2 decreases as pH increases from acidic to basic. The crack morphology observed in TA enables the easy penetration of electrolyte ions within the film, making the film more favorable for efficient ion diffusion during intercalation and deintercalation, as confirmed by electrochemical analysis [49, 50, 51].
Figure 8.
FE-SEM analysis of TiO2 films in different pH media.
4.1.3 FTIR analysis
FTIR stands as a practical and indispensable technique for the recognition of functional groups present in prepared samples.
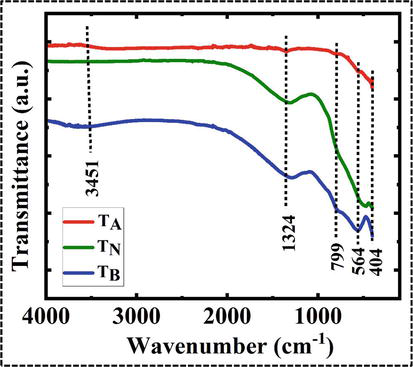
Across the pH range from acidic to basic, the FTIR spectra reveal distinctive vibrational modes associated with the synthesized TiO2 material, specifically at wavenumbers of 404 cm−1, 546 cm−1, and 799 cm−1 (Figure 9). These vibrational modes can be ascribed to the stretching vibrations inherent to the inorganic Ti–O–Ti network [52, 53]. Additionally, the presences of a characteristic peak at 1324 cm−1 is noteworthy, and its broadness is more pronounced at higher pH levels. This peak can be accredited to both C–H bending and C–O stretching modes of vibration. Furthermore, a band at 3451 cm−1 is ascribed to the stretching vibrations associated with hydroxyl groups (Ti-OH) originating from residual alcohol and hydroxyl groups [52, 53]. These observations align with the characteristics of the anatase phase of TiO2, as reported in the existing literature [52, 53].
Figure 9.
FTIR analysis of TiO2 films synthesized in different pH media.
4.1.4 XPS analysis
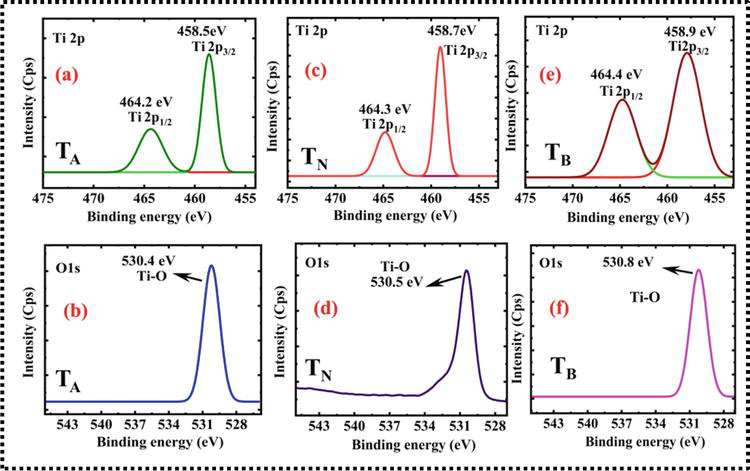
The investigation utilized XPS to explore the elemental composition and chemical states of TiO2 across various pH conditions, as depicted in Figure 10(a–f).
Figure 10.
XPS analysis of (a-b) TA (c-d) TN (e-f) TB films.
Analysis of the XPS spectrum of TiO2 films (Figure 10) revealed the exclusive presence of titanium (Ti) and oxygen (O) elements. In the TA sample (Figure 10(a)), distinctive peaks were identified at binding energies (BE) of 458.5 eV and 464.2 eV. Similarly, the TN sample (Figure 10(c)), exhibited notable peaks at BE 458.7 eV and 464.3 eV, while the TB sample (Figure 10(e)), displayed peaks at BE 458.9 eV and 464.8 eV. These peaks denote the presence of Ti2p3/2 and Ti2p1/2, distinctly characteristic of Ti4+ ions incorporated within the TiO2 lattice [60, 61]. Moreover, the computed difference in BE between Ti2p3/2 and Ti2p1/2 (ΔBE = Ti2p3/2 - Ti2p1/2) for the TA sample was approximately 5.7 [60, 61]. Similarly, for the TB sample, ΔBE was around 5.6, and for the TN sample, it was about 5.5, consistent with the characteristic Ti4+-O bonds in TiO2 [60, 61]. Additionally, examination of the O1s spectra in the TA sample (Figure 10(b)), revealed a singular signal at BE 530.4 eV, while the TN sample (Figure 10(d)), displayed a peak centered at BE 530.5 eV, and TB exhibited a signal at BE 530.8 eV (Figure 10(f)). These signals are attributed to lattice oxygen (O) within the Ti-O bond. The calculated ΔBE between Ti2p and O1s was 71.9 for TA, 71.8 for TN, and 71.9 for TN samples, indicating a proximity to the anatase phase (71.4 eV). These findings are consistent with the existing literature [60, 61].
4.1.5 EC and electrochemical properties
4.1.5.1 CV analysis
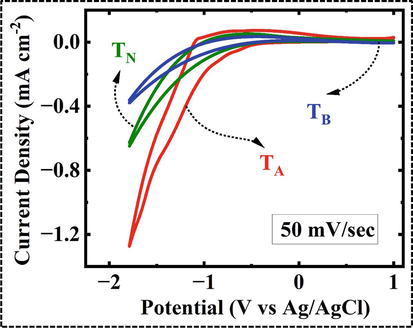
The electrochemical assessment of the TiO2 films was conventionally conducted through CV, operating within a potential range encompassing the 0.5 M LiClO4-PC electrolyte. As presented in Figure 11, the CVs were systematically scanned within a potential span extending from −2 to 1.0 V at a scan rate of 50 mV/s, with reference to Ag/AgCl electrodes. For metal oxides such as TiO2, the process of ion intercalation corresponds to optical coloration, while deintercalation is linked to the bleaching process, both of which are extracted in terms of the diffusion coefficient (D) [62]. It can be quantified through the utilization of the Randles-Sevcik equation [Eq. (4)].
Figure 11.
CV analysis of TiO2 films synthesized in different pH media.
ip=2.72×10⁵n32D12C0ν12E4
Where D is the diffusion coefficient of Li + ions; ν, scan rate (0.05 V/s); C0, concentration of active ions in the solution (0.5); n, number of electrons (it is assumed to be 1) and ip is the peak current density [62]. The diffusion coefficients are calculated for different pH media and are presented in Table 5.
Sample
Ip (A)
Diffusion coefficient (cm2/s)
TA
0.0032
1.743*10−8
TN
0.0012
1.568*10−9
TB
0.0005
2.723*10−10
Table 5.
Diffusion coefficients of TiO2 films in different pH media.
We have noticed that the current density, represented by the area under the curve, for the TA electrode exceeds that of both TB and TN electrodes at a scan rate of 50 mV/s. This disparity can be attributed to the larger diffusion area available for the acidic medium, resulting in a more effective interaction with the electrolyte compared to the basic and neutral states. Additionally, it is evident that the redox peaks of the TiO2 films exhibit slight shifts towards higher potentials as the pH value increases. This phenomenon is likely associated with an escalation in the internal diffusion resistance within the film [35]. It is noteworthy that in an acidic environment with a pH of 1, the TiO2 film demonstrates an expanded surface area, which enables the accommodation of a large number of active sites for the intercalation and de-intercalation of Li+ ions. This characteristic is particularly advantageous in EC applications.
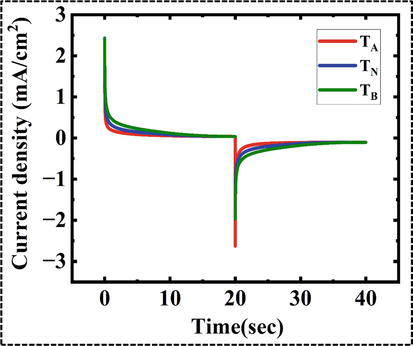
4.1.5.2 CA analysis
The assessment of the duration vital for the anodic or cathodic current to reach a stable state is a critical parameter, especially when reactive voltages are applied to transition between the colored and bleached states, as it directly impacts the reliability and effectiveness of EC films [57]. In our EC investigation, we employed amperometric i-t curves to assess the response time of TiO2 films under varying pH conditions, with a dwell time of 20 seconds in a 0.5 M LiClO4–PC electrolyte (Figure 12). The calculated response times for achieving both the colored and de-colored states of the TiO2 films are presented in Table 6. Our observations indicate that at lower pH values, characterized by a higher content of H+ ions, a substantial number of small nuclei are produced, possessing a notably enlarged active surface area [32]. In the current study, we found that the switching kinetics governing the coloration reaction in the TA film are faster in comparison to the TB and TC films. This boosted reactivity can be credited to the amplified insertion of H+ ions at pH = 1 [32]. This effect is closely associated with the presence of a larger active specific superficial area and the distinctive morphology inherent to crystalline TiO2 nanostructures. In this investigation, the observed switching speeds, particularly the bleaching time of 2.10 seconds, were marginally faster compared to values reported in previous studies (Table 1) [11, 28, 33, 34, 35, 36, 37, 38, 39, 40, 41, 42, 43]. Notably, these switching speeds are better than those documented in earlier literature [11, 28, 33, 34, 35, 36, 37, 38, 39, 40, 41, 42, 43]. The enhanced switching speed can be ascribed to the island-like morphology illustrated in Figure 5. This morphology facilitates the swift and effortless diffusion of ions within the film, leading to simultaneous improvements in transmittance contrast and switching speed.
Figure 12.
CA analysis of TiO2 films synthesized in different pH media.
Sample
Response time (sec)
%Tb
%Tc
Δ%T
(ΔOD)630nm
CE (cm2/C)
tc
tb
TA
1.32
2.10
82.3
64.5
17.18
0.010
58.38
TN
2.66
3.20
82.3
70.8
11.5
0.052
31.07
TB
3.78
4.04
83.1
75.8
7.3
0.039
29.35
Table 6.
EC properties of TiO2 films in different pH media.
4.1.5.3 Optical analysis
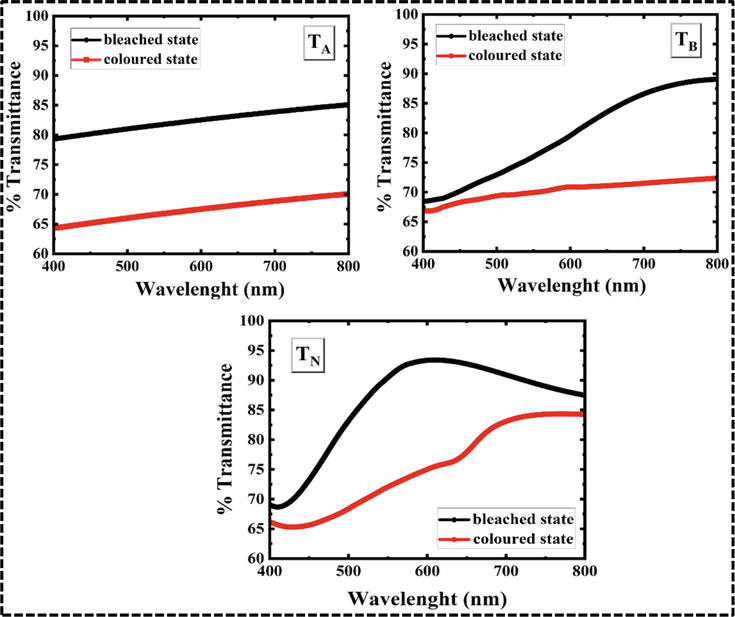
In order to estimate the effect of pH on EC response time, 95% of maximum optical contrast at 630 nm was considered. The study examined the transmittance of TiO2 films in both their colored and bleached states as depicted in Figure 13. To quantify the change in ΔOD, Eq. (2) was employed. Furthermore, the efficiency of the coloration process, denoted as CE and considered a crucial factor in assessing the material’s suitability for EC applications, was determined at a wavelength of 630 nm using Eq. (3). The investigation revealed a noticeable reduction in ΔOD as the pH increased, consequently leading to a decline in the CE of the TiO2 films. Notably, within the scope of the present work, the TA film exhibited the most substantial optical density, reaching 0.065 at 630 nm when transitioning between the bleached and colored states. This heightened ΔOD is attributed to the crystalline nature of the TA nanostructures, which possess an extensive active surface area and a favorable crack morphology. As a result, the acidic medium is established as advantageous for the development of the anatase phase, thereby enhancing the EC properties, particularly the noteworthy improvement in CE compared to other crystalline systems [51]. In the present study, the TA film demonstrates the highest percentage change in transmittance modulation of 17.18%, coupled with a remarkable CE charge value of 58.38 cm2/C at a wavelength of 630 nm. Additionally, the CE value for the TA film surpasses those documented in previous literature [28, 34, 38, 40], reaching levels comparable to CE values attained through alternative methodologies [42].
Figure 13.
The transmittance spectra of the TiO2 films in their colored and bleached states.
Consequently, the crystalline TiO2 film produced in this study holds significant potential for application in energy-efficient smart windows, owing to its swift-switching response and commendable CE. The EC parameters of the synthesized TiO2 films are comprehensively outlined in Table 6.
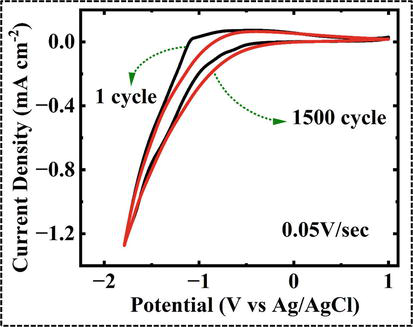
4.1.5.4 Stability
In the realm of EC materials, assessing stability is a pivotal criterion for evaluating their overall performance and suitability for various applications. In a current study, we undertook comprehensive stability testing on a TiO2 film, employing a 0.5 M LiClO4-PC electrolyte. The testing was carried out over a defined potential range of −2.0 to +1.0 V versus an Ag/AgCl (Figure 14) [51]. The results of our investigation revealed a remarkable outcome: the TiO2 film exhibited a level of stability that greatly surpassed expectations. Specifically, it demonstrated an impressive capacity to endure approximately 1500 charge and discharge cycles without significant deterioration or loss of functionality. This achievement exceeds the performance documented in existing literature for TiO2 films, as reported in literature [11, 40, 42], and is on par with the stability attained through alternative methods [37, 39]. This enhanced stability underscores the potential of the TiO2 film as a promising candidate for various EC applications, where long-lasting performance and durability are key prerequisites. These findings contribute to the growing body of knowledge in the field of EC materials, offering exciting possibilities for their practical implementation in next-generation technologies.
Figure 14.
CVs recorded for TA film in 0.5 M LiClO4-PC electrolyte.
This study has significantly advanced our understanding by systematically investigating the influence of film thickness, annealing temperature, and pH on the EC properties of electrodeposited TiO2 thin films. Utilizing simple electrodeposition method, we successfully fabricated TiO2 films on ITO glass, catering to potential applications in smart windows. Our comprehensive examination of synthesis parameters has unveiled optimal conditions that yield exceptional EC performance. In particular, a TiO2 film prepared in an acidic environment and annealed at 450°C demonstrated outstanding attributes. The structural and morphological analysis indicates the emergence of the anatase phase, characterized by island-like crack morphology. This structural configuration proves conducive to the efficient diffusion of ions and electrons, thereby enhancing the EC features of the fabricated TiO2 films. The films exhibited a substantial ΔT of 17.18%, a high CE of 58.8 cm2/C, and swift switching kinetics. These numerical results underscore the critical importance of precise control over film preparation parameters. The obtained data not only enhances the scientific understanding of TiO2’s EC behavior but also provide a solid foundation for future research and development in the field, emphasizing the significance of optimized synthesis conditions for achieving superior electrochromic performance in TiO2 thin films.
Ayesha Khan performed the experimental work; Dr. Anamika V. Kadam reviewed, revised, and edited the manuscript. Ayesha Khan has analyzed the data and wrote the manuscript. All authors participated in refining the manuscript and gave their approval for the final submitted version.
The datasets generated during and analyzed during the current study are available from the corresponding author upon reasonable request.
References
1.Granqvist CG. Electrochromics for smart windows: Oxide-based thin films and devices. Thin Solid Films. 2014;564:1-38. DOI: 10.1016/j.tsf.2014.02.002
2.Ohsuku T, Hirai T. An electrochromic display dioxide based on titanium dioxide. Electrochimica Acta. 1982;27:1263-1266. DOI: 10.1016/0013-4686(82)80146-1
3.Deb SK. Opportunities and challenges in science and technology of WO3 for electrochromic and related applications. Solar Energy Materials & Solar Cells. 2008;92:245, 258. DOI: 10.1016/j.solmat.2007.01.026
4.Qiu MJ, Sun P, Zhang B, Yu JH, Fu Y, Yu X, et al. Reliable information encryption and digital display applications based on multistate smart windows. Advanced Optical Materials. 2018;6:1800338
5.Liptay W. Electrochromism and Solvatochromism. Angewandte Chemie International Edition. 1969;8:177-187
6.Wang JM, Sun XW, Jiao ZH. Application of nanostructures in EC materials and devices: Recent Progress. Materials. 2010;3:5029
7.Xie Z, Gao L, Liang B, Wang X, Chen G, Liu Z, et al. Fast fabrication of a WO3•2H2O thin film with improved electrochromic properties. Journal of Materials Chemistry. 2012;22:19904
8.Zhang J, Tu JP, Zhang D, Qiao YQ , Xia XH, Wang XL, et al. Multicolor electrochromic polyaniline-WO3 hybrid thin films: One-pot molecular assembling synthesis. Journal of Materials Chemistry. 2011;21:17316
9.Neil S, Lou P, Hong Y, Brad P. Electrochromic dynamic windows for office buildings. International Journal of Sustainable Built Environment. 2012;1:125-139. DOI: 10.1016/j.ijsbe.2012.09.001
10.Zuo R, Gaoxiang D, Zhang W, Liu L, Liu Y, Mei L, et al. Photocatalytic degradation of methylene blue using TiO2 impregnated diatomite. Advances in Materials Science and Engineering. 2014;2014:1-7. DOI: 10.1155/2014/170148
11.Ghicov A, Albu SP, Macak JM, Schmuki P. High-contrast electrochromic switching using transparent lift-off layers of self-organized TiO2 nanotubes. Small. 2008;4:1063-1066
12.Hosaka N, Sekiya T, Satoko C, Kurita S. Optical properties of single-crystal Anatase TiO2. Journal of Physical Society of Japan. 1997;66:877-880
13.Cronemeyer DC. Electrical and optical properties of rutile single crystals. Physics Review. 1952;87:876
14.Prasai B, Bin Cai M, Underwood K, Lewis JP, Drabold DA. Properties of amorphous and crystalline titanium dioxide from first principle. Journal of Materials Science. 2012;47:7515-7752
15.Kaur K, Singh CV. Amorphous TiO2 as a photocatalyst for hydrogen production: A DFT study of structural and electronic properties. Energy Procedia. 2012;29:291-299. DOI: 10.1016/j.egypro.2012.09.035
16.Zou JA, Gao JC, Xie FY. An amorphous TiO2 sol sensitized with H2O2 with the enhancement of photocatalytic activity. Journal of Alloys and Compounds. 2010;497:420-427. DOI: 10.1016/j.jallcom.2010.03.093
17.Randorn C, Irvine JTS, Robertson P. Synthesis of visible-light-activated yellow amorphous TiO2 Photocatalyst. International Journal of Photoenergy. 2008;2008:1-6. DOI: 10.1155/2008/426872
18.Kanna M, Wongnawa S, Buddee S, Dilokkhunakul K, Pinpithak P. Amorphous titanium dioxide: A recyclable dye remover for water treatment. Journal of Sol-Gel Science and Technology. 2010;53:162-170. DOI: 10.1007/s10971-009-2072-5
20.Chen X, Mao SS. Titanium dioxide nanomaterials: Synthesis, properties, modifications and applications. Chemical Reviews. 2007;107(7):2891-2959. DOI: 10.1021/cr0500535
21.Li W, Ni C, Lin H, et al. Size dependence of thermal stability of TiO2 nanoparticles. Journal of Applied Physics. 2004;96:6663-6668. DOI: 10.1063/1.1807520
22.Ding K, Miao Z, Hu B, An G, Sun Z, Han B, et al. Study on the anatase to rutile phase transformation and controlled synthesis of rutile nanocrystals with the assistance of ionic liquid. Langmuir. 2010;26(12):10294-10302. DOI: 10.1021/la100468e
23.Shen L, Bao N, Zheng Y, et al. Hydrothermal splitting of titanate fibers to single-crystalline TiO2 nanostructures with controllable crystalline phase, morphology, microstructure, and photocatalytic activity. Journal of Physical Chemistry C. 2008;112:5985-5994. DOI: 10.1021/jp711369e
24.Petkov V, Holzhüter G, Tröge U, et al. Atomic-scale structure of amorphous TiO2 by electron, X-ray diffraction and reverse Monte Carlo simulations. Journal of Non-Crystalline Solids. 1998;231:17-30. DOI: 10.1016/S0022-3093(98)00418-9
25.Ibrahim SA, Sreekantan S. Effect of pH on TiO2 nanoparticles via sol-gel method. Advanced Materials Research. 2011;173:184-189
26.Hakki HK, Allahyari S, Rahemi N, Tasbihi M. The role of thermal annealing in controlling morphology, crystal structure and adherence of dip coated TiO2 film on glass and its photocatalytic activity. Materials Science in Semiconductor Processing. 2018;85:24-32. DOI: 10.1016/j.mssp.2018.05.031
27.Kim C, Lee S, Kim S, Yoon J. Effect of annealing temperature on the capacitive and oxidant-generating properties of an electrochemically reduced TiO2 nanotube array. Electrochimica Acta. 2016;222:1578-1584. DOI: 10.1016/j.electacta.2016.11.143
28.Lin SY, Chen YC, Wang CM, Liu CC. Effect of heat treatment on electrochromic properties of TiO 2 thin films. Journal of Solid-State Electrochemistry. 2008;12:1481-1486. DOI: 10.1007/s10008-007-0502-2
29.Verma A, Basu A, Bakhshi AK, Agnihotry SA. Structural, optical and electrochemical properties of sol-gel derived TiO2 films: Annealing effects. Solid State Ionics. 2005;176:2285-2295. DOI: 10.1016/j.ssi.2005.06.011
30.Sadiq SA, Waseem Z, Hanif S, Riaz S, Hayat K, Batool AIF, et al. Investigation of the role of pH on structural and morphological properties of titanium dioxide nanoparticles. In: IOP Conference Series: Materials Science and Engineering. Vol. 863. Institute of Physics Publishing; 2020. p. 012046. DOI: 10.1088/1757-899X/863/1/012046
31.Xia L, Feng ZH, Dai HT, et al. The influence of pH of the precursor solution on TiO2 films under hydrothermal synthesis, advances in display technologies III. SPIE. 2013;8643:86430L. DOI: 10.1117/12.2003018
32.Jahromi HS, Taghdisian H, Afshar S, Tasharrofi S. Effects of pH and polyethylene glycol on surface morphology of TiO2 thin film. Surface and Coating Technology. 2009;203:1991-1996. DOI: 10.1016/j.surfcoat.2009.01.034
33.Dinh NN, Oanh NTT, Long PD, et al. Electrochromic properties of TiO2 anatase thin films prepared by a dipping sol-gel method. Thin Solid Films. 2003;423:70-76. DOI: 10.1016/S0040-6090(02)00948-3
34.Nang Dinh N, Minh Quyen N, Chung DN, et al. Highly-efficient electrochromic performance of nanostructured TiO2 films made by doctor blade technique. Solar Energy Materials and Solar Cells. 2011;95:618-623. DOI: 10.1016/j.solmat.2010.09.028
35.Patil RA, Devan RS, Liou Y, Ma YR. Efficient electrochromic smart windows of one-dimensional pure brookite TiO2 nanoneedles. Solar Energy Materials and Solar Cells. 2016;147:240-245. DOI: 10.1016/j.solmat.2015.12.024
36.Chen JZ, Ko WY, Yen YC, et al. Hydrothermally processed TiO2 nanowire electrodes with antireflective and electrochromic properties. ACS Nano. 2012;6:6633-6639. DOI: 10.1021/nn300787r
37.Ye T, Xiang Y, Ji H, et al. Electrodeposition-based electrochromic devices with reversible three-state optical transformation by using titanium dioxide nanoparticle modified FTO electrode. RSC Advances. 2016;6:30769-30775. DOI: 10.1039/c6ra03315f
38.Akkurt N, Pat S, Mohammadigharehbagh R, Özgür M, Demirkol U, Olkun A, et al. Investigation of TiO2 thin films as a cathodic material for electrochromic display devices. Journal of Materials Science: Materials in Electronics. 2020;31:9568-9578. DOI: 10.1007/s10854-020-03499-0
39.Nunes D, Freire T, Barranger A, Vieira J, Matias M, Pereira S, et al. TiO2 nanostructured films for electrochromic paper based-devices. Applied Sciences. 2020;10:1200(1-14). DOI: 10.3390/app10041200
40.Eyovge C, Deenen CS, Ruiz-Zepeda F, Bartling S, Smirnov Y, Morales-Masis M, et al. Color tuning of electrochromic TiO2Nanofibrous layers loaded with metal and metal oxide nanoparticles for smart Colored windows. ACS Applied Nano Materials. 2021;4:8600-8610. DOI: 10.1021/acsanm.1c02231
41.Almarri AH. Enhanced electrochromic properties of anatase TiO2 for flexible electrochromic device. Ionics. 2022;28:4435-4444. DOI: 10.1007/s11581-022-04646-9
42.Xing C, Yang L, He R, Spadaro MC, Zhang Y, Arbiol J, et al. Brookite TiO2 nanorods as promising electrochromic and energy storage materials for smart windows. Small. 2023;19(49):2303639(1-11). DOI: 10.1002/smll.202303639
43.Aiempanakit C, Junbang P, Suphap W, Aiempanakit K. Influence of water content on structural and electrochromic properties of TiO2 nanotube prepared by anodization, journal of metals. Materials and Minerals. 2023;33:1680. DOI: 10.55713/jmmm.v33i3.1680
44.Auer A, Steiner D, Portenkirchner E, Kunze-Liebhäuser J. Non-equilibrium phase transitions in amorphous and anatase TiO2 nanotubes. ACS Applied Energy Materials. 2018;1(5):1924-1929. DOI: 10.1021/acsaem.7b00319
45.Fu X, Jia C, Wan Z, Weng X, Xie J, Deng L. Hybrid electrochromic film based on polyaniline and TiO2 nanorods array. Organic Electronics. 2014;15:2702-2709
46.Ma Y, Ni M, Li S. Optimization of malachite green removal from water by TiO2 nanoparticles under UV irradiation. Nanomaterials. 2018;8:428(1-11). DOI: 10.3390/nano8060428
47.Chaopeng F, Foo C. Pooi see Lee, one-step facile electrochemical preparation of WO3/graphene nanocomposites with improved electrochromic properties. Electrochimica Acta. 2014;117:139-144
48.Puchert MK, Timbrell PY, Lamb RN. Postdeposition annealing of radio frequency magnetron sputtered ZnO films. Journal of Vacuum Science & Technology A: Vacuum, Surfaces, and Films. 1996;14:2220-2230. DOI: 10.1116/1.580050
49.Mahe M, Heintz JM, Rödel J, Reynders P. Cracking of titania nanocrystalline coatings. Journal of the European Ceramic Society. 2008;28:2003-2010. DOI: 10.1016/j.jeurceramsoc.2008.02.002
50.Leftheriotis G, Yianoulis P. Development of electrodeposited WO3 films with modified surface morphology and improved electrochromic properties. Solid State Ionics. 2008;179:2192-2197. DOI: 10.1016/j.ssi.2008.07.018
51.Mandlekar BK, Jadhav AL, Jadhav SL, Khan A, Kadam AV. Binder-free room-temperature synthesis of amorphous-WO3 thin film on FTO, ITO, and stainless steel by electrodeposition for electrochromic application. Optical Materials. 2023;136:113460. DOI: 10.1016/j.optmat.2023.113460
52.Wen X, Zhang H. Photoelectrochemical properties of CuSGeO2-TiO2 composite coating electrode. PLoS One. 2016;11:e0152862. DOI: 10.1371/journal.pone.0152862
53.Saravanan L, Kumar RM, Arumugum P, Jayavel R. Synthesis and photophysical studies of PVP capped Titania Nanostrips for photocatalytic applications. Journal of Optoelectronics and advanced materials. 2010;4:1676-1680
54.Zhang JY, Boyd IW, O’Sullivan BJ, et al. Nanocrystalline TiO2 films studied by optical, XRD and FTIR spectroscopy. Journal of Non-Crystalline Solids. 2002;303:134-138. DOI: 10.1016/S0022-3093(02)00973-0
55.Qiu J, Li S, Gray E, Liu H, Gu QF, Sun C, et al. Hydrogenation synthesis of blue TiO2 for high-performance lithium-ion batteries. Journal of Physical Chemistry C. 2014;118:8824-8830. DOI: 10.1021/jp501819p
56.Babu SJ, Rao VN, Murthy DHK, Shastri M, Murthy M, Shetty M, et al. Significantly enhanced cocatalyst free H2 evolution from defect-engineered Brown TiO2. Ceramics International. 2020;47(10):14821-14828. DOI: 10.1016/j.ceramint.2020.10.026
57.Dhandayuthapani T, Sivakumar R, Ilangovan R, Gopalakrishnan C, Sanjeeviraja C, Sivanantharaja A, et al. Efficient electrochromic performance of anatase TiO2 thin films prepared by nebulized spray deposition method. Journal of Solid-State Electrochemistry. 2018;22:1825-1838
58.Usharani S, Rajendran V. Optical, magnetic properties and visible light photocatalytic activity of CeO2/SnO2 nanocomposites. Engineering Science and Technology, an International Journal. 2016;19:2088-2093. DOI: 10.1016/j.jestch.2016.10.008
59.Bakiro M, Ahmed SH, Alzamly A. Effect of pH, surfactant, and temperature on mixed-phase structure and band gap properties of BiNbO4 nanoparticles prepared using different routes. Chemistry (Switzerland). 2019;1:89-110. DOI: 10.3390/chemistry1010008
60.Ozer N. Reproducibility of the coloration processes in TiO2 films. Thin Solid Films. 1992;214(1):l-24
62.Sivakumar R, Raj AME, Subramanian B, et al. Preparation and characterization of spray deposited n-type WO3 thin films for electrochromic devices. Materials Research Bulletin. 2004;39:1479-1489. DOI: 10.1016/j.materresbull.2004.04.023
Written By
Ayesha Khan and Anamika Vitthal Kadam
Submitted: 27 December 2023Reviewed: 05 January 2024Published: 22 March 2024