Open Access is an initiative that aims to make scientific research freely available to all. To date our community has made over 100 million downloads. It’s based on principles of collaboration, unobstructed discovery, and, most importantly, scientific progression. As PhD students, we found it difficult to access the research we needed, so we decided to create a new Open Access publisher that levels the playing field for scientists across the world. How? By making research easy to access, and puts the academic needs of the researchers before the business interests of publishers.
We are a community of more than 103,000 authors and editors from 3,291 institutions spanning 160 countries, including Nobel Prize winners and some of the world’s most-cited researchers. Publishing on IntechOpen allows authors to earn citations and find new collaborators, meaning more people see your work not only from your own field of study, but from other related fields too.
Regional disparities are one of the sources of social inequality. The empirical study is based on theoretical concept of components of immigration-related ethnic conflicts. The chapter analyses immigration-related conflict risks sources. These conflicts manifest as tensions arising from the interaction between newcomers, often hailing from diverse cultural and ethnic backgrounds, and the established population. This study provides insights into immigration-related ethnic conflict risk levels across 75 Estonian municipalities, offering an understanding of regional risk factors and regional distribution of risks. Using the risk components, we quantify immigration-related conflict risk and use hierarchical cluster analysis to categorize municipalities into distinct types by interaction of conflict components. The empirical analyses reveal segregation of immigration-related ethnic conflict risk; however, this risk varies significantly among different municipality groups and is to a certain extent related with immigration. Three different groups of municipalities can be distinguished in Estonia. A total of 30% of all municipalities have elevated risk levels. In these municipalities, the readiness for conflict is higher than linear interaction with migration rates would predict. We conclude that immigration-related ethnic conflicts are dynamic phenomena shaped by the interplay of immigration processes and pre-existing ethnic divisions within societies.
*Address all correspondence to: mare.ainsaar@ut.ee
1. Introduction
Previous research has shown that intensive immigration can be associated with an increased risk of conflict in society [1, 2, 3]. Estonia is a country with a complex immigration history and rapidly changing demographic landscape and is therefore a good case for the analysis of migration and potential conflicts.
The main migration trends and the current migration situation are closely related to the country’s history, the most influential of which has been the intensive immigration from the territories of the Soviet Union after the Second World War, mainly to towns [4]. Most of the current immigrant population arrived during the Soviet period from Russia, Ukraine, and Belorussia. The restoration of Estonian’s independence in 1991 and subsequent events caused the essential outflow of the foreign-born population, but accession to the European Union in 2004, new opportunities and challenges, have been related to influx of new waves of immigrants since 2015.
Unlike some other post-communist regions, the attack on the parliament building in the spring 1990 and the autonomy referendum in Russian-speaking enclaves in 1993 did not escalate into large-scale violence or prolonged conflicts. The most recent violent episode involving a Russian minority group in Estonia occurred in 2007, known as the ‘Bronze Nights’ riots. It was classified as a hybrid conflict with roots of ethnic elements and Russia-initiated cyber-attacks [5]. Since 2014 Russia has tried to influence the legislative processes of Estonia, and interethnic relations between Estonians and Russians, using Russian media channels. Russian speaking population is open to Russian media influence due to the high prevalence of consumption of Russian media channels [6].
Due to the rapidly aging population, Estonia will, however, need immigrants in the future [7], and immigration flows will probably increase. It is a challenge for society, because for historical reasons attitudes toward immigrants are less friendly in Estonia than in many other European countries, although improving [8] and the country has had a rather conservative immigration policy during the past 25 years.
Another aspect witnessed in Estonia is its ethnic segregation. The nation is divided into 79 municipalities. Almost half of the Russophone population in Estonia lives in a linguistically homogenous (Russian-speaking) region in northeast of Estonia [9]. In the capital, Tallinn, approximately 53% of the population is of ethnic Estonian descent [10]. Ethnic segregation within the capital has increased notably, with the dissimilarity index rising from 31 in 1989 to 44 in 2019 (on the scale from 0 to 100 total segregation [11].
The main purpose of this chapter is to analyze if and how the intensity of immigration is related to the risks of social conflicts, which factors favor it, and give an overview about the situation in Estonia. In this chapter, we analyze sources of potential risks and their regional distribution by small units—75 municipalities of Estonia. We use an innovative approach for analyses of the regional distribution of risk components by immigration intensity and calculate immigration-related GINI index scores. The municipalities are classified into groups according to the distribution of risk components and the relationship of risk level and immigration by these groups is analyzed.
The chapter begins with a theoretical overview about sources of immigration-related ethnic conflicts and some previous studies. The method section presents the main information about measurements of risk components and methods for Estonia used in this chapter. Results present the distribution of regional disparities according to GINI coefficient, groups of municipalities according to composition of risk scores and migration, and risk components analyses.
Migration is seen as a tool for intermediating regional differences and determinants in economic, urban and social processes, but on the other side migration is a source of regional diversity. The topic of this chapter is potential immigration-related conflict, and although societies try to avoid conflict, intensive immigration can facilitate it. The tendency of immigrants to concentrate in certain regions is a well-known phenomenon [12]. Intensive immigration and social conditions related conditions create potential conflict risk. To avoid this, several countries use immigrant distribution policies [13, 14]. The risk of conflict is higher when there are at least two influential ethnic groups in the society [15, 16]. The two major ethnic groups in Estonia are Estonians and Russians or Russian-speaking community.
Our summary of international studies shows that migration can increase the risks of conflict due to the following components: immigrant’s elevated perception of discrimination, injustice, perception of inequality, distrust, social exclusion, different understanding of norms and values, lack of positive communication, feeling of fret, unequal access to resources [17, 18, 19, 20, 21]. We will analyze systematically these immigration-related conflict risk factors next and give an overview about previous studies related to these factors.
According to several studies [22, 23], the negative attitude towards immigrants is influenced by the recent change in the number of immigrants. According to self-categorization and social identity theory, people perceive the (ethnic) inner group members more positive and members of the external group more negative and stronger ethnic group consciousness can increase the risk of conflict [24, 25].
Following the classical conflict theory, increasing immigration and growing ethnic diversity weaken trust in society [26], if the immigrant group differs from the local population, mistrust increases because it is a group of ‘others’. Trust can especially suffer if there are no previous positive encounters with the new group.
Both sides of trust—lack of generalized trust as well as lack of trust of institutions can elevate potential conflict in societies, although their mechanisms of influence are different. Additionally, persons who do not trust other people and do not trust state institutions tend to be less tolerant of immigrants [27, 28].
Also, trust and values are linked because the same values in the community tend to generate trust and solidarity with co-members of that community [29]. A conflict of values is a problem when the values of immigrants and local people have different understandings of some important issues. Immigrants often retain place of origin values under the influence of their families even if they have arrived in a new country as children [30]. Therefore, the values, norms and religious beliefs of immigrant groups may differ from the ones of the dominant culture.
Low-norm obedience is a risk factor for conflict because it increases resistance to societal norms and order regardless of migration status. Additionally, natives expect that others respect their normative standards, entitlements, and it is expected that the minority groups will follow the normative rules of the host community, especially related to human rights and religion-related issues [31, 32].
Many theories associate conflict readiness in society with the perception of threat to economic, territorial, employment, social benefits or other resources such as identity, culture, power and security or perception of discrimination [33, 34]. Studies in Estonia [35] reveal that for ethnic Russians, the main grievances are related to perceived social inequality, perceived discrimination, low level of trust towards government institutions and unequal participation in public life and recognition. According to the Estonian Integration Monitoring Report 2020 [36], about 29% of ethnic minorities in Estonia felt that they are not welcomed in the country and 38% that they are second-class citizens. More than two-thirds (73%) believed that it is easier for Estonians to get a good job, and more than half (57%) thought that Estonians have better opportunities for education. A total of 73% of ethnic minorities felt that the preservation of their ethnic culture is endangered in 2027 [37].
Dissatisfaction with life increases social conflict risk as well. There are numerous sources of dissatisfaction, but the feeling of unfair treatment, associated often with immigrant status, reduces life satisfaction as well [38, 39, 40]. Gurr [41] emphasizes the importance of subjective perception of deprivation, not only the objective situation. In our analyses, we therefore look at all these different components together.
Several studies have shown that positive contacts between different groups reduce negative attitudes towards another group [42, 43]. It is hindered due to high regional ethnic segregation in Estonia. Ethnic Estonians and Russians live linguistically and occupationally in separate systems [6, 44]. Since the 1990s segregation has continued and Russians have concentrated more around their own areas [45] and this segregation might influence on turn ethnic relations. Only 36% of ethnic minorities and 38% of Estonians had engaged in conversations with individuals from different nationalities several times a month in the preceding 6 months [46]. Intensive recent immigration to already segregated regions can increase the risk of conflict between locals and newcomers.
Competition for the same resources is seen by many scholars as a source of conflict, for example, low and declining incomes, unemployment, economic inequality [47, 48] are risk factors for conflict. Conflict is particularly likely in situations of deficit of resources [49, 50]. As unemployment rises, opinions about the impact of immigrants on the economy may become more negative. In 2019, 25 percent of minorities and 18% of Estonians belonged to the lowest income quintile and in 2020, only 34% of the minorities considered their income fair, compared to 48% of Estonians [51].
Vetik with colleagues [52] summarize previous studies of the sources of conflict situation in Estonia as a combination of political-legal (a great number of Russian-speaking population), socio-economic (lower incomes, higher unemployment rate of the ethnic minorities) and regional (less developed North-East region with concentration of Russian speaking minority) forces. In this chapter, we analyze regional differences in social tensions and their relationship to migration with the most recent data and with help of more detailed list of social tension risk components based on a literature review and developed by authors [53]. Based on previous literature, we expect to see a positive relationship between migration and social conflict risk level, however, the components of the conflict may be different by region.
In this chapter, we examine the relationship between immigration intensity and the risk of potential conflict sources regionally. Immigration is measured by the international immigration rate to the municipality. We assume that the immigration does not have an immediate effect on the attitudes, but the effect is cumulative. For measurement of immigration, we use therefore an average value of the last 4 years.
We analyze the distribution of 16 immigration-related conflict components and calculate the distribution of GINI index scores for different municipalities. Traditionally Gini index measures the distribution of resources in income groups and the extent the situation deviates from a perfectly equal distribution. A Gini value 0 reflects perfectly equal distribution, while an index with values 1 reflects absolute inequality. In this chapter, we apply it to local governments in the context of immigration. We rank the local governments according to the rate of immigration. Next, we analyze the distribution of the components of risk in these ten GINI immigration groups. We use a special web page to calculate the Gini [54].
Thirteen out of the total 16 risk indicators reflect subjective perceptions and three are objective indicators by character. The subjective ‘feelings’ are particularly valuable in understanding potential sources of conflict. For data of perceptions and attitudes, we use information from the European Social Survey (ESS). ESS data is suitable for the analysis because it includes data about attitudes, beliefs and personal behavior of 15 and older population. Our research team has an access to the regional-level data of ESS for Estonia. We use pooled data from rounds 2014, 2016, 2018 into one database, in order to analysis the data at the municipality level. Additionally, we used data about immigration and unemployment rate from official statistics. All the components of the index are measured for 75 of the 79 Estonian municipalities. Four small municipalities were left out of the sample, as there was not enough information about them.
The choice of the components of conflict risk is based on an extensive literature review [53]. Information about 16 conflict risk components in municipalities was derived with methods as follows:
Diversity of ethnic and religious identities is measured by the share of groups with strong ethnic and religious identity, respectively. Elevated ethnic identity risk was coded if the titular ethnic group (Estonians) formed between 15 and 85 presents of population. For the religious groups, we use 5% threshold of two different religious groups in the municipality. For both indicators, higher conflict risk situation is marked with value ‘1’.
Distrust is represented by two subjective indicators. First, distrust of other people or generalized trust is measured with the ESS question ‘Overall, do you think most people can be trusted?’, where 0 means ‘you can’t be too careful’ and 10 ‘most people can be trusted’. Distrust of state institutions is measured with the ESS questions ‘How much you personally trust the following institutions: (1) parliament, (2) legal system, (3) police, (4) politicians, and (5) political parties?’, where 0 means ‘you do not trust an institution at all’ and 10 ‘you have complete trust’. The share of individuals responding with ‘0–4’ scores to these questions is used as an indicator of distrust to state institutions.
Values measures involve information about three types of attitudes—negative attitudes towards immigrants, negative stereotypes towards immigrants and conflicting values. For a measurement of negative attitudes towards immigrants, we use question ‘To what extent do you think Estonia should allow (1) people of the same race or ethnic group as most Estonia’s people; (2) people of different race or ethnic group as most Estonia’s people; (3) immigrants from poorer countries outside Europe to come and live here?’. Mean of shares of responses ‘Allow few or none’ for these three questions were used for calculations of immigrant attitude indicator. Negative stereotypes towards immigrant’s indicator is based on ESS question asking whether Estonia is made a worse or a better place to live by people coming to live here from other countries? Score 0 meant ‘Worse place to live’ and score 10 ‘Better place to live’. Share of ‘0–4’ responses indicate negative stereotypes. Also, conflicting values indicator is based on the ESS question. It measures differences of local-born and immigrant populations with an agreement. This question was used for value gap measurement because recognized value studies had found position of LGBT among the three most prominent immigration-related value gaps in Europe [55, 56].
Feelings of cultural, economic and physical threat are measured each by one subjective indicator from ESS. For measurement of cultural threat, we use question ‘Would you say that Estonia’s cultural life is generally undermined or enriched by people coming to live here from other countries?’, where 0 means ‘cultural life undermined’ and 10 ‘cultural life enriched’. Threat to economic resources is derived from a question ‘Would you say it is generally bad or good for Estonia’s economy that people come to live here from other countries?’, where 0 means ‘bad for the economy’ and 10 ‘good for the economy’. For both those questions percentage of people who answered ‘0–4’ serve as an indicator of threat. An indicator of feelings of threat to physical security is based on the ESS question as well ‘How safe do you—or would you—feel walking alone in this area after dark?’. Percent of people who feel unsafe or very unsafe was used as the indicator of feelings of threat to physical security.
Inequality and injustice is measured with perception of discrimination. The question asks if person would describe him/her as being a member of a group that is discriminated against in this country. Percent of people reporting this feeling is used as an indicator.
Dissatisfaction is measured with a question ‘How satisfied are you with your life as a whole nowadays?’, where 0 means ‘extremely dissatisfied’ and 10 ‘extremely satisfied’. Percent of people who answered ‘0–4’ is used as the dissatisfaction indicator.
Measurement of communication skills uses question ‘It is important to her/him to listen to people who are different from her/him. Even when she/he disagrees with them, she/he still wants to understand them’, where 1 means ‘Very much like me’; 2 ‘Like me’; 3 ‘Somewhat like me’; 4 ‘A little like me’; 5 ‘Not like me’; 6 ‘Not like me at all’. Percentage of people who responds that not like me or not like me at all is used as the poor communication skills indicator.
Low norm/rule obedience indicator is based on mean values of two ESS questions ‘How much each person is or is not like you? (1) She/he believes that people should do what they’re told. She/he thinks people should follow rules at all times, even when no-one is watching. (2) It is important to her/him always to behave properly. She/he wants to avoid doing anything people would say is wrong’. Arithmetic mean percentage of people answering ‘a little, not or not like me at all’ to these two questions is used as the low norm/rule obedience indicator.
Under limited economic resources, we measure economic coping and unemployment. Income question results come from ESS. A question asks ‘Which of the descriptions comes closest to how you feel about your household’s income nowadays?’, where 1 means ‘Living comfortably on present income’; 2 ‘Coping on present income’; 3 ‘Difficult on present income’; 4 ‘Very difficult on present income’. Percent of people answering ‘difficult’ or ‘very difficult’ is used as the poverty indicator. Second, arithmetic mean registered unemployment rate from 2015 to 2018 based on national statistics is used as an unemployment indicator.
To profile better the position of different local municipalities from the point of view of immigration-related conflict risk, we use also hierarchical cluster analysis. The method groups municipalities according to their similarity using 16 risk indicators. The municipalities most like each other remain in the same group.
4. Results: conflict risk levels and typologies of Estonian municipalities
We assess the immigration-related conflict risk levels in 75 Estonian municipalities and their regional distribution and division into different groups. These calculations considered the different immigration burdens of municipalities.
On average immigration intensity varies from 0.5 to 2.4 immigrants per by 1000 inhabitants. The variability of immigration-related potential conflict source characteristics across deciles of local governments is shown by the GINI index.
For the most potential conflict indicators, the GINI index is close to 0.5, which indicates an average concentration. This means that on a scale from 0 to 1, where 0 is equal distribution and 1 is concentration in only one unit, these risks are distributed on average. Demographic indicators (segregation by ethnic groups and religious groups) have the highest GINI. This demonstrated once again strong ethnic and religious segregation in Estonia. Perception on injustice and value gap between the local and immigrant populations are the next important features with high segregation (Table 1).
Indicator
GINI
Identity: Ethnic groups (15 to 85 percent of inhabitants identify themselves as titular ethic group; 1 = yes; 0 = no)
0.71
Identity: Religious groups (at last two form 5% of population) (1 = yes; 0 = no)
0.69
Trust: Generalized trust (% of people who do not trust other people)
0.54
Trust: Institutional trust (Mean of % of people having low (< 5) trust in country’s parliament, legal system; police; political parties; politicians)
0.52
Values: Negative immigration attitudes (Mean % of people allowing few or no immigrants of (1) same race/ethnic group as majority; (2) different race/ethnic group from majority; (3) from poorer countries outside Europe)
0.52
Values: Negative stereotypes (% of people who think that immigrants make country worse place to live)
0.53
Values: Value gap (Difference between % of local people and immigrants who disagree that gay men and lesbians should be free to live their own life as they wish)
0.60
Threat: Cultural threat (% who think that cultural life is undermined by immigrants)
0.54
Threat: Economic threat (% who think that immigration is bad for economy)
0.53
Threat: Physical threat (% who feel unsafe walking alone in local area after dark)
0.58
Perception on injustice (% who think that they belong to a group discriminated in a country/100) *10
0.64
Dissatisfaction (% who are dissatisfied with life as a whole)
0.56
Poor communication skills (% who think that it is little, not or not at all important to them to understand different people)
0.56
Low norm obedience (Mean % of people who say that it is not important to them to (1) do what is told and follow rules, and (2) behave properly /100)
0.52
Resources: Poverty (% who think that it is difficult or very difficult on present income)
0.55
Resources: Average registered unemployment rate during last 4 years
0.53
Table 1.
GINI index for components of the potential immigration related conflict sources (municipality deciles are calculated according to distribution of immigration, for calculations of GINI we use distribution of conflict features in those immigration deciles groups).
Correlation analyses showed that immigration rate had the strongest correlation with share of ethnic groups (0.473, p > 0.000) and religious background (0.424, p > 0.000). Also, feelings of dissatisfaction with life (0.434. p > 0.000), perception of injustice (0.318**, p = 0.005), feelings of threat to physical security (0.242, p = 0.036) are associated with higher immigration flows. The other variables did not have a direct correlation with immigration rate.
Three groups of local governments can be distinguished on the basis 16 conflict risk indicators (Table 2) in hierarchical cluster analysis. Mostly the risk indicators are lower in Type 1 and Type 2 municipalities and highest in Type 3. Only 5 municipalities belong to the type 3 group, 20 to group 2 and 50 to group 1.
Average
Type 1
Type 2
Type 3
Groups with different ethnic identity
0.31
0.00
1.00
0.60
Groups with different religious identity
0.37
0.16
1.00
0.00
Distrust of other people
0.23
0.22
0.24
0.30
Distrust of state institutions
0.49
0.48
0.50
0.57
Negative attitudes toward immigrants
0.52
0.51
0.53
0.63
Negative stereotypes toward immigrants
0.46
0.46
0.47
0.40
Conflicting values (value gap)
0.23
0.23
0.24
0.19
Feelings of cultural threat
0.35
0.33
0.39
0.35
Feelings of economic threat
0.43
0.43
0.42
0.46
Feelings of threat to physical security
0.15
0.11
0.18
0.38
Perception of injustice
0.48
0.25
0.56
2.43
Feelings of dissatisfaction
0.59
0.50
0.70
1.01
Poor communication
0.15
0.16
0.11
0.12
Low norm/rule obedience
0.34
0.36
0.30
0.28
Poverty
0.27
0.25
0.25
0.50
Unemployment
0.31
0.28
0.31
0.54
Number of municipalities belonging to this group
75
50
20
5
Table 2.
Components on immigration related conflict risks by municipality types.
Type 3 municipalities have high scores in many risk factors—distrust, negative attitudes towards immigrants, low physical security, dissatisfaction, poverty, feeling of injustice, unemployment (Table 2). Luckily, norm obedience is relatively high, compared to other groups in this group. Municipalities belonging to this group can be characterized as religiously homogeneous, but ethnically diverse. All of them are cities, located in the northern and north-eastern regions of Estonia. Many of these cities can be characterized as (former) industrial cities, which host a substantial immigrant population. Economic well-being indicators in these municipalities lag behind other areas, with an average monthly gross salary of around 1100 euros in 2021 (data of 2021 Statistics Estonia).
Type 2 municipalities are multi-ethnic and multi-religious municipalities with some elevated perceptions of immigration-related frets, perception of injustice and dissatisfaction. Out of 20 municipalities, 6 in this group are towns. This includes a large part of the municipalities in Northern Estonia, which make up 50% of the municipalities of this group. However, we can also find here municipalities from Southern Estonia and other places.
Type 1 municipalities are ethnically and religiously quite homogeneous with lowest risk factors (Table 2). Only the lower-level low norm obedience and lower communication level is noteworthy in this group. It is also the most dominant group in the country, 71% of Estonian municipalities belong to this type.
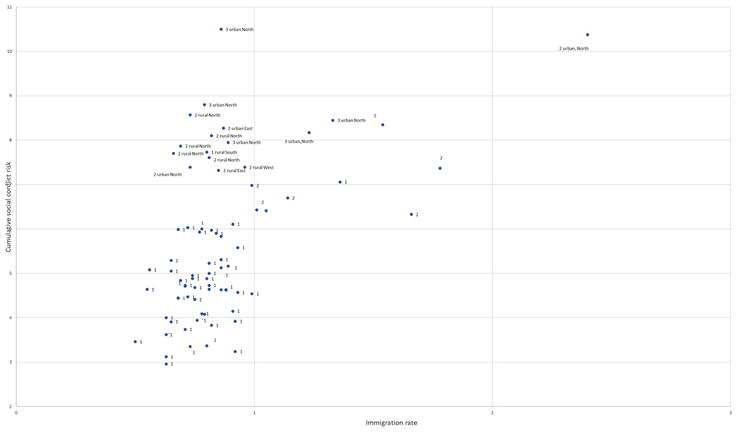
Figure 1 shows how migration intensity and cumulative index for potential conflict risk interact with different profiles of municipalities. In the figure, we use the cumulative index developed by Maasing et al. [53] to measure social tension but omit the migration component from it in order to analyze it separately. We can expect that migration and the risk factors are related. From Figure 1, we can see that there is indeed a link between migration and cumulative social risk level.
Figure 1.
Immigration intensity and cumulative index for potential conflict risk.
In most cases, even a small increase in the intensity of migration is associated with an elevated level of social conflict risk. Mostly municipalities with low migration intensity belong to group 1 and have low level of social risk.
Types 2 and 3 municipalities have highest cumulative risk levels. Particularly interesting group are those local governments whose level of risk of social conflict is disproportionately high compared to immigration (upper section on the left on Figure 1). The labels in the Figure 1 indicates also the geographical position and type of settlement for those settlements.
They are mostly Types 2 and 3 urban settlements, which are located in Northern Estonia. In this special group, the main source of risk is not immigration, but already developed social fears and perceptions which generally also characterize Types 3 and 2 municipalities.
Estonia has managed to avoid major ethnicity-based clashes since 2007, but this stability is not guaranteed. There are still factors in Estonian society that could lead to tensions, including increasing immigration pressure, ethnic segregation, communication gaps of different groups, language issues, historical interpretations, distrust, discrimination and socio-economic disparities. All these factors were also considered in the social risk analysis in this chapter.
This chapter focused on the potential sources of social conflict related to immigration, and how do these risks vary across regions in the 75 municipalities of Estonia. We use components of an immigration-related conflict index developed by authors [53] for grouping of local municipalities and the analysis of migration and social risk connections. We used 16 variables representing eight potential sources of conflicts: identity (ethnic and religious), distrust (to other groups and institutions), value difference (negative attitudes, stereotypes), perceived threat (to culture, economy, physical safety), perceived inequality, dissatisfaction, poor communication between groups, low-norm obedience, availability of resources (poverty and unemployment rate).
Analysis of risk by migration deciles showed segregation by ethnic groups and religious groups as these risk components had the highest GINI. Perception on injustice and value gap between local and immigrant population were also important features of segregation. For the rest of indicators, the index was close to 0.5, which indicates an average concentration.
Recent immigration intensity was quite strongly correlated on municipality level with a diversity of ethnic and religious groups and feelings of dissatisfaction with life, perception of injustice, feelings of threat to physical security. Result shows that the intensity of migration is positively related to the social tensions regionally, i.e. those regions with higher immigration rate are the ones with a higher cumulative social tension result. In most cases, even a small increase in the intensity of migration is associated with an elevated level of social conflict risk.
Somehow exceptional was a large number of municipalities with a high risk of conflict in the Northern region, where the tension was higher than immigration would have been expected from immigration intensity. Since these regions are the ones with a higher level of historical immigration already, this may be an indication that the process of immigrant integration has not been successful enough and needs more attention.
Regionally three types of municipalities can be distinguished in Estonia. About 70% of the municipalities belong to the Type 1 municipalities which have low immigration rate and low social risk level, 30% (Type 2 and 3) have some elements of elevated social risk level, but this risk is less correlated with recent immigration activity. Elevated risk level may be influenced by historical migration processes in these municipalities. The risk was highest in Type 3 municipalities. They had high scores in many risk factors—distrust, negative attitudes towards immigrants, low-physical security, dissatisfaction, poverty, feeling of injustice, unemployment. Surprisingly norm obedience was relatively high in this group, despite of all other risk factors. This element may prevent open conflicts. Type 2 municipalities had average risk scores.
The results of our research help better understand the relationship between migration and social risks and plan risk prevention. They also contribute to a deeper understanding of the complex relationship between migration and social risks. This allows policymakers to facilitate risk prevention planning, which should include migration, integration and social policy aspects. This is particularly valuable because, although it shows that migration of conflict factors is related, there are certain areas where the sum of potential conflict factors is greater than one would expect from immigration flows.
Our analysis also gave an explanation that the conflict has increased in these areas due to distrust, negative attitudes towards immigrants, low-physical security, dissatisfaction, poverty, feeling of injustice, unemployment.
Therefore, in the context of Estonia, these factors are the ones that should be dealt with as a matter of priority in society and in the field of integration. This type of analysis also allows for a more precise geographical delimitation of policy priority areas, where problems should be tackled as a matter of priority.
Nevertheless, this study has certain limitations. We would like highlight that the conflict risk level is designed to measure conflicts readiness, and the result may not therefore represent real-world conflicts. Also, due to the lack of empirical data on municipality level, some few risk components have been left out of the analysis, like the role of media and role of individual instigators of conflict.
The research was funded by Estonian Research Council (RITA MIGRATION) which is supported by the Estonian Government and European Regional Development Fund.
References
1.Halevy N, Cohen TR. Intergroup conflict 2020. Negotiation and Conflict Management Research. 2019;12:161-175. Special Issue. DOI: 10.1111/ncmr.12148
2.Marozzi M. Construction, robustness assessment and application of an index of perceived level of socio-economic threat from immigrants: A study of 47 European countries and regions. Social Indicators Research. 2016;128:413-437. DOI: 10.1007/s11205-015-1037-z
3.Barbulescue R, Beaudonnet L. Protecting us, protecting Europe? Public concern about immigration and declinging support for European integration in Italy. Perspectives on European Politics and Society. 2014;15:216-237
4.Ainsaar M. Eesti rahvastik Taani Hindamisraamatust tänapäevani. Tartu: Tartu Ülikooli Kirjastus; 1997
5.Juurvee I, Mattiisen M. The Bronze Soldier Crisis of 2007: Revisiting an Early Case of Hybrid Conflict. Tallinn: International Centre for Defense and Security [Internet]; 2020. Available from: https://icds.ee/en/the-bronze-soldier-crisis-of-2007/ [Accessed: October 28, 2022]
6.Petsinis V. Ethnic relations, the EU, and geopolitical implications: The cases of Croatia and Estonia. Ethnopolitics. 2016;15:230-244
7.Ainsaar M, Rootalu K. European demographic change and welfare challenges. In: Schubert K, de Villota P, Kuhlmann J, editors. Challenges to European Welfare Systems. Cham Heidelberg, New York, Dordrecht, London: Springer; 2016. pp. 793-806
8.Goubin S, Ruelens A. Towards a typology of European migration attitudes across time and space: A person-centred approach. Journal of Ethnic and Migration Studies. 2024;online first:1-22. DOI: 10.1080/1369183X.2023.2301406
9.Kährik A, Kangur K, Leetmaa K. Socio-economic and ethnic trajectories of Housing Estates in Tallinn Estonia. In: Hess D, Tammaru T, editors. Housing Estates in the Baltic Countries. The Urban Book Series. Cham: Springer; 2019. pp. 203-223. DOI: 10.1007/978-3-030-23392-1_10
10.Statistics Estonia. Suur Eesti rahva e-loendus 2021 tulemused maakondlik vaade [Internet]. Tallinn: Statistics Estonia; 2021. Available from: https://rahvaloendus.ee/et/tulemused [Accessed: December 11, 2022]
11.Tammaru T, Sinitsyna A, Akhavi Zadegan A, van Ham M, Marcińczak S, Musterd S. Income inequality and residential segregation in European cities. In: Pryce G, Wang YP, Chen Y, Shan J, Wei H, editors. Urban Inequality and Segregation in Europe and. China: Springer; 2021. pp. 39-54. DOI: 10.1007/978-3-030-74544-8_3
12.Hall M. Residential integration on the new frontier: Immigrant segregation in established and new destinations. Demography. 2013;50:1873-1896. DOI: 10.1007/s13524-012-0177-x
13.OECD. Towards 2035 Making Migration and Integration Policies Future Ready. Paris: OECD; 2020. Available from: https://www.oecd.org/migration/mig/migration-strategic-foresight.pdf
14.Weidmann NB. Geography as motivation and opportunity: Group concentration and ethnic conflict. Journal of Conflict Resolution. 2009;53:526-543
15.Montalvo JG, Reynal-Querol M. Ethnic polarization, potential conflict, and civil wars. American Economic Review. 2005;95:796-813
16.Costalli S, Moro FN. The patterns of ethnic settlement and violence: A local-level quantitative analysis of the Bosnian war. Ethnic and Racial Studies. 2011;34:2096-2114. DOI: 10.1080/01419870.2011.556748
17.Moore CW. The Mediation Process: Practical Strategies for Resolving Conflict. San Francisco: CA Jossey-Bass; 2003
18.Eidelson RJ, Eidelson J. Dangerous ideas: Five beliefs that propel groups toward conflict. American Psychologist. 2003;58:182-192
19.Cederman LE, Weidmann NB, Gleditsch KS. Horizontal inequalities and Ethnonationalist civil war: A global comparison. American Political Science Review. 2011;105:478-495
20.Collier P, Hoeffler A. Greed and grievance in civil war. Oxford Economic Papers. 2004;56:563-595
21.Lujala P, Rød JK, Thieme N. Fighting over oil: Introducing a new dataset. Conflict Management and Peace Science. 2007;24:239-256
22.Karreth J, Singh SP, Stojek SM. Explaining attitudes toward immigration: The role of regional context and individual predispositions. West European Politics. 2015;38:1174-1202. DOI: 10.1080/01402382.2015.1022039
23.Meuleman B, Davidov E, Billiet J. Changing attitudes toward immigration in Europe, 2002-2007: A dynamic group conflict approach. Social Science Research. 2009;38:352-365
24.Turner JC, Hogg MA, Oakes PJ, Reicher SD, Wetherell MS. Rediscovering the Social Group: A Self-Categorization Theory. Cambridge: Basil Blackwell; 1987
25.Tajfel H, Turner JC. The social identity theory of intergroup behavior. In: Worchel S, Austin WG, editors. Psychology of Intergroup Relation. Chicago: Hall Publishers; 1986. pp. 7-24
26.Gundelach B, Manatschal A. Ethnic diversity, social trust and the moderating role of subnational integration policy. Political Studies. 2017;65:413-431
27.Husfeldt V. Extreme negative attitudes towards immigrants: An analysis of factors in five countries. Prospects. 2006;36:355-374
28.Paas T, Halapuu V. Attitudes towards immigrants and the integration of ethnically diverse societies. Eastern Journal of European Studies. 2012;3:161-176
29.Breidahl KN, Holtug N, Kongshøj K. Do shared values promote social cohesion? If so, which? Evidence from Denmark. European Political Science Review. 2018;10:97-118
30.Giuliani C, Olivari MG, Alfieri S. Being a “good” son and a “good” daughter: Voices of Muslim immigrant adolescents. Social Sciences. 2017;6:142
31.Packer DJ. On being both with us and against us: A normative conflict model of dissent in social groups. Personality and Social Psychology Review. 2008;12:50-72
32.Berger P, editor. The Limits of Social Cohesion. Conflict and Mediation In Pluralist Societies. New York: Routledge; 1998
33.McLaren L, Johnson M. Resources, group conflict and symbols: Explaining anti-immigration hostility in Britain. Political Studies. 2007;55:709-732
34.Stephan W, Renfro C, Davis M. The role of threat in intergroup relations. In: Improving Intergroup Relations: Building on the Legacy of Thomas F. Pettigrew. Malden, Oxford, Victoria: Blackwell Publishing; 2009. pp. 55-72. DOI: 10.1002/9781444303117.ch5
35.Lauristin M, Vihalemm P, editors. Estonia’s Transition to the EU. London, New York: Routledge; 2009
36.Anniste K, Seppel K. Võimaluste võrdsuse tajumine ja ebavõrdse kohtlemise kogemused. Eesti ühiskonna lõimumismonitooring 2020. Estonia. Available from: https://www.kul.ee/en/estonian-integration-monitoring-2020: SA Poliitikauuringute Keskus Praxis, Balti Uuringute Instituut, Tallinna Ülikool, Tartu Ülikool, Turu-uuringute AS; 2020 [Accessed: 31 January 2024]
37.Anniste K. Võrdse kohtlemise ja võrdsete võimaluste tunnetamine. In: Eesti ühiskonna integrastsiooni monitooring 2017. Estonia: Balti Uuringute Instituut, SA Poliitikauuringute Keskus Praxis; 2017, ISSN 2585-4836
38.Cederman LE, Gleditsch KS, Buhaug H. Inequality, Grievances, and Civil War. Cambridge: Cambridge University Press; 2013
39.Must E. When and How Does Inequality Cause Conflict? Group Dynamics, Perceptions and Natural Resources [Thesis]. UK: Department of Government: London School of Economics; 2016
40.Miodownik D, Nir L. Receptivity to violence in ethnically divided societies: A micro-level mechanism of perceived horizontal inequalities. Studies in Conflict and Terrorism. 2016;2016(39):22-45
41.Gurr TR. Why Men Rebel. Princeton, New Jork: Princeton University Press; 1970
42.Semyonov M, Glikman A. Ethnic residential segregation, social contacts, and anti-minority attitudes in European societies. European Sociological Review. 2009;25:693-708
43.Allport GW. The Nature of Prejudice. Oxford: Addison-Wesley; 1958
44.Korts K. Inter-ethnic attitudes and contacts between ethnic groups in Estonia. Journal of Baltic Studies. 2009;40:121-137
45.Leetmaa K, Tammaru T, Hess DB. Preferences toward neighbor ethnicity and affluence: Evidence from an inherited dual ethnic context in post-soviet Tartu, Estonia. Annals of the Association of American Geographers. 2015;2015(105):162-182
46.Kivistik K. Eesti elanike keeleoskus ja -kasutus, inimestevahelised kontaktid, sallivus ning eesti keele väärtustamine. In: Eesti ühiskonna lõimumosmonitooring 2020. Estonia: SA Poliitikauuringute Keskus Praxis, Balti Uuringute Instituut, Tallinna Ülikool, Tartu Ülikool, Turu-uuringute AS; 2020. Available from: https://www.kul.ee/eesti-integratsiooni-monitooring-2020 [Accessed: 02 February 2022]
47.Kern A, Marien S, Hooghe M. Economic crisis and levels of political participation in Europe (2002-2010): The role of resources and grievances. West European Politics. 2015;38:465-490
48.Jo J-I, Choi HJ. Enigmas of grievances about inequality: Effects of attitudes toward inequality and government redistribution on protest participation. International Area Studies Review. 2019;22:348-368. DOI: 10.1177/2233865919833973
49.Jackson JW. Realistic group conflict theory: A review and evaluation of the theoretical and empirical literature. The Psychological Record. 1993;43:395-413
50.Esses VM, Jackson LM, Armstrong TL. Intergroup competition and attitudes toward immigrants and immigration: An instrumental model of group conflict. Journal of Social Issues. 1998;54:699-724. DOI: 10.1111/0022-4537.911998091
51.Melesk K, Masso M. Hõive ja toimetulek. In: Eesti ühiskonna lõimumismonitooring 2020. Estonia: SA Poliitikauuringute Keskus Praxis, Balti Uuringute Instituut, Tallinna Ülikool, Tartu Ülikool, Turu-uuringute As; 2020. Available from: https://www.kul.ee/eesti-integratsiooni-monitooring-2020 [Accessed: 01 February 2022]
52.Vetik R, Kunitsõn N, Koppel K, Shaharyar N, Polõnin I. Eesti ühiskonna lõimumise suur pilt. Segregatsioonist sisususeni. In: Eesti Ühiskonna Lõimumismonitooring 2020. SA Poliitikauuringute Keskus Praxis, Balti Uuringute Instituut. Estonia: Tallinna Ülikool, Tartu Ülikool, Turu-uuringute As; 2020. pp. 101-117
53.Maasing H, Nahkur O, Ainsaar M, Roots A. MICRI: A composite index for measuring the risk of immigration-related conflicts. Individual and Society. 2021;2021(24):1-24. DOI: 10.31577/cas.2021.04.592
54.Gini Coefficient Calculator. Available from: https://www.had2know.org/academics/gini-coefficient-calculator.html [Accessed: 02 February 2024]
55.Inglehart R. Mapping global values. Comparative Sociology. 2006;5:115-136
56.Roder A, Mühlau P. Are they acculturating? Europe's immigrants and gender egalitarianism. Social Forces. 2014;92:899-928
Written By
Mare Ainsaar, Helina Maasing, Ave Kovaljov and Oliver Nahkur
Submitted: 31 January 2024Reviewed: 07 February 2024Published: 11 March 2024