Open Access is an initiative that aims to make scientific research freely available to all. To date our community has made over 100 million downloads. It’s based on principles of collaboration, unobstructed discovery, and, most importantly, scientific progression. As PhD students, we found it difficult to access the research we needed, so we decided to create a new Open Access publisher that levels the playing field for scientists across the world. How? By making research easy to access, and puts the academic needs of the researchers before the business interests of publishers.
We are a community of more than 103,000 authors and editors from 3,291 institutions spanning 160 countries, including Nobel Prize winners and some of the world’s most-cited researchers. Publishing on IntechOpen allows authors to earn citations and find new collaborators, meaning more people see your work not only from your own field of study, but from other related fields too.
This chapter highlights the diversity of Ethiopian fish species across 12 drainage basins. These include the Wabishebele-Genale, Abay, Omo-Gibe, Awash, Rift Lakes, and Baro Akobo basins. Ethiopia’s lakes, rivers, and reservoirs harbor over 200 fish species, categorized into East African, Nilo Sudanic, and endemic forms. The Nilo-Sudanic species are most diverse, particularly in the Abay, Baro-Akobo, Omo-Gibe, and Tekeze basins. Highland lakes and northern Rift Valley lakes host East African forms. Each of the seven drainage basins holds varying numbers of fish species, with high levels of endemism in the Abay, Rift Valley, and Awash basins. Endemic species counts are as follows: Abay (23), Rift Valley (7), Awash (6), Omo (2), and Baro (1). Rapid population growth, unemployment, and ineffective fisheries management threaten fish diversity. To prevent further degradation, urgent watershed management actions such as forestation, soil conservation, controlled grazing, and banning hillside crop farming are imperative in Ethiopia.
*Address all correspondence to: wabeniezer@gmail.com
1. Introduction
Because freshwater is a necessity for all life, it plays a crucial role in socioeconomic development. However, diverse fresh water ecosystems are frequently threatened by activities both on land and in water bodies, putting them at risk. Determining the number of different fish species in fresh water ecosystems is important there for conservation and management. Losses in biodiversity occur at very high rates worldwide, largely because of human activity. Conservationists are concerned about this loss, and they are working hard to protect as much of the remaining diversity as possible.
Knowledge of an area’s biodiversity is essential for creating effective conservation strategies [1]. Norris [2] asserted that an ecosystem’s species diversity can serve as a barometer of its health. However, a major issue in the modern era is the rapid decline in biological diversity caused by habitat loss and environmental degradation [3]. The inland bodies of water in Ethiopia (Lotic and Lentic) are rich in edible fish resources, which ichthyologists find valuable. This is because Ethiopia’s fish fauna is made up of a variety of East African, Endemic, Ethiopian Highlands, and Nilo-Sudanic species [4, 5]. A total of 175 valid fish species and subspecies from 12 orders and 25 families were identified [6, 7]. According to Golubtsov and Mina [8], 168–183 valid fish species have been found in Ethiopia’s freshwater bodies. Between 37 and 57 endemic fish species are thought to exist nationwide [8].
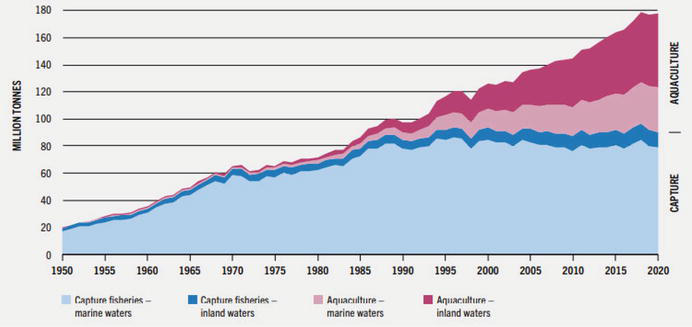
Aquaculture is a sector of the food industry that expands and produces foods that are high in protein. The total quantity of aquaculture-produced food fish that is consumed by humans, including crustaceans, fish, mollusks, and other aquatic animals, was 52.5 million metric tons in 2008 [9]. The quantity intended for human consumption in 2019 (excluding algae) reached a peak weight of 20.5 kg, and in 2020, it slightly decreased to 20.2 kg per person, which is still more than twice as much per person as the 1960s’ average weight of 9.9 kg. Approximately 600 million people’s livelihoods are considered dependent on fisheries and aquaculture, at least in part, including workers in the secondary and tertiary sectors as well as their dependents. The number of people working in the primary sector was approximately 58.5 million people. Due primarily to the COVID-19 outbreak in 2020, only around USD 151 billion was produced by fisheries and aquaculture products, less than the US dollar record high of 165 billion in 2018 [10]. A record 180 million metric tons of aquaculture has been produced globally (Figure 1), 127 million metric tons more than in 2008, owing to expansion in China, Chile, and Norway [10].
Figure 1.
Capture and aquaculture production on a global scale (excluding aquatic mammals, crocodiles, alligators, caimans, and algae) [10]. Live weight equivalent is the unit of measurement for data.
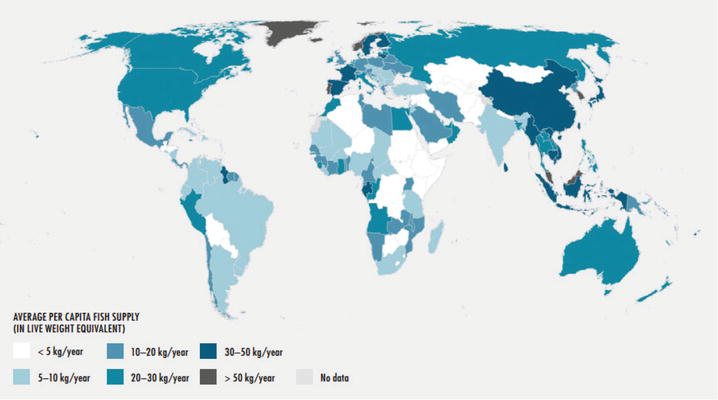
Consumption of aquatic foods is anticipated to increase by 15% to 21.4 kg/person on average in 2030, owing to rising income, urbanization, better post-harvest practices, and dietary trends [10]. Worldwide, people consume more than 100 million tons of fish each year, providing at least 20% of the average amount of animal protein consumed by 2.5 billion people and up to 50% or more in developing nations. Although these levels are still low, fish protein is essential as a significant portion of the animal protein consumed in some regions where food insecurity and malnutrition are most prevalent, such as Asia and Africa. Global fish consumption statistics obscure the significant regional variations between and within nations. As a result of the impact of geographical, cultural, and economic factors, along with accessibility to and proximity to fish landings and aquaculture facilities, fish consumption varies significantly by individual, from less than 1 kg to 100 kg annually. Despite the fact that there are still observable variations in the quantities of fish eaten between different countries and regions of the world (Figure 2), some distinct trends can still be observed.
Figure 2.
Estimated amount of fish consumed per person, average 2015–2017 [10].
2.2 Status of aquaculture in Africa
Between 2003 and 2007, aquaculture production in Africa increased by 56% and over 100%, respectively, in both volume and value. This growth was fueled in part by rising aquatic product prices, the emergence and growth of small and medium-sized aquaculture businesses, significant investments in cage culture, and the expansion of larger commercial endeavors, some of which produced high-value goods for markets abroad [9]. Several phylogenetic taxa that are old and isolated (e.g., Lungfish, Polypteridae, Protopteridae, and Bichirs) are common in this region [11]. Although the vast river systems of the continent are also fishery-rich, accounting for up to 50% of the total inland catch, lakes contribute significantly to inland fisheries [12]. The diverse species flocks that the African ichthyofaunal includes as a result of adaptive radiation give it an additional distinction [11]. For instance, flocks of various cichlid species can be found in Malawi, Tanganyika, and the Great Victoria Lakes of East Africa, and Labeo barbus, which can be found in Lake Tana (Ethiopia).
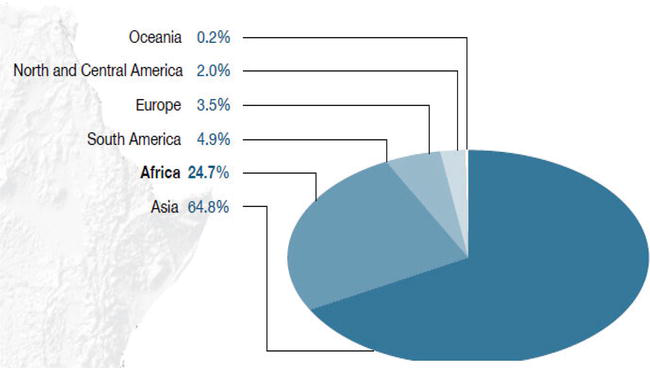
According to the FAO [13], Africa contributes very little to the production of fisheries worldwide, with only 7% of the total production coming from regional capture fisheries, becoming the second largest region after Asia in terms of this population. Despite the fact that Africa makes a minimal overall contribution to each of these sub-regions, 3 million tons are produced by inland waters, which account for 25% of all global inland fishery production (Figure 3). Because of this comparison, artisanal fishing in Africa is valued, particularly, the significance of continental lakes, such as Lake Victoria. This context is crucial in places with high level of poverty.
Figure 3.
Inland capture fishing by continent [13].
Africa appears to lag behind global growth in aquaculture. Aquaculture in Africa is relatively rare. There are several reasons for this, but the primary reason is that the industry is not viewed as a commercial enterprise. Even in areas where it is not commercialized, aquaculture in Africa can benefit from sound fisheries management techniques that will help protect these significant food production sectors. Recent data show that the region’s aquaculture industry is growing faster than the average for the world [13], and presently makes up 15–19% of all fish produced.
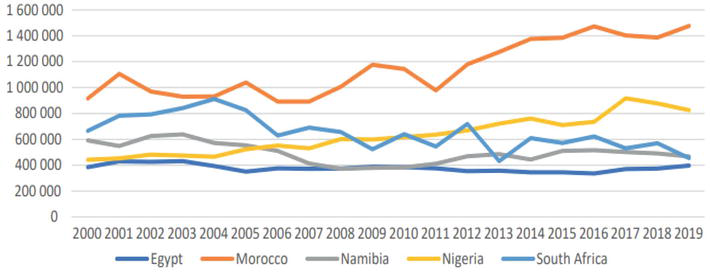
Figures 4 and 5 depict the variations in wild capture, fisheries and aquaculture practices among the five pioneer fish-producing nations in Africa.
Figure 4.
Tons of wild fish produced overall between 2000 and 2019 in the five selected African nations [13].
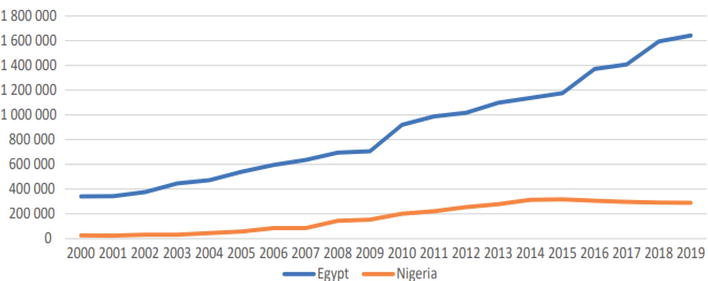
Figure 5.
Total tons produced by aquaculture in Egypt and Nigeria between 2000 and 2019 [13].
Fish consumption in Africa was the lowest at the regional and continental levels, reaching a peak of 10.5 kg in 2014 and starting to fall to 9.9 kg in 2017 (Table 1). Nevertheless, demand in Africa varied, with West Africa having a per capita intake of 12 kg and East Africa having a per capita intake of 5 kg. Between 1961 and 2017, North Africa experienced significant growth (per capita from 2.9 kg to 14.7 kg), but sub-Saharan Africa experienced stagnant or declining per capita fish consumption. Several interrelated factors contribute to sub-Saharan Africa’s low fish consumption, including population growth, outpacing the availability of fish for food; stagnation in fish production due to stress on resources from capture fisheries; and an underdeveloped aquaculture industry. Low-income levels, poor infrastructure for landing, storing, and processing fish, a lack of fish product sales channels for marketing and distribution, and all these factors contribute to the low consumption of fish. It should be noted, however, that actual values in Africa are likely greater than official statistics indicate because the contribution of a few artisanal fisheries, subsistence fishing, and unrecorded cross-country trade is underreported.
Region/economic grouping
Total food fish consumption (million tonnes live weight equivalent)
Per capita food fish consumption (kg/year)
World
152.9
20.3
World (excluding China)
97.7
16.0
Africa
12.4
9.9
North America
8.1
22.4
Latin America and the Caribbean
6.7
10.5
Asia
108.7
24.1
Europe
16.1
21.6
Oceania
1.0
24.2
Developed countries
31.0
24.4
Least developed countries
12.4
12.6
Other developing countries
109.5
20.7
Low-income food-deficit countries
23.6
9.3
Table 1.
Consumption of fish overall and per person by region and economic grouping, 2017 [13].
2.2.1 South Africa
With a 0.5 percent Gross Domestic Product (GDP) contribution and 4000 direct jobs, the fishery industry in South Africa is comparatively small in terms of employment, according to Augustyn et al. [14]. Relatively 140,000 jobs depend on these industries. The most recent estimate of the value of all fishery landings is 700 million USD. The biggest and most lucrative commercial sectors are deep-sea trawls, purse seines (small pelagic purse seines), squid jigs, offshore west coast rocks, lobster traps, and line and net fisheries [15]. The government has recognized marine aquaculture as a developing industry that deserves support despite the fact that it remains in its toddlerhood in terms of aquaculture, with a projected worth of USD 34 million [14].
2.2.2 Namibia
After Mauritania, South Africa, and Morocco, Namibia is the continent’s fourth-largest nation in terms of catch fisheries. Hake and horse mackerel are the two primary commercial species caught in Namibia. The large pelagic tuna, deep-water crab, monkfish, rock lobster, and orange roughly are different species with more recent significance. The fishing industry exported approximately USD 680 million in 2016, ranking second after mining in terms of foreign exchange earnings. The fishing industry employs 16,800 people directly, with hake fishing and processing accounting for 70% of all jobs. Along with mariculture processing, horse mackerel is a growing industry that creates new jobs [16, 17]. In terms of aquaculture, mariculture is a growing sector primarily based on Lüderitz Bay and Walvis Bay, according to ATFALC [18]. Mariculture production in Walvis Bay and Lüderitz Bays, which totals less than 2000 tons annually, includes onshore abalone production as well as farms for oysters, mussels, and other shellfish.
2.2.3 Morocco
Approximately 3% of Morocco’s GDP is derived from fishing. According to Cervantes et al. [19], in 2017, 1.4 million tons were thought to have been caught in 2017. Most harvests were made on the Atlantic side. Small pelagic species, including anchovies and sardines, were the primary species caught (approximately 70 percent). The sector of high-sea tuna species is the main target of fishing, which is caught by alien ships, primarily from the fleets of Asia, Russia, and the European Union. When considering the direct and indirect jobs generated by small-scale fisheries, the number of individuals directly employed in Moroccan fishing in 2017 reached 400,000. However, the scarcity of processing, harbors, and infrastructure facilities means that small-scale sectors are still largely underdeveloped. Production from aquaculture is rather meager, with an estimated 1200 tons produced in 2017 and 250 employed people.
2.2.4 Nigeria
The fishing sector is rounded to the nearest half of Nigeria’s GDP. It was reported that 734, 731 tons were produced in total in 2016. The fishing business is varied, with 36% coming from marine and wild catch, 33% from inland water systems, and 31% from aquaculture. More than 80% of Nigeria’s domestic catch fisheries are produced by artisanal small-scale fishers who live in the coastal, inshore creeks, lagoons, interior rivers, and lakes of the Niger Delta. Nigeria is the top producer of aquaculture in sub-Saharan Africa, specializing in fresh and brackish water aquaculture. Approximately USD 840 million is the off-farm value of 291,000 tons of this product was produced in 2018 [13]. Production of freshwater is mostly to blame for this. Catfish, which typically grow in ponds and tanks and account for more than 50 percent of all aquaculture production volume, is the most widely farmed species in Nigeria.
2.2.5 Egypt
Over the last ten years, the yield of fish caught has remained largely stable, at 350–400000 tons. In the past 20 years, aquaculture production has increased significantly and as of 2003, it has surpassed the wild catch. Fish production accounted for 75% of the country’s total production, or 1.56 million tons and was said to have come from aquaculture in 2018. Tilapia is the most prevalent species in freshwater and inland reservoirs, followed by the flathead gray mullet. The nation’s aquaculture ponds cover approximately 115,000 hectares. Sea bass and sea bream are the two most important species in marine culture, although prawns and other species, such as meager (drum) are also produced in modest amounts.
2.3 Overview of fisheries development in Ethiopia
The lentic and lotic inland water bodies in Ethiopia are rich in resources for edible fish, which ichthyologists are particularly interested in. The country has been recognized for having a significant amount of physically accessible freshwater resources, including 122 billion metric cubic (BMC) of mean annual flow distributed among 12 river basins, 4.5 BMC underground, 9 saltwater lakes; 11 freshwater lakes; 12 major marshes; and craters, the majority of which are situated within the Rift Valley Basin [20]. Tesfaye and Wolff [21] stated that most lakes are endorheic because they have no surface water outlets, except for Ziway, Tana, Langano, Abaya, and Chamo. Ethiopia has less potential for ground water than surface water resources. According to research, the nation also has numerous lakes and reservoirs, numerous small water bodies, and expansive floodplain areas that are dispersed throughout the entire nation and cover an estimated 13,637 km2 of land (Table 2), or 1.2% of Ethiopia [23, 24]. There are numerous significant lakes, rivers, and small bodies of water, such as swamps, floodplains, ponds, and canals for irrigation with a smaller than 10 km2 area [25]. Sadly, many of these water bodies in Ethiopia have not yet been studied, and many of them, because of their wetlands and unlisted locations, are still a mystery to scientists and academics.
Water resources
Total area (km2)
Total length (km)
Annual produce estimations (tons/year)
Mean
Per unit length
Large lakes
7740
—
39,262
5.8 ± 0.6
Large Reservoirs
1447
—
7879
6 ± 0.6
Small bodies of water
4450
—
25,996
4.1 ± 0.4
Rivers
—
8065
21,405
2.4 ± 0.9
Total
13,637
8065
94,541
Table 2.
Summary of the various water bodies’ production estimates in Ethiopia [22].
The nation’s inland waters are home to species that are endemic to the Ethiopian highlands, Nilo-Sudanic, and East African Ichthyofauna [4, 5, 26]. Additionally, approximately ten exotic species of fish have been introduced into the freshwater ecosystems of Ethiopia from abroad for many reasons, including the prevention of malaria and weeds (Table 3) [28].
Rivers
Catchment area(Km2)
Length within Ethiopia (km)
Potential yield estimates
1o Model
2o Model
Weight Per Unit length (ton/km)
Baro
38,400
285
839
232
2.3
Akobo
21,890
203
487
119
2.1
Gillo
13,050
252
295
182
1.7
Alwero
8098
321
185
294
1.6
Pibor
4300
96
100
27
1.5
Blue Nile
176,000
800
3675
1792
3.2
Awash
112,696
1200
2385
3999
3.1
Wabi-Shebele
202,697
1000
4215
2787
3.4
Genale
171,042
480
3575
652
3.5
Omo
79,000
760
1690
1619
2.3
Tekeze
82,350
608
1759
1041
2.2
Mereb
5900
440
136
549
1
Angerib
23,812
220
528
139
1.3
Miscellaneous small rivers
196,259
1400
4085
5426
3.8
Total
1,135,494
8065
23,954
18,855
2.4 ± 0.9
Table 3.
Estimates of the potential fish production in Ethiopian Rivers [21, 27].
Commercially exploited lakes are about 6500Km2, and yields per annum do not exceed 23,000 (Table 4).
Water bodies
Main landing site
Area (Km2)
Fish Yield Possible (ton/ year)
Abaya
Arba Minch
1070
600
Awassa
Awassa
91
611
Chamo
Arba Minch
350
4500
Koka reservoir
Koka
255
700
Langano
Oittu
230
240
Lugo
Lugo
25
400
Tana
BahrDar
3500
10,000
Turkana
Ethiopian (1.3% total area)
94
750
Ziway
Ziway
434
2941
Total
6477
23,342
Table 4.
Commercially exploited lakes, landing areas, and potential fish yield [21, 27].
Too many fish species can be found in the country’s rivers and streams than in lakes and reservoirs. The most significant fish for commerce were Oreochromis niloticus, Clarias gariepinus, Barbus species, Cyprinus carpio, and Carassius carassius. The Main River and miscellaneous small river systems of the country account for approximately 1,135,494Km2 and more than 20,000 potential yield estimates (Table 3).
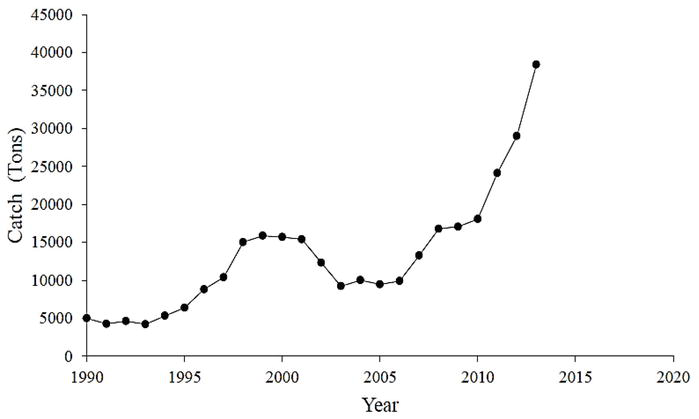
The majority of fish eaten in Ethiopia are caught from the wild using artisanal (small-scale) techniques. Of the nation’s estimated annual fish production, which is approximately 51,481 tons for major water bodies (Table 4), only about 38,400 tons have recently been consumed (Figure 6) [29].
Figure 6.
Trends in the nation’s got fish catch from 1990 to 2010 (according to the Federal Ministry of Agriculture and the Central Statistics Office website, both of which were cited by Brook Lemma in 2012 and from 2011 to 2013) [29].
2.4 Ethiopia’s drainage basins and fish diversity
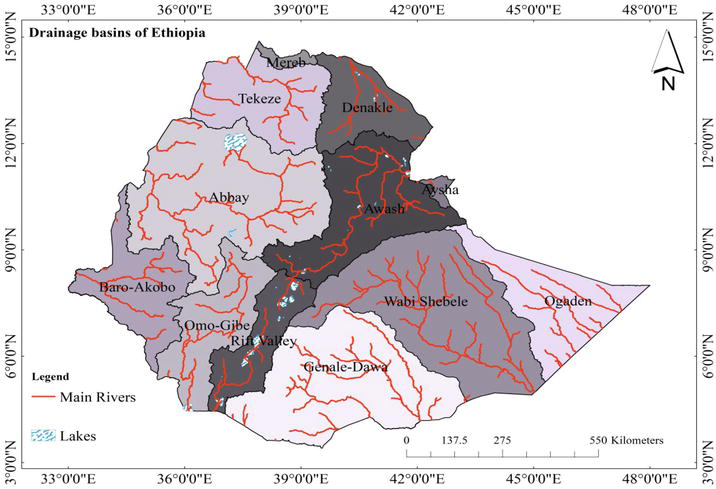
Based on faunal similarities (particularly fish fauna) and the African freshwater ecoregion model, Ethiopia’s freshwater systems were conveniently classified into five freshwater ecosystem types in 12 drainage basins (Figure 7) [30].
Figure 7.
Drainage basins of Ethiopia (Source: ArcMap by Abenezer Wendimu).
It consists of rivers, streams, and lakes in the highlands of the country, including Lake Tana, lakes in the rift valleys such as Lakes Abaya and Chamo, and Lake Turkana (including the Omo River and its tributaries and Lakes Abaya and Chamo). The Wabi-Shebele, Genale, Dawa, and Fafan river basins, as well as the coastal basins of the Red Sea, lie between Shebele and Juba (including the Awash system and the salt lakes of northern Ethiopia, including Lake Abbe, Afambo, Afdera, and Asale).
Golubtsov and Darkov [31] argued that there are six main watersheds that can be used to further subdivide freshwater ecoregions (Table 5). These include Rift Valley, Omo-Gibe-Turkana, Shebele-Juba, Blue Nile, White Nile (Baro-Akobo) and Tekeze-Atbara. The country’s drainage system is the result of an uplift that occurred in Ethiopia during the tertiary period, forming the Rift Valley and two highlands [33, 34].
Drainage systems
Number
Family
Genera
Species
Wabi-Shebele and Juba
12
21
33
Tekeze-Atbara
10
22
34
Rift Valley
11
18
28–31
Omo-Turkana
20
42
76–79
Baro-Akobo
26
60
113
Abay
16
37
77
Table 5.
Six drainage systems contain a variety of fish [32].
The predominant fish species in the Baro, Akobo, Omo, Gibe, Tekeze, and Blue Nile basins (Table 5) were Nilo-Sudanic forms. Additionally, some of these fish can be found in the Southern Rift Valley and lakes of the Shebele Genale system (Abebe, [4]). Due to the historical and continuing connection of the watershed with the river systems of Nile, West, and Central Africa, these systems contain elements of Nilotic fish [26]. The genera represented by these fish were Mormyrus, Malapterurus, Labeo, Hyperopisus, Hydrocynus, Citharinus, Barilius, Bagrus, Alestes, Polypteus, and Protopterus. South of the Rift Valley and in portions of the Shebele–Genale Basin, these forms are present (lakes Abaya and Chamo). These lakes and watersheds are thought to have been connected to the Upper White Nile by Lake Rudolph 7500 years ago [35]. These forms are believed to be related to West African fish, as the Nile was once connected to the river systems in Central and West Africa.
The highland East African forms are found in the lakes of the northern Rift Valley, including Lakes Hawassa, Zuway, and Langano; highland lakes Tana and Hayq; and associated river systems, as well as the Awash Drainage Basin. Among them are the genera Clarias, Garra, Oreochromis, Barbus, Labeo, Barbus, and Varicorhinus. They are related to fish from Eastern, Northern, and Southern Africa. Some elements are present in the waters of western Africa. For instance, the widely dispersed cyprinid species G. dembeensis is found in six distinct nations (Tanzania, Kenya, Cameroun, Ethiopia, Egypt, and Nigeria). The Awash and Northern Rift Valley lakes are almost devoid of Nilotic river fish [30].
Considering the size of the nation, the ichthyofauna of Ethiopia does not appear to be very numerous. Lowland waters have no known endemic species, but the waters of the Ethiopian plateau have a high endemism rate [30]. The fish ichthyofauna of these streams is dominated by two fish genera (Barbus and Garra). Afronemacheilus abyssinicus is an odd endemic fish of the Ethiopian plateau [30]. In terms of number, richness, and diversity, the endemic forms have an uneven distribution of fish species among the drainage basins. Since the lakes and rivers are relatively accessible, there is a high chance of discovery, which may contribute to the uneven distribution of species within the major drainage basins.
The Omo-Gibe, Wabi-Shebele, Tekaze, and Rift Valley basins around Lake Abay are next in order of species diversity, then the Baro Basin [31]. The rich and diverse habitats that makeup part of this high diversity are also likely justification for the relatively high level of exploration and collection that has occurred in these easily accessible bodies of water. However, the highest endemism appears to be in the Abay and Awash basins. This is due to the ‘species flock’ of Lake Tana and endemic fish species that have evolved into special habitats in the creeks of the highlands of northern and central Ethiopia. Lake Tana is home to 28 species and 1 subspecies, 20 of which are endemic to Ethiopia. According to Getahun et al. [30], Lake Tana is home to 18 endemic species.
2.4.1 Baro-Akobo Basin
The southwest highlands are relatively small, rounded mountain remnants that are divided by established river valleys and are located south of the Abay [36]. These mountains and hills give rise to a number of the Baro-Akobo basin’s tributaries. Major river systems in the basin include the BaroKela, Gilo, Akobo, Baro, Sore, Geba, Birbir, Alwero, Bonga, and Jejebe Rivers. The southern Ethiopian plateau provides the majority of the water for the Sobat, as the so-called Baro-Akobo is known outside of Ethiopia.
The White Nile system in Ethiopia is home to 107 fish species that are divided into 54 genera and 23 families. Only one of the 87 fish species, Afronemacheilus abyssinicus, according to Getahun [35], is unique to this basin [8]. More recently, 113 fish species from the same basin were found in 60 genera and 26 families, according to Golubtsov and Darkov [31]. The most varied fish fauna is found in the White Nile system, which is located in Ethiopia. Other drainage systems do not contain the following six families: Protopteridae, Notopteridae, Nothobranchiidae, Cromeriidae, Channidae, and Anabantidae [31]. Mormirids sp., Malapterurus sp., Lates niloticus, Labeo horei, Hydrocynus sp., Heterotis niloticus, Gymanrchus niloticus, Bagrus, Barbus sp., and Alestes sp. are the fish species that are most important for commerce. There are about six endemic species in this drainage basin, and there is no information on exotic/alien species of fish. For Ethiopia’s development of fish culture, the watershed’s diverse fish fauna in low-lying areas is a valuable resource [31].
2.4.2 Blue Nile basin
Lake Tana is the source of the Blue Nile, which flows into central and northwestern Ethiopia. It is Ethiopia’s principal river, flowing at about 50 billion cubic meters annually between Lake Tana and the Sudanese border over a distance of 1000 kilometers [36]. Its water system includes the Dinder River, which empties into the Blue Nile far below the Sudan reservoir, and Lake Tana, Ethiopia’s largest lake, and its tributaries. It also has several basins, including the Didessa, Beles, Jemma, and Dabus Rivers, as well as the Koga and Fincha basins [37]. Despite having a drainage area of only 324,000 km2, the entire Nile system receives 58% of its water from this area and the vast bulk of soil particles/sediment from Egypt’s deltas and alluvial river valleys [38]. The lower basin, specifically the Jamma, Guder, Didessa, and Dabus Rivers, is where the majority of the Blue Nile flood’s water comes from. In the southwest region of the country, where rainfall is heavy, Didessa and Dabus rise on the left bank. Another group of important tributaries include the Beshilo, Dabena, Anger, Mugger, Belessa, and Wonchit. Within Ethiopian borders, the Blue Nile drainage was home to 30 different fish species [39]; JERBE, on the other hand, listed 77 species of fish belonging to 16 families and 37 genera. Cyprinidae is the most varied family of fish. The Blue Nile drainage system has a large number of endemic species (a total of at least 24 endemic species). The cyprinids that are unique to the Lake Tana sub-basin made up one-fourth (19 species) of the total species count.
Three fish species were introduced into Ethiopia and were shown by Golubstov and Mina [40] to be a component of the drainage network for the Blue Nile. One species from each of the three families serves as representation. The Afronemacheilus abyssinicus, Clarias gariepinus, and Oreochromis niloticus species are the representatives of the Cichlidae, Claridae, and Balitordae, respectively. Cyprinidae, the family of fish with the most members in the lake, is portrayed by the following genera such as Varicorhinus, Labeo, barbus, Barbus, and Garra [30]. Barbus is the genus that houses the Labeo barbus species found in Lake Tana. However, the name Labeobarbus is now used for the large hexaploid African barbus [41]. The brand-new genus name more accurately conveys their phylogenetic separation from other Barbus species, which were previously grouped together. Different Labeobarbus species have different reproductive methods in addition to resource allocation (feeding) [42]. The “small” barbs are categorized under the genus Barbus, which has three species: B. pleurograma, B. tanapelagius, and B. humilis [43]. There is only one species of Varicorhinus, V. beso. According to Stiassny and Getahun [44], four species make up the genus Garra: G. tana, G. dembecha, G. dembeensisis, and G. regressus. After the cyprinid species in Lake Lanao disappeared due to overexploitation, 15 different species of Labeobarbus now form the world’s sole cyprinid species congregating in Lake Tana.
2.4.3 Tekeze-Atbara Basin
This basin includes the rivers that drain the northeast of the country. The Tekeze River, which merges with Sudan’s White Nile and Blue Nile rivers to form the Nile, as well as the Guang River, also known as the Atbara River, are included in the drainage system [37]. The sources of its tributaries are on the Ethiopian High Plateau, which is close to the Blue Nile and lies to the east and west of Lake Tana [36].
The fish fauna of the Tekeze-Atbara drainage system was unknown prior to the JERBE survey of this area, according to Tedla [39]. Three endemic species, 2 introduced (exotic) species, 10 families, 22 genera, and 34 fish species were recorded by JERBE from the Tekeze-Atbara drainage within the limits of Ethiopia.
2.4.4 Omo-Turkana Basin
Kafa is the source of the Omo River, which flows south into Lake Turkana [45]. The Omo River basin stretches from the west highlands of southern Kenya to the semi-arid Omo lowlands. Ninety percent of the lake’s yearly inflow goes into the richly diverse Omo delta, and 14% of Ethiopia’s yearly runoff comes from there, changing in response to changes in lake level [46]. There is evidence that the Nile and this basin have previously connected more than once when it was wet and pale climatic fluctuations [47]. In Kenya and Ethiopia, there are 130,860 km of Lake Turkana watershed. The lake is the fourth-largest lake in Africa and the largest desert lake in the entire world. Ethiopia’s largest river system is the Blue Nile, and the second largest in terms of runoff volume is the Omo basin. As a closed basin, Lake Turkana inflows gradually evaporate, leaving the lake’s waters nearly salty, unfit for human consumption, and unusable for agriculture.
The Omo River empties into Lake Rudolf, also known as Lake Turkana, on the Kenyan border. The southwest portion of the country’s western highlands is drained by a number of rivers, including the Gibe River in the Omo River watershed [26]. Before the JERBE study, only 13 species had been identified within Ethiopia’s borders of the Omo drainage system [39]. The Omo-Turkana Basin is home to between 76 and 79 fish species, which belong to 20 families and 42 genera. The Omo River system contains up to eight endemic fish species, or about a quarter of the fish fauna of the system. As of yet, no introduced species have been found [31].
2.4.5 Shebele-Juba Basin
Originating in the Bale Mountains and Ahmar, respectively, Wabi-Shebele and Dawa Genale Gastro flow southeasterly toward Somalia. Genale-Dawa River is the Ethiopian name for the Juba River, claimed by Basnyat and Gadain [48]. In its upper catchment, the Juba River’s principal tributaries are the southeast-flowing Wabi Dawa, Genale, and Wabi Gastro. Fourteen fish species were listed as coming from this drainage system before JERBE, according to Tedla [39]. The Juba and Wabi-Shebele Drainage Basins are among the basins in the nation with the largest catchment areas and the least amount of research done on their fish populations. Thirty-three species of fish from 21 genera and 12 families have been described in the works of the JERBE group [31]. The most distinctive ichthyofaunal species of the Nilotic and East African fish taxa are found here, including the cichlid Alestesaffinis and the characin Alestesaffinis (Oreochromis spilurus). According to Golubstov and Mina [40], the eel Anguilla sp., a diadromous fish, is only found there in Ethiopia.
2.4.6 Rift Valley Basin
The main Ethiopian rift in the country’s center is the Afar Rift System, and the largely rifted zones of southwest Ethiopia are the three main geological zones that make up the Ethiopian Rift Valley, which is the northernmost segment of the East African Rift system [49, 50]. The lakes in the southern part of Ethiopia are Lake Abaya and Lake Chamo. These lakes are located in the north: Zuway, Abijata, Shala, Langano, and Awassa. The salty northern lakes include Afdera, Gamari, Asale, Afambo, and some of Abbe. The crater lakes (Lake Arenguade, Bishoftu, and Hora) and the Bishoftu group and Chitu are all in the Rift Valley Basin of the country [4].
The most diverse fish fauna is found in the southern Ethiopian Rift Valley (Lake Abaya and Chamo), where there are 20 different species of fish, and the river basin in the Awash watershed has 11 different species of fish, which is about 37% of the overall fish weight in great in the Rift Valley of Ethiopia [8]. Taxonomically, the valley holds more than 30 diver species of fish in 18 genera and 11 families, with four introduced and five endemics [31]. Ethiopia’s larger cities and administrations in small and large towns provided edible fish species largely from Tana Lake (more than 50%) in the northern part of the country and other Rift valley lakes (40%), according to Tesfaye Wudneh [51].
2.5 Fishery activities
Fishing is a dynamic and expanding industry, according to FAO (2004), because it employs labor-intensive harvesting, processing, and distribution methods to take advantage of marine and freshwater fish resources. This subactivation sector’s, whether done part-time, full-time, or only seasonally, regularly aims to provide fish and fishery produces to home consumption as well as regional markets. However, over the last decade or two, market consolidation and increased globalization have increased export-oriented production in many small-scale fisheries.
Various levels of organization operate on a small scale, including sole proprietorships, formal economic enterprises, and informal microenterprises engaged in fish production. The lack of uniformity within and across nations and regions must be taken into account when developing strategies and policies to increase this subsector’s contribution to food security and poverty reduction. The fisheries that still operate today typically involve fishing households (as opposed to commercial enterprises), have little money and effort, few (if any) small fishing vessels, and are primarily driven by local consumption. It involves a short trip near the intended coast. The most frequently used terms, either singly or in combination, when referring to small-scale fishing are “subsistence,” “traditional,” “peasant,” “artisanal,” and “inshore.” According to Kurien [52], small-scale fishing differs from medium- and large-scale fishing in the following ways (Table 6).
Characteristics
Small-scale
Medium-scale
Large-scale
Range of value of output per crew per annum (USD)
200 to 1500
Over 8000
Over 15,000
Range of fuel consumption per unit per annum (tones)
1–60
400–450
1600–1800
Range of fish harvest per unit per annum (tones)
2–100
200–1200
5000–8000
Range of fish harvest per ton of fuel (tones)
2–3
2–3
3–4
Investment range per unit
1–80
300–4000
10,000–40,000
Estimated number of units
3,200,000–3500,000
30,000–32,000
5000–5500
Crew range per unit
1–5
25–30
40–60
Table 6.
Rough estimates of the characteristics of different scales of operation in fishery sources: Kurien [52].
2.6 Fishing gear technology
Long lines, hooks, gillnets, beach seines, and cast nets are among the equipment frequently used in Ethiopian fisheries [21]. In particular, the rivers of Ethiopia use a variety of traps, baskets made of plant materials, nets, wires, and scoops [53]. Nearly all of Ethiopia’s lakes are fished with gillnets, which account for most of the country’s commercial production (Table 4). Commercial catches are made with beach seines in the northern Rift Lakes, like Koka Reservoir, Lake Langano, and Lakes Ziway and Langano. Bagrus and Nile perch are caught in Abaya Lake using both surface and bottom longlines, respectively [54].
Additionally, it is employed in Lakes/Chamo to catch Nile perch [21]. Hook and line usage is frequently prohibited when fishing for subsistence [55]. On various lakes and rivers in the nation’s drainage basins, many other conventional tools are also used. For instance, in the Gumara River of Lake/Tana, scoop nets and fences are utilized [56]. The majority of the fisheries in the Baro-akobo Basin of the Gambella region use traditional gear [53]. Additionally, there are applications for poisons that are extracted from a variety of plants, such as Millettia ferruginea [53, 57].
2.7 Challenges of small-scale fishery development and prospects
2.7.1 Post-harvest losses
High temperatures cause fish to spoil quickly, which causes post-harvest loss. Getu et al. [58] estimated that 10–12 million tons of fish worldwide per annum, or 10 percent of total catch, are lost due to spoilage. According to a study report published by Ayalew et al. [59], post-harvest fish losses in Lake Hayq and Lake Tekez, Northern Ethiopia, were estimated to have cost 10,934,000 ETB in losses over a 6-year period. Post-harvest fish losses are attributed to a variety of factors, including limited access to markets, size, and species preferences, inadequate infrastructure for handling, processing, storage, and transportation of fish, and distance to major markets.
2.7.2 Limitations on marketing, inadequate infrastructure, and access to fishing gear
The insufficient processing and marketing of small-scale fisheries is caused by a number of things, including inadequate infrastructure, a lack of standard processing methods, and a lack of financial support [60]. Small-scale fishermen use their production inputs like feed and fingerlings and hire labor inefficiently from an economic standpoint [61]. Poor transportation and preservation facilities have an impact on Ethiopia’s fish marketing as well. According to a study by Sairam [62], the main marketing issue in the Lake Hawassa area is the absence of sufficient transportation, fish markets that are permanent processing and storage facilities, and customer perception.
According to Alemu et al. [63], there are significant issues with the necessary transportation and infrastructure in the Gidabo River and Lake Abaya fishery production systems. Fishermen are compelled to use hefty motorcycles and donkey backs to transport their goods in order to supply the market. Due to a lack of infrastructure, including electricity, fish handling, storage, and preservation techniques are not used. The fishermen offer discounted dried fish products to consumers, hotel owners, and fish traders in Gololcha or Dilla. Due to a lack of contemporary fishing gear and difficult access to markets, fishermen in all landing areas face unique challenges [62]. Additionally hard to come by in Ethiopia are the lead rope and floats needed for nets.
2.7.3 Overfishing
Due to fishermen’s lack of knowledge regarding the timing of first sexual maturity, overfishing may become a problem. The majority of fishermen (50.6%), according to Muluye et al. [64], were unable to determine yet if the fish they captured were mature or immature. Labeo barbus intermediuss caught in the Koka reservoir, according to Tesfahun [65], were undersized when they reached first maturity. In Lake Hawassa, juvenile fishing of a similar nature was seen (77.6% for Clarias gariepinus and 23.0% for Oreochromis niloticus) and Labeo barbus species (15%) for Lake Tana [66]. Overfishing and resource exploitation are also caused by the type and mesh sizes of fishing gear. The research conducted in Lake Ziway showed that the use of small mesh sizes was the main problem, which resulted in 43.33% overexploitation of the lake’s fish stock [64]. Poor legal and policy frameworks, as well as the improper application of current fishery laws and regulations, cause poor exploitation of fishery resources in all areas.
2.7.4 Urbanization, agricultural expansion, and wetland degradation
Small-scale fisheries’ ability to produce sustainably is being threatened globally by the destruction of aquatic ecosystems brought on by unsustainable fishing methods [67]. In Ethiopia, wetlands accounted for about (22,600 km2) of the country’s total land area. These wetlands areas have helped to protect a variety of pollutants, including sediments, chemicals, fertilizers, sewage from people and animals, animal waste, pesticides, and heavy metals [68]. Wetland areas are used by fish species like Labeo barbusnedgia, Garadembecha, Clarias gariepinus, and Labeobarbus intermedius, and for their breeding processes; however, in various Ethiopian lakes, the water shade was deteriorating more quickly [69].
Wondie [70] asserted that shoreline wetland stability was significantly threatened by industrial pollution, agricultural expansion, different activities around drainage systems, and removing wetlands’ trees for one’s own benefit and financial gain. Because fish breeding grounds were destroyed, Lake Ziway’s actual production fell from 2300 tons annually in 2003 to 1127 tons annually in 2011 [71]. FAO [29] stated that the main pollutants harming Ethiopian fisheries and water bodies come from agriculture and industrial sewage. Similar to how the effluents from the textile industries in Awassa and Arba Minch and the tannery at Koka Reservoir can affect the status of the fisheries, fish stocks might suffer as a result of Lake Abijata’s mineral extraction. It uses the lake water for its own purposes and discharges various pollutants and nutrients into the catchment, which has an impact on various Lake Biodiversity.
2.7.5 Climate change
Due to insufficient rains and droughts, which were made worse by El Nio in 2015, Ethiopia is dealing with a crisis of food insecurity and severe drought [53]. Certain country’s fisheries are declining due to climate change [72]. Higher inland water temperatures decrease available fish stocks by altering the trophic status and water quality of a particular aquatic ecosystem. The effects of climate change on agricultural crops can make fishing households more vulnerable; therefore, fishermen around Lake Langeno were forced to catch any fish, regardless of size [73]. The highest runoff occasionally occurred in various areas due to rainfall vibration, adding to the sediment load in the water bodies. Current issues in Lake Tana include sediment load and siltation [74]. Similar to this, changes in fish species diversity, size, and composition have been observed in Lake Ziway as a result of climate variability and change, as have changes in species distribution [75], potential species extinction [76], and decreased productivity [77].
2.7.6 Fish diseases
Diseases have an impact on fish production as well. According to Meko et al. [78], one issue facing the nation’s fishery industry is fish diseases. Fish disease and parasite conditions reduce the potential for fish production. It should be noted that poor water quality is the primary cause of the majority of parasitic diseases. The majority of parasitic organisms are opportunistic, potentially persistent in the tank or in small numbers on the fish, and only make fish sick when they are stressed [79]. Fish health is influenced by a variety of factors, including the type of filtration system, water temperature, the number of fish in a tank, lighting, pH, and chemistry of the water. It is the primary issue affecting both aquaculture and catch-based fishing around the globe. It might result in high mortality in a body of water or a fishing location. Aside from post-harvest production loss, ailments have been shown to be the cause of death in aquaculture and capture fisheries, and some are also the root cause of zoonotic human diseases in many parts of the world [24]. Overfishing and parasitic infections, for example, are causing a decline in Labeobarbus intermedius, according to Mengesha [80] and Dadebo et al. [79] reports; as a result, fish are becoming less available to local fish markets. According to the study assessment findings published by Bekele and Hussien [81], The parasite that caused fish the most trouble in Lake Ziway was Contracaecum. In the fish’s digestive tract, parasites like nematodes also made a contribution of 19.02% for Clarias gariepinus and 8.60% for Oreochromis niloticus [81].
2.7.7 Water hyacinth
Water hyacinths (Eichhorni acrassipses) are considered the worst invasive weeds due to their negative impact on aquatic ecosystems, fisheries, transportation, agriculture, living conditions, and social structures [82]. Fish kills brought on by dissolved oxygen depletion were caused by water hyacinth’s heavy use of and reduction of dissolved oxygen [83]. These weeds are now primarily to blame for the lakes’ declining fish production levels. Approximately 34,500 ha (or 15% of the northern shore) of Lake Tana have been reported as being infested with water hyacinth, according to Wassie et al. [84]. Because the expansion of water hyacinth interferes with their ability to fish, all fishermen changed their landing location. According to the same research report, water hyacinth caused a decline in Labeo barbus’ catch per unit of effort (CPUE), which fell from 63 kg/trip in 1991–1993 to 6 kg/trip in 2010. In relation to this, high water hyacinth infestation levels have also been noted in a number of other Ethiopian rift valley lakes, particularly Lake Koka, Lake Ellen, Aba-Samuel Dam, and Lake Wonji [85], which had a similar impact on the various sectors.
2.7.8 Prospects
The nation has started a number of initiatives to boost the economy and improve the standard of living for its citizens. Large dams and reservoirs would be built, as specified in the GTP plan, with the primary goal of producing electricity. Others are dammed to hold water for agriculture that depends on irrigation. These bodies of water can be used to integrate cultured fisheries and increase fishing output nationally. Some success stories include fish production in Koka, Fincha, Gilgelgibe I, Melkawakena, and Tendaho reservoirs. However, in addition to recently constructed sugar cane factories and small to medium-sized irrigation facilities, more reservoirs will be used for fish production without affecting the reservoirs’ primary function. Along with other hydroelectric dams in the Genale and Omo-Gibe basins, the massive Ethiopian Renaissance Dam on the Abay (Nile) River will soon be constructed in areas of the nation with high fish production. In order to stock such large bodies of water, this technology needs facilities for transportation, fish seed, and feed production. Therefore, the concerned ministries and institutions will need to make preparations in advance for adequately supplying and stocking water bodies with the appropriate fish species [78, 86, 87]. Ethiopia needs a multi-sectoral strategy and well-coordinated collaborative efforts from all stakeholders to change the rate at which aquaculture advances. Therefore, a critical task for the future is to increase the participation of producers and relevant public authorities in the distribution and management of aquatic resources and land use. For the aquaculture sector to successfully develop in Ethiopia, it was essential to continue building capacity through universities to graduate skilled labor as well as to train, extend, and educate fish producers at a higher level through appropriate research centers [59, 86].
2.8 Fisheries as a means of ensuring food security
Fish is frequently an undervalued but crucial component in securing access to food and nutrition for all [88]. Fish is a particularly good source of omega-3 fatty acids, eicosapentaenoic acid (EPA) and docosahexaenoic acid (DHA), which is high in nutrients and provides high-quality, low-saturated-fat protein [89]. At both the national and international levels, the importance of fish protein in general and small-scale fisheries in particular to food security and nutrition has been acknowledged and advanced [90]. The Food and Agriculture Organization (FAO) claims that all fishing grounds in West Africa are overfished or exploited [91]. Since the 1950s, a large number of development initiatives aimed at increasing fishing activity in West Africa have frequently failed [92]. However, it is impossible to significantly increase either the domestic fish stocks or the sources of imported fish to meet at least the average global consumption of 20 kg per capita in a short amount of time.
Over the past 30 years, aquaculture has grown steadily and quickly, and more than 40% of all fish consumed today comes from aquaculture. Even though aquaculture harvest is increasingly becoming a part of many Asians’ diets, it is much less prevalent among people in sub-Saharan Africa. Fisheries and aquaculture can make contributions through both direct and indirect channels. The contribution of the direct consumption to the production is the direct mechanism. For instance, poor people in developing nations typically rely on diets high in carbohydrates to meet their nutritional needs. However, they are lacking in micronutrients and proteins. Fish can aid in preventing micronutrient deficiencies in this situation because it contains high-quality protein, essential fatty acids, and significant micronutrients like iron, zinc, vitamin A, calcium, and iodine [90].
However, households can use aquaculture to improve their nutritional status directly by eating fish from their own ponds [90]. In India, Kumar and Dey [93] found that houses with ponds for fish farming consume 10.9% more energy than households without ponds but with wage earners and that the proportion of undernourished people in households with fish ponds is 10% lower than in the control population. It has been demonstrated that small fish species are crucial sources of protein for fish ponds owned by low-income families in the Dinajpur District of Bangladesh, particularly during the months when vegetables are scarce or prohibitively expensive. Dey and his coworkers in Malawi compared the consumption of fish between homes with and without fish ponds. They noticed that households with fish ponds consume fresh fish and dried fish more frequently [94].
On the other hand, in addition to its direct impact on dietary intake, fish sales also indirectly improve household food security by raising household income. This can be used to buy additional food supplies, such as less expensive staple foods, and is one of the livelihood strategies that has greatly benefited people in developing nations [95]. It is an essential tactic for helping the poor obtain food, income, and other social benefits [96]. Studies have found that fishing has a positive effect on household income.
According to a 2013 study by Gebremedhin and his colleagues in Lake Tana, fishing generates a sizable portion of the country’s income. It contributed 48% of the fishermen’s total yearly income. In Malawi, households with fish ponds had incomes that were greater by 1.5 times than those of households without [94]. Rural poor households that engage in aquaculture or capture fishing frequently use the extra money they make from selling fish to buy food. Recent studies have shown that households’ increased consumption of staple foods is positively impacted by household income from aquaculture [97].
2.9 Potential of fish feed
Fish feeds, which make up at least 40–60% of the cost of production, affect the fish’s ability to survive and be profitable [98]. Even though improvements to the continent’s overall production system have the potential to boost aquaculture production, the desired expansion of aquaculture, genetics, and principles of general farm management, which is necessary to satisfy the growing demand for fish, is only possible with reasonably priced, high-quality fish food [99]. The cost of producing animals in developing nations is decreased using conventional feed resources, which provide fish with the protein they need at a lower cost. The most important thing to emphasize is the need to find better and more affordable sources of protein that may not be suitable for human consumption [53]. In Ethiopia, which is in the spotlight for this, there are several agricultural processing byproducts that are not used for human consumption but have great potential as feeds for aquaculture on a small scale. It is acceptable that the production of high-quality fish protein from locally accessible low-protein byproducts can significantly increase the local human population’s access to protein [32, 53]. The production potential of a number of Ethiopian agricultural and agroindustrial byproducts for use in poultry and livestock feed has been assessed [100]. However, there is not much information available regarding this resource’s suitability as fish feed [101]. As a result, the presence of agriculture is a key determinant of the country’s potential for aquaculture because it provides byproducts for fish feed and fertilizer. Small-scale fish farming can use agricultural byproducts to increase yields beyond what the pond’s natural production would allow.
2.10 Fish consumption trends
It has been found that fish contains nutrients with a high biological value for human health. Despite the country’s strong livestock breeding and meat consumption, trends in fish consumption are modest. In comparison to the rest of Africa, Ethiopia consumes very little fish overall (0.216 kg per year) [53]. However, Wednesdays and Fridays receive a disproportionate amount of consumption, as do those days when people are fasting (15 days in August, 55 days in March/April, and other possibly less widely observed times) [25]. Fish is becoming increasingly more of a luxury good consumed by higher-income groups as a result of rising real prices due to increasing scarcity (apparently reflecting both rising demand and supply constraints) [53, 102].
2.11 Marketing system of fish in Ethiopia
Despite being more expensive and therefore harder to come by, the majority of Ethiopians prefer beef to fish [103]. There are numerous factors that affect fish marketing in Ethiopia as well, the majority of which are common to many developing nations [53, 99].
Ethiopia has a sizable market potential for fish, and there is a demand for fish. However, Ethiopia’s fish marketing system is hampered by a lack of a fish trading tradition, an ineffective marketing network, and subpar transportation and preservation facilities. In addition to the aforementioned difficulties, it has been discovered that the marketing situation for fish is harmed by people’s selectivity toward certain species. The relationship between fish supply and demand in the nation, which has fluctuated, determines the price of fish. The same research showed that, for instance, in Lake Tana, the cost of whole fish per kilogram nearly doubled in just 5 years. Additionally, the selling price of fish fillets has almost tripled. However, a kilogram of whole or filleted fish now costs between 15 and 20 Birr and 65 to 85 Birr, respectively, in RVA and even more in Addis Abeba [57, 100].
According to Shimada [54], the price of producing one kilogram of fish varies according to the time of year when fish are available near the fishing grounds. Production levels are above average during months like July to September and February to May. Between July and September, primarily in August, production peaks, and this is also the time when production costs are lowest. Consequently, both individual fishermen and fishing cooperatives profit greatly during this season [104]. The amount of produce fell below the mean in the other seasons, although to the point where some months of the year go by without any fish being caught. Commercial fishermen lost money and stopped fishing during this time.
This review used a variety of literature sources, journals, books, book chapters, workshop materials, FAO reports, bulletins, legal documentation, and documents from the Internet to examine Ethiopia’s fishery resources. Information on catch composition, seasonal patterns, regional variations in harvest rates, projections of potential output, processing methods, marketing, socioeconomic factors, management, and legal and regulatory frameworks were all reviewed. Using the literature sources, information on the quantity of water resources was also updated. Fisheries data from 42 years (from 1973 to 2023) were analyzed to assess Ethiopia’s state of fishery production and aquaculture development.
Ethiopia is home to a large variety of ichthyofauna in its lakes, rivers, and reservoirs. Several endemic, Highland East African and Nilo-Sudanic species make up Ethiopia’s fish fauna. Ethiopia’s inland waterways are home to 168–183 valid fish species, including 37–57 endemics in the nation. Baro, Blue Nile, Wabi-Shebele, and Omo-Gibe basins are in the order of highest fish species diversity in Ethiopia. But, it appears that the Blue Nile and Awash basins have the highest levels of endemicity. First of all, this is attributed to the flock of a critically endangered species called Labeobarbus that resides in Lake Tana. The Tekeze Basin in Ethiopia’s borders has the least variety of fish species when compared to other parts of the Nile basin. Many Nilo Sudanese fishes similar to those found in the southern Rift Valley lakes are thought to inhabit the Wabi-Shebele ecoregion (Lakes Chamo and Abaya). The area with the greatest diversity of introduced fish species is the Rift Valley Basin. Site-specific management is crucial in fishery biology and fish communities because fish communities vary depending on the type of water body.
Abenezer Wendimu collected data, organized the data on the computer, identified relevant papers, and wrote the draft manuscript. Dr. Wondimagegnehu Tekalign (Ph.D., Assoc. Prof.) and Dr. Abnet Woldesenebet (Ph.D., Ass. Prof.) advised and reviewed the manuscript and assisted in the language edition. All authors read and approved the final version of the manuscript.
The datasets generated and analyzed during the current study are included in the body of this paper.
References
1.Pino-del-Carpio A, Ariño AH, Miranda R. Data exchange gaps in knowledge of biodiversity: Implications for the management and conservation of biosphere reserves. Biodiversity and Conservation. 2014;23:2239-2258. DOI: 10.1007/s10531-014-0718-2
3.Vyas D, Krishnayya NSR, Manjunath KR, Ray SS, Panigrahy S. Evaluation of classifiers for processing Hyperion (EO-1) data of tropical vegetation. International Journal of Applied Earth Observation and Geoinformation. 2011;13(2):228-235. DOI: 10.1016/j.jag.2010.11.007
4.Getahun A, Stiassny MLJ. The freshwater biodiversity crisis: the case of the Ethiopian fish fauna. SINET: Ethiopian Journal of Science. 1998;21:207-230
5.Joint Ethio-Russian Biological Expedition (JERBE). An artificial key for fish species of the Gambella Region (The White Nile in the limits of Ethiopia). Addis Ababa, Ethiopia; 1995. p. 45
6.FishBase. All fishes reported from Ethiopia (landlocked). Paris, France: FishBase; 2023. Available from: https://fishbase.mnhn.fr/country/CountryChecklist.php?what=list&trpp=50&c_code=230&csub_code=&cpresence=present&sortby=alpha&ext_pic=on&vhabitat=all2
7.Tropical Freshwater Fish. List of Freshwater Fishes for Ethiopia. 2021. Available from: https://tropicalfreshwaterfish.com/data/Ethiopia.htm
8.Golubtsov AS, Mina MV. Fish species diversity in the main drainage systems of Ethiopia: current state of knowledge and research perspectives. Ethiopian Journal of Natural Resources. 2003;5(2):281-318
9.FAO. The State of World Fisheries and Aquaculture 2010. 2010. Available from: https://www.fao.org/3/i1820e/i1820e.pdf
10.FAO (Food and Agriculture Organization of the United Nations). In brief to the state of world fisheries and aquaculture 2022. Towards blue transformation. Rome, Italy: FAO; 2022
11.Lundberg JG, Kottelat M, Smith GR, Stiassny MLJ, Gill AC. So many fishes, solitle time: an over view of recent ichthyological discoveries in freshwaters. Annals of the Missouri Botanical Gardens. 2000;87(1):26-62
12.Welcomme RL. The inland fisheries of Africa. Food and Agriculture Organization of the United Nations. Rome: FAO; 1997. committee for inland fisheries of Africa occurrence paper 7, 69
13.FAO (Food and Agriculture Organization of the United Nations). The state of world fisheries and aquaculture 2020. Sustainability in action. Rome, Italy: FAO; 2020
14.Augustyn J, Cockcroft A, Kerwath S, Lamberth S, Githaiga-Mwicigi J, Pitcher G, et al. Climate change impacts on fisheries and aquaculture: a Global analysis. In: Phillips BF, Pérez-Ramírez M, editors. Chapter 15: South Africa. Vol. II. Berlin, Germany: Springer 2019. pp. 479-522
15.DAFF. Status of the South African marine fishery resources 2016. Forestry and Fisheries, Cape Town: Department of Agriculture; 2016
16.MFMR. Fisheries policy 2015 ensuring fisheries and aquatic resources sustainability. Maximising economic and social benefits to all Namibians, Namibia. Windhoek: Ministry of Fisheries and Marine Resources; 2015
17.MFMR. Strategic plan 2017/18-2021/22. Namibia, Windhoek: Ministry of Fisheries and Marine Resources; 2017
18.ATFALC. Fisheries and aquaculture industry in Namibia. In: The ministerial conference on fisheries cooperation among African States Bordering the Atlantic Ocean (ATFALCO): Series report no. 2 on the fisheries and aquaculture review in the 22 ATLAFCO member countries. Rabat, Morocco: ATLAFCO -The Ministerial Conference on fisheries cooperation among African States bordering the Atlantic Ocean. 2012
19.Cervantes A, Faraj A, Enthoven L. Rapport de la Réunion Scientifique Conjointe annuelle relative à l’Accord de pêche signé entre le Royaume du Maroc et l’Union européenne. Madrid, Espagne, 24-26 septembre 2018. Bruxelles: Rapports des Comités Scientifiques Conjoints; 2018
20.Gordon A, Sewmehon D, Melaku T. Marketing systems for fish from Lake/Tana, Ethiopia: Opportunities for improved marketing &livelihoods. In: Improving Productivity and Market Success of Ethiopian Farmers. Project Working Paper 2. Nairobi, Kenya: ILRI; 2007
21.Tesfaye G, Wolff M. The state of inland fisheries in Ethiopia: A synopsis with updated estimates of potential yield. Ecohydrology & Hydrobiology. 2014;14(3):200-219. DOI: 10.1016/j.ecohyd.2014.05.001
22.Kundu R, Aura CM, Muchiri M, Njiru JM, Ojuok JE. Difficulties of fishing at Lake Naivasha, Kenya: Is community participation in management the solution? Lakes & Reservoirs: Research & Management. 2010;15(1):15-23. 10.1111/j.1440-1770.2010.00419.x
23.Tigabu Y, Abera D, Ahmed L. Kinds and levels of post harvest losses of fish and possible ways to reduce loss in Lake Ziway. Proceeding of Ethiopia Society of Animal Production. 2007;15:143-150
24.Wang H, Amesa S, Endebu M, Tirfessa G, Zhong-Yi Z, Zhi-Gang W. Preliminary study on construction of three-in-one fishpond and its effect on aquaculture in Ethiopia. Fisheries and Aquaculture Journal. 2018;9(2):2-6
25.FAO. Information on Fisheries Management in the Federal Democratic Republic of Ethiopia. 2003. Available from: http://www.fao.org/fi/fcp/en/ETH/body.htm
26.Roberts TR. Geographical distribution of African freshwater fishes. Zoological Journal of the Linnean Society. 1975;57:249-319
27.Alemayehu L. The economic implications of comprehensive approach to learning on fisheries and aquaculture industrial development (policy and managerial capability learning): A case of Ethiopia Research Institute. Japan: Japan International Cooperation Agency (JICA); 2017
28.Tedla S, Hyelemeske F. Introduction and transplantation of freshwater fish species in Ethiopia. SINET: Ethiopian Journal of Science. 1981;4:69-72
29.FAO (Food and Agriculture Organization). Fishery and aquaculture country profles: the federal democratic republic of Ethiopia. Rome, Italy: FAO Fisheries and Aquaculture Department; 2014
30.Getahun A, Dejen E, Antehen W. Fishery studies of Ribb River, Lake Tana Basin, Ethiopia. A report submitted to World Bank. 2008;2:1573
31.Golubstov A, Darkov A. A review of fish diversity in the main drainage systems of Ethiopia. In: Dmitry S, Pavlov DY, Andrey A, Mina M, editors. Ecological and Faunistic studies in Ethiopia. Addis Ababa, Ethiopia: JERBE 20 Years Scientific Cooperation, Artistic inc; 2008. p. 173
32.Vadacchino L, De Young C, Brown D. The fisheries and aquaculture sector in national adaptation programmes of action: importance, vulnerabilities and priorities. In: FAO Fisheries and Aquac No.1064. Rome. Italy: FAO; 2011
33.Tewabe D. Spatial and temporal distributions and some biological aspects of commercially important fish species of Lake Tana, Ethiopia. The fourth annual conference of the Ethiopian fisheries and aquatic sciences association. Ethiopia: (EFASA); 2012
34.Westphal E. Agriculture systems in Ethiopia. Joint publication of the college of Agriculture, Haile Selassie I University, Ethiopia and the Agricultural University. Wageningen, the Netherlands: Center for Agricultural Publishing and Documentation; 1975
35.Getahun A. An overview of the diversity and conservation status of the Ethiopian freshwater fish fauna. Journal of Afrotropical Zoology. 2007:87-96
36.Getahun A. The Nile in the Ethiopian territory: riverine fish and fisheries. In: A paper presented at the Food and Water challenge international workshop that took place in Addis Ababa, Ethiopia. Addis Ababa, Ethiopia: Addis Ababa University; 2003
37.Habteselassie R. Fishes of Ethiopia. Annotated checklist with pictorial identification guide. Addis Ababa: Ethiopian fisheries and aquatic science association; 2012
38.Rzoska J. The Blue Nile system. In: Rzoska J, editor. The Nile, Biology of An Ancient River. The Hague: DR. W. Junk B.V. Publishers; 1976. pp. 219-232. Available from: https://www.rcin.org.pl/dlibra/publication/109546/edition/155646/content?ref=struct
39.Tedla S. Freshwater fishes of Ethiopia. Addis Ababa, Ethiopia: Department of Biology, Addis Ababa University; 1973. p. 101
40.Golubstov, A. and, Mina, M. 2003. Fish species Diversity in the main drainage system of Ethiopia: current state of knowledge and research perspectives Ethiopia. Journal of Natural Resources 5:281-318.
41.Skelton PH. A complete guide to the freshwater fishes of southern Africa. 2nd ed. South Africa: Southern Book Publishers; 2001. p. 388
42.De Graaf M, Nentwich E, Osse J, Sibbing F. Lacustrine spawning, a new reproductive strategy among ‘large’African cyprinid fishes,Journal of Fish Biology. 2005;66:1214-1236. DOI: 10.1111/j.0022-1112.2005.00671.x
43.De Graaf M, Dejen E, Sibbing F, Osse, J. Barbus tanapelagius, a new species from Lake Tana (Ethiopia): Its morphology and ecology. Environmental Biology of Fishes. 2000;59:1-9. DOI: 10.1023/A:1007608208630
44.Stiassny M, Getahun A. An overview of Labeo in relationship and the phylogenetic placement of the Afro-Asian genus Garra Hamilton, 1922 (Teleostei: Cyprinidae), with the description of five new species of Garra from Ethiopia, and a key to all African species. Zoological Journal of the Linnean Society. 2007;150:41-83
45.De Graaf M. Lake Tana’s piscivorous barbus (Cyprinidae, Ethiopia). Ecology, evolution exploitation [PhD thesis]. The Netherlands: Wageningen Agricultural University; 2003. Available from: https://edepot.wur.nl/121409
46.Avery ST. Lake Turkana and the lower Omo: The impact of hydrological impacts of major Dam and irrigation Development on the world’s largest desert lake. African studies center school of Interdisciplinary Area; 2013
47.Beadle LC. The Inland Waters of Tropical Africa: An Introduction to Tropical Limnology. 2nd ed. Longman, New York. 1981. 475 p. DOI: 10.1002/iroh.19830680114
48.Basnyat D, Gadain H. Hydraulic behavior of the Juba and Shebelle Rivers: basic analysis for irrigation and flood management purposes. Technical report No W-13. Nairobi, Kenya: FAO-SWALIM; 2009
49.Bonini M, Corti G, Innocenti F, Manetti P, Mazzarini F, Abebe T, et al. Evolution of the Main Ethiopian Rift in the frame of Afar and Kenya rifts propagation. Tectonics. 2005;24:TC1007
50.Gabriel G. The main Ethiopian Rift System: an overview on and sedimentation processes. In: Tudorancea C, Taylor WD, editors. Ethiopian Rift Valley Lakes. Leiden, Netherlands: Backhuys Publishers; 2002. pp. 13-43
51.Wudneh T. Biology and management of fish stocks in Bahir Dar Gulf, Lake Tana, Ethiopia. Ph.D. dissertation,. Wageningen: Wageningen Agricultural University; 1998. 142 pp
52.Kurien J. Small-scale fisheries in the context of globalization. In: Tromso. Trivendrum, India: Centre for Development Studies; 1998. pp. 1-47
53.FAO (Food and Agriculture Organization). The State of Food Security and Nutrition in the World. Rome, Italy: Building Climate Resilience for Food Security and Nutrition; 2016
54.Shimada G. The Economic Implications of Comprehensive Approach to Learning on Industrial Development (policy and Managerial capability learning) (No. 1001). A Case of Ethiopia Research Institute. JICA (Japan International Cooperation Agency); 2013. Available from: https://ideas.repec.org/p/jic/wpaper/1001.html
55.Assefa Mitike Janko AM. Fish production, consumption and management in Ethiopia. International Journal of Economics & Management Sciences. 2014;3(3):25-39. DOI: 10.4172/2162-6359.1000183
56.Kefale M, Chinnan KPM. Employment growth and challenges in small and micro enterprises Woldiya, north east Amhara Region, Ethiopia. Educational Research and Essays. 2012;1(2):21-22. Available from: https://api.semanticscholar.org/CorpusID:20194198
57.Daw K, Brown C, Badjeck M. Climate change and capture fisheries. Norwich, World Fish Center, Penang: University of East Anglia; 2012
58.Getu A, Misganaw K, Bazezew M. Post-harvesting and major related problems of fish production. Fisheries and Aquaculture Journal. 2015;6:154
59.Ayalew A, Fufa A, Wubet B, Samson L. Assessment of post-harvest fish losses in two selected lakes of Amhara Region, Northern Ethiopia. Heliyon. 2018;4(11):e00949. DOI: 10.1016/j.heliyon.2018.e00949
60.Agboola W. Improving Fish farming Productivity towards Achieving Food Security in Osun State, Nigeria: A Socioeconomic Analysis. Annals of Biological Research. 2011;2:62-74
61.Njagi KA, Njati IC, Smaio GH. Factors affecting profitability of fish farming under economic stimulus programme in Tigania East District, Meru County, Kenya. IOSR Journal of Business and Management. 2013;15(3):25-36
62.Sairam BP. Assessment of fish production and marketing system in Lake Hawassa at Amora Gedel, Ethiopia. Ethiopia: Behara Sairam Patnaik; 2016. https://www.researchgate.net/publication/301888630 [Accessed: December 2022]
63.Alemu LA, Assefa MJ, Tilahun GA. Fishery production system assessment in different water bodies of Guji and Borana zones of Oromia, Ethiopia. International Journal of Fisheries and Aquatic Studies. 2014;2(2):238-242
64.Muluye T, Tekle-Giorgis Y, Tilahun G. The extent of immature fish harvesting by the commercial fishery in Lake Hawassa, Ethiopia. Momona Ethiopian Journal of Science. 2016;8(1):37-49
65.Tesfahun A. Some biological aspects and immature fishing of the African Big Barb Labeobarbus intermedius (R.) in Lake Koka, Ethiopia. A part of MSc thesis submitted to Hawassa University. Hawassa, Ethiopia; 2011
66.Heide F. Feasibility Study for a Lake Tana Biosphere. United Nations Educational, Scientific and Cultural Organization (UNESCO). Reserve, Ethiopia; 2012
67.Eggert H, Greaker M. Effects of global fisheries on developing countries possibilities for income and threat of depletion. Environment for Development Initiative. 2009;393:27
68.Gebretsadik T, Mereke K. Threats and opportunities to major Rift Valley Lakes wetlands of Ethiopia. Journal of Agriculture Research and Technology. 2017;9(1):0010012
69.Tessema A, Mengist A, Mejen EA. Survey on fisheries in Chefa wetland and around Kemissie, Oromia Zone Ethiopia. Direct Research Journal of Agriculture and Food Science. 2014;2(3):28-32
70.Wondie A. Improving management of shoreline and riparian wetland ecosystems: the case of Lake Tana catchment. Bahir Dar University, Bahir Dar, Ethiopia. 2010;10(2-4):123-132
71.Hailu M. Ecosystem structure, trophic link and functioning of a shallow rift valley lake: the case of Lake Ziway (Ethiopia). Ethiopia: Addis Ababa University; 2011
72.Temesgen M, Getahun A. Fishery management problems in Ethiopia: natural and human induced impacts and the conservation challenges. Reviews in Fisheries Science and Aquaculture. 2016;24(4):305-313
73.Temesgen M. Length-weight relationship and condition factor of fishes in Lake Langena, Ethiopia, PhD Dissertation. Ethiopia: Addis Ababa University; 2017
74.Awoke T, Melaku M. Challenges and possible mitigation of Ethiopia fishery: A review. International Journal of Fisheries and Aquatic Studies. 2017;5(1):241-246
75.Perry RI, Ommer RE, Allison E, Badjeck MC, Barange M, Hamilton L. The human dimensions of marine ecosystem change: interactions between changes in marine ecosystems and human communities. England: Oxford University; 2009
76.Cheung WWL, Lam VWY, Sarmiento JL, Kearney K, Watso R, Pauly D. Projecting global marine biodiversity impacts under climate change scenario. Fish and Isheries. 2009;10(3):235-251
77.Abera L, Getahun A, Lemma B. Composition of commercially important fish species and some perspectives into the biology of the African Catfish Clarias gariepinus (Burchell), Lake Ziway, Ethiopia. International Journal of Advanced Research. 2014;2(1):864-871
78.Meko T, Kebede A, Hussein A, Tamiru Y. Review on Opportunities and Constraints of Fishery in Ethiopia. International Journal Poultry Fish Science. 2017;1(1):18
79.Dadebo E, Tesfahun A, Teklegiorgis Y. Food and feeding habits of African big barb L. intermedius (Rüppell, 1836) (Pisces: Cyprinidae) in Lake Koka, Ethiopia. Journal of Agricultural Research and Development. 2013;3:49-58
80.Mengesha M. Heavy metal pollution in the rift valley Lakes of Awassa and Koka, M.Sc Thesis. Germany: University of Bremen; 2009
81.Bekele J, Hussien D. Prevalence of internal parasites of Oreochromis niloticus and Clarias gariepinus fish species in Lake Ziway. Ethiopian Journal of Aquaculture Research Development. 2015;6:308
82.Bhattacharya A, Haldar S, Chatterjee P. Geographical distribution and physiology of water hyacinth (Eichhornia crassipses)—The invasive hydrophyte and a biomass for producing xylitol. International Journal of ChemTech Research. 2015;7(4):1849-1861
83.Waithaka E. Impacts of water hyacinth (Eichhornia crassipes) on the fishing communities of Lake Naivasha, Kenya. Journal of Biodiversity & Endangered Species. 2013;1:2
84.Wassie A, Minwuyelet M, Ayalew W, Dereje T, Woldegebrael W. Water hyacinth coverage survey report on Lake Tana. Technical Report Series. 2014
85.Firehun Y, Struik PC, Lantinga EA, Taye T. Water hyacinth in the Rift Valley water bodies of Ethiopia: its distribution, socioeconomic management. International Importance Journal Agricultural Research. 2014;3(5):067-075
86.Abera L. Fisheries production system scenario in Ethiopia. International Journal of Fisheries and Aquatic Studies. 2017;5(1):79-84
87.Lakew A, Tadesse Z, Dagne A. Technologies suitable for aquaculture development in Ethiopia. Ethiopia: Ethiopia Fish and Fisheries Association; 2016
88.HLPE. Sustainable fisheries and aquaculture for food security and nutrition. A report by the high level panel of experts on food security and nutrition of the committee on world food security, P118. 2014 www.fao.org/3/a-i3844e.pdf [Accessed 23 December 2022]
89.Hu FB, Bronner L, Willett WC, Stampfer MJ, Rexrode KM, Albert CM. Fish and omega-3 fatty acid intake and risk of coronary heart disease in women. Journal of the American Medical Association. 2002;287:1815-1821
90.Kawarazuka N. The contribution of fish intake, aquaculture, and small-scale fisheries to improving nutrition: a literature review. In: The world fish center working paper No. 2106. Penang, Malaysia: The world fish center; 2010
91.FAO (Food and Agriculture Organization). Contribution of fisheries to national economies in West and Central Africa—policies to increase the wealth generated by small-scale fisheries, new directions in fisheries e a series of policy briefs on development issues. Rome, Italy: Food and Agriculture Organization of the United Nations; 2006a
92.Belhabib D, Sumaila UR, Pauly D. Feeding the poor: contribution of West African fisheries to employment and food security. Ocean and Coastal Management. 2014;111:72-81
93.Kumar P, Dey MM. Nutritional intake and dynamics of undernourishment of farm households in rural India. Indian Development Review. 2006;4(2):269-284
94.Dey MM, Kambewa M, Prein D, Jamu FJ, Paraguas E, Pemsl E, et al. Impact of development and dissemination of integrated aquaculture—agriculture (IAA) technologies in Malawi. NAGA World Fish Centre Quarterly. 2006;29(1 & 2):28-35
95.Aiga H, Matsuoka S, Kuroiwa C, Yamamoto S. Malnutrition among children in rural Malawian fishfarming households. Transactions of the Royal Society of Tropical Medicine and Hygiene. 2009;103:827-833
96.Manasi S, Latha N, Raju KV. Fisheries and livelihoods in Tungabhadra Basin, India: current status and future possibilities. Working Paper 217. Bangalore: The Institute for Social and Economic Change; 2009, 24 pp
97.Jahan KM, Ahmed M, Belton B. The impacts of aquaculture development on food security: lessons from Bangladesh. Aquaculture Research. 2009;41(4):1-15
98.Gabriel UU, Akinrotimi OA, Bekibele DO, Onunkwo DN, Anyanwu PE. Locally produced fish feed: potentials for aquaculture development in subsaharan Africa. African Journal of Agricultural Research. 2007;2(7):287-295
99.Hirpo LA. Fisheries production system scenario in Ethiopia. International Journal of Fisheries and Aquatic Studies. 2017;5:79-84
100.Asfaw Z. The future of wild food plants in southern Ethiopia: ecosystem conservation coupled with enhancement of the roles of key social groups. Acta Horticulturae. 2008;806:701-708
101.Craig S, Helfrich LA. Understanding fish nutrition, feeds and feeding. Cooperative Extension Service. 2012;13(1):420-256
102.FAO (Food and Agriculture Organization). Fishery (http://www.fao.org/faoterm/en/?defaultCollId=21) (Entry: 98327). Rome, Italy: Food and Agriculture Organization of the United Nations; 2009a. p. 24. Accessed: 21 December 2022
103.Adugna T. Feed resource for producing export quality meat and livestock in Ethiopia from selected woredas in Oromia and SNNP regional states, Ethiopia. 2007. Available from: http://hdl.handle.net/123456789/3038
104.EIDP. Evolution and current performance. In: Presentation on “Learning to Compete: Accelerating Industrial Development in Africa” Conference Organized by UNUWIDER; 24/25 June; Helsinki, Finland. 2013. Available from: https://www.wider.unu.edu/expert/finn-tarp?page=30
Written By
Abenezer Wendimu, Wondimagegnehu Tekalign and Abnet Woldesenbet
Submitted: 25 January 2024Reviewed: 09 February 2024Published: 28 March 2024