Open Access is an initiative that aims to make scientific research freely available to all. To date our community has made over 100 million downloads. It’s based on principles of collaboration, unobstructed discovery, and, most importantly, scientific progression. As PhD students, we found it difficult to access the research we needed, so we decided to create a new Open Access publisher that levels the playing field for scientists across the world. How? By making research easy to access, and puts the academic needs of the researchers before the business interests of publishers.
We are a community of more than 103,000 authors and editors from 3,291 institutions spanning 160 countries, including Nobel Prize winners and some of the world’s most-cited researchers. Publishing on IntechOpen allows authors to earn citations and find new collaborators, meaning more people see your work not only from your own field of study, but from other related fields too.
A striking feature of the pandemics was the massive fiscal policy stimulus that was initiated globally and the reaction of households. Before a vaccine against Covid was invented, households reacted by saving a big part of their incomes, resulting in falling real consumption. When the vaccine was invented and expected to be rolled out, the reaction among households was the opposite: a big rebound in consumption driven primarily by spending saved funds on top of the increase in income. Household expenditure growth has tracked real wage growth this decade. Countries with wage constraint and high inflation were found to fare worse economically. The higher interest rates 2022–2023 in the wake of rising inflation have not given rise to the widely expected recession. It is concluded that fiscal, monetary and macro prudential policy have not been overly efficient during the first four years of the 2020s. It is found that other factors than policy are more powerful in affecting economic activity. The exception is the efficiency of monetary policy to control financial cycles, exemplified by the Swedish real estate boom-and-bust cycle of the past decade. Monetary policy it is concluded needs to set the policy rate close to real economic growth.
*Address all correspondence to: kall1234@outlook.com
1. Introduction
The global business cycle of the first four years of the 2020s has exhibited more drama than perhaps ever before. According to the National Bureau of Economic Research (NBER), the pandemics recession in the USA was both the most short lived and severe with a peak in February 2020, a trough in April 2020 sending the unemployment rate up to 15 percent. The economic policy response was massive, both in terms of fiscal and monetary policy stimulus around the world. According to McKinsey, governments’ economic response to the crisis was unprecedented: $10 trillion announced just in the first two months, which is three times more than the response to the 2008–2009 Global Financial Crisis. After the initial shock and policy response followed a chain of events of sluggish growth, the (expected) advent of a vaccine against COVID-19, a strong and short-lived economic recovery, Russia attacking Ukraine, global supply chain disruptions, the return of inflation and consequently much higher interest rates. As of writing, January 2024, central banks are widely expected to start lowering rates as inflation rates have come down since mid-2023. The mentioned chain of events will be analyzed in this paper, with a focus on how policy responded to business cycle outcomes. That said, the perhaps most interesting and awaited outcome remains to be materialized or not. The Federal Reserve started raising its policy rate in the first quarter of 2022 from zero percent. In July 2023, it raised it as it seems for the last time during the cycle to 5.25–5.50 percent. In macro economic textbooks, shocks and policy constitute the main triggers behind macro economic outcomes. It goes without saying that the pandemics shock had a severe effect on macro economic variables. Striking is the instantaneous lead time from shock to effect via new and unexpected lockdown behavior among economic actors. Contrast this with the Fed’s rate hiking cycle of 2022–2023. It is a well-known truth that monetary policy works with a lag, meaning that we should expect real economic effects 18–24 months following monetary policy actions. Apply this to the US economic situation and we would readily discount a deteriorating labor market starting sometime between the second half of 2023 and the first quarter of 2024. However, such an expected policy effect has not yet materialized, despite a widely held belief of an all but inevitable recession, as the US labor market continued on a very strong footing throughout 2023 with a stable unemployment rate below four percent. The ultrastrong US labor market has lasted for two years, the longest stretch of time in nearly half a century.
The great financial recession of 2008–2009 exposed flaws in the way economists, policymakers and others had looked upon macro economics and business cycles for a long time. As one main actor of the time, the then European Central Bank (ECB) Governor Trichet, put it: “…in the face of the crisis, we felt abandoned by conventional tools.” Which are those conventional tools, which macro economic / business cycle theories lay behind them and most importantly: why were they deficient in capturing the events of 2008–2009? The British economist Charles Goodhart [1] makes a convincing answer in the paper The Continuing Muddles of Monetary Theory: A Steadfast Refusal to Face Facts. According to Goodhart: “The current dominant consensus money/macro model, the standard DSGE model, abstracts from any possibility of failure or default and thereby largely eliminates any rationale for banks, financial intermediaries and even money. That this is strictly insufficient and inappropriate has been all too clearly illustrated by the events of 2007-08.” The US economist Gregory Mankiw [2] who belongs to the “New Keynesian” camp is critical of the Classical theory building, admitting that there is often a trade-off between the parsimonious beauty of a theory and how well a theory fits facts. According to Mankiw, “Indeed, new Keynesians sometimes suggest that to understand the business cycle, it may be necessary to reject the axiom of rational, optimizing individuals, an act that for economists would be the ultimate abandonment of internal consistency.”
The above display tells us that neither macro economic theory nor the policy setup that stemmed from it was not optimally rigged to deal with an increasingly destabilizing economy leading up to the great financial recession of 2008–2009. A central question for putting the dramatic events of the early 2020s into a proper perspective is what lessons were drawn from the policy failure of the 2000s and in specific, ask how theory and policy have changed during the 2010s. The simple answer is that macro prudential regulation as a part of financial stabilization policy has become a new policy area. The policy aims at mitigating risks to the financial system as a whole. There exist many policy instruments, such as cap on loan-to-value and debt-to-income ratios, aiming at reducing the procyclicality of the financial system on the asset and liability sides. Another tool, countercyclical capital requirements, aims at reducing balance sheet shrinkage from banks in trouble. An open question, far from settled, is how monetary and financial stabilization policy best cooperate. Before the great financial recession, there wasn’t much of cooperation. Monetary policy with its inflation target should focus on it and not bother about “leaning against the wind,” or against financial imbalances. If they were to occur, the monetary recipe was to mop up after financial crises. Against this background, it is easy to understand why US interest rates were low in the mid-2000s and why proponents of “leaning against the wind” argued that rates were too low. Since then, central banks take financial stability more into account by and large, such as stating that inflation returns to target amid reducing financial volatility and promoting the smooth operation of payment systems. But what if inflation is too low and financial imbalances are being built up? Can a central bank achieve both policy targets or need it sacrifice financial stability, given the (still) higher prioritized inflation target? The question is answered by focusing the analysis on the Swedish real estate sector since the mid-2010s.
The 2010s go down in history as a decade with low inflation and with policy interest rates turning south, even at times to negative rates. Another associating feature of the 2010s was the breakdown of the Phillips curve. As the US unemployment rate started declining from 10 percent in 2010, its constant decline to below four percent in 2019 did not coincide with a rise in the inflation rate that hovered between one and two percent. On June 14, 2017, the then Fed Governor Janet Yellen elaborated on the Phillips curve at a Fed press conference: “And, well, it is very difficult to pin down what is the longer-run normal rate of unemployment, and there’s a great deal of uncertainty about it, and it’s hard to pin down, especially given the fact that the so-called Phillips curve appears to be quite flat. That means that inflation doesn’t respond very much or very quickly to movements in unemployment. Nevertheless, that relationship, I believe, remains at work. We have seen that operate historically.”
My point here is that traditional macro economic relationships, subject to a great deal of uncertainty, did not hold before the dramatic first four years of the 2020s. Given the unprecedented business cycle of the previous years, one should therefore not be surprised to find the same relationships break down again. The matter is highly relevant for what would be considered an optimal policy mix. Note that the former Fed Governor Yellen still believed in the Philips curve, it “remained at work.” But what if the central banks stop believing in it? And what if, as the first paragraph alluded to, a distinct rate hiking cycle does not have the expected effect of a deteriorating labor market? One way to tackle these questions is to focus on accounting identities rather than macro economic theoretical relationships. To be clear, identities cannot fully replace theory. But coupled with economic logic, it will be shown how high-frequency data embraced by identities during the tumultuous first four years of the 2020s serve as a basis for concluding how policy best one ought to respond to today’s highly uncertain macro economic reality. Policy is widely seen to be effective in affecting macro economic outcomes. Two means by which such efficiency is often concluded are the policy-works-with-a-lag and the ceteris paribus argument, holding all other factors affecting macro economic outcomes constant. This paper critically reviews these two means, which are often taken for granted as “truths.”
The paper is organized in two sections. The first one, Chapters 2–4, is mainly a description of macro economic events during the 2020s, with the analysis made confined to macro economic relationships. The second one, Chapter 3–5, is a policy analysis focusing separately on fiscal policy, monetary policy and macro prudential policy and concluding with a recommended policy mix.
2. Household consumption during and after the pandemics
The decades leading up to the pandemics were, despite ultra-easy monetary policy and financial market volatility, by and large characterized by real income gains and saving on the part of households. Underlying the positive trend were low and stable inflation rates and an optimistic business sector expanding activities, investments and hiring. That would change radically during and after the pandemics.
In Table 1, Swedish household economic behavior is shown in growth terms before, during and after the pandemics. The first four years of the 2020s are divided into three periods: first, the Covid period, then the period of the Vaccine against Covid and last the ensuing Inflation spurt. Swedish households cut back on real expenditures during the Covid period, amid unchanged real disposable incomes. That is to say that a sharp rise in saving was behind all of the expenditure decline. The period when the vaccine was invented and rolled out saw a sharp rebound in real household expenditure, with an average quarterly increase of 8.1 percent. The increase coupled with the increase in real income (3.3 percent) needs to be seen against the low pandemics period based upon which they are calculated. During 2020:Q2, the real income fell sharply as total numbers of hours worked plummeted. In 2021:Q2, the real income increased by 6.3 percent triggering a strong rebound in household expenditures. However, household borrowing contributed even more (4.7 percent) to the expenditure spurt. This should be interpreted as spending out of earlier saved funds rather than taking up new loans.
Period
Real growth in household expenditure, %
Real growth in household disposable income, %
Nominal growth in household net borrowing, %
Low inflation 1995–2019
2.7
2.9
−0.2
Covid 2020:Q2–2021:Q1
−3.5
0.0
−2.5
Vaccine 2021:Q2–2022:Q2
8.1
3.3
4.7
Inflation 2022:Q3–2023:Q3
−2.9
−2.3
−0.6
Table 1.
Growth in Swedish household income, expenditure and net borrowing before, during and after the pandemics.
Source: Statistics Sweden and author’s calculations.
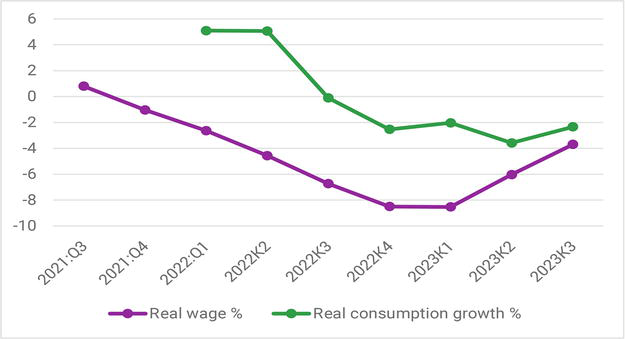
In comparison with the low and stable inflation period between 1995 and 2019, the Covid and the ensuing Vaccine period were unprecedented in one central aspect: household net borrowing accounted much more than income for total swings in real expenditure. In 1995–2019, Swedish households spent 93 percent of their real income growth and saved the rest. In that respect, the Inflation spurt period 2022:Q3–2023:Q3 is more like the low and stable inflation period, in that income contributed to the expenditure outcome. The difference being that both variables fell in real terms. The decline in real disposable income was all about wages, as the labor market continued to produce jobs. In other words, continued modest wage gains met with an increasingly higher inflation rate sending down real wages sharply. In reality, the distinction between the Vaccine and the Inflation spurt period is not as clearly divided as it appears in Table 1. The inflation rate in Sweden started rising in early 2022. However, in the minds of the Swedish households, high frequency data allude to the fact that they ignored the early part of the rise in inflation and fall in real wages. In the first half of 2022, it was widely believed that rising inflation was a temporary phenomenon. Figure 1 shows the relationship between real wage and household consumption growth between 2021:Q3 and 2023:Q3. In 2022:Q2, the inflation rate hit seven percent, the real wage fell nearly five percent at the same time as households kept spending strongly. The reason was as mentioned, the drawdown of savings built up during the pandemics. As real wages continued to fall, households eventually cut down on expenditure. During 2022:Q3 and 2023:Q3, the real expenditure fell 3.6 percent quarterly, coinciding with a decline in real wages of almost seven percent. Sweden entered a recession in late 2023 after two quarters in a row of falling GDP.
Figure 1.
Wage and household consumption growth. Sweden, constant prices 2021:Q3–2023:Q3. Source: Statistics Sweden and Medlingsinstitutet.
The expenditure behavior of Swedish households is not fundamentally different to that of households in other countries. A common theme globally during and after the pandemics is the sharp swings in net borrowing contributing markedly to total expenditures. As for the relationships during the Inflation spurt, it is worth taking a closer look at how other countries fared. For example, the recession that Sweden experienced did not happen in many other countries. This will be analyzed in the next section.
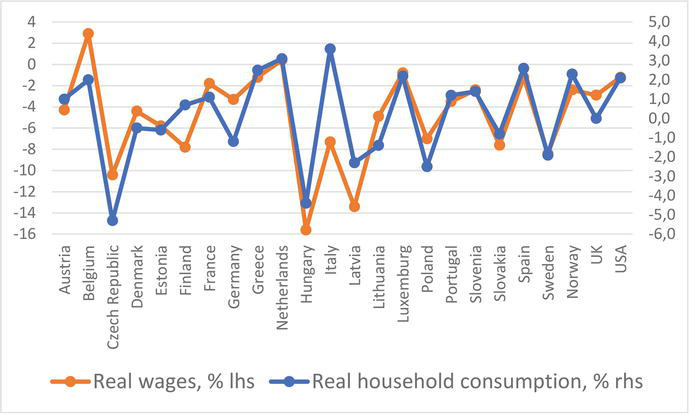
3. Real wages and economic performance in 24 countries during the Inflation spurt
In Figure 2, the relationship between real wage and household consumption growth is plotted for 24 countries between 2022:Q1 and 2023:Q1. The correlation is clearly positive. The average real wage growth was −4.8 percent and the average real household consumption growth +0.2 percent. The reason why the two variables are not equal is that the total number of hours worked and net borrowing also contribute to the consumption outcome. Throughout Europe as well as in the USA, labor markets have remained very strong, thereby exerting an upward pressure on consumption. The question of whether a country has managed to escape a recession or not depends much on how well real wages have held up. In the USA, for example, they were mildly negative at the same time as real consumption grew at about 2 percent. In 2023, real incomes continued to grow, thanks to the strong labor market and inflation turning down, thereby underpinning further growth in real household expenditures. In fact, the net borrowing decreased in 2023 compared to 2022, underscoring the pattern that household net borrowing had the biggest impact on expenditures during the Covid and Vaccine periods.
Figure 2.
Real wage and household consumption growth in 23 European countries and the USA between 2022:Q1 and 2023:Q1. Source: Eurostat, National Statistic Bureaus.
In all studied countries, the inflation rate had come down in the course of 2023. The main macro economic conclusion that can be drawn from the sharp upswing in the inflation rate in 2022 and the following downswing in 2023 is the absence of a Phillips Curve relationship. Unemployment has remained ultralow and stable in Europe and in the USA throughout the vehement inflation swings of 2022–2023. In Table 2, it is shown that countries with the worst real wage development in 2022:Q1–2023:Q1 experienced a bigger decrease a year later in the inflation rate (12.7 percentage points (pp)) than did countries with more modest real wage declines (6.3 pp). One lesson to be drawn is that wage constraint may prove a virtue in the face of accelerating inflation. Looking closer at numbers behind the relationship in Table 2, it turns out that for countries with a wage constraint and a very high inflation rate around the shift between 2022 and 2023, the inflation rate fell back more sharply.
Real wage growth, %
Change in inflation
2022:Q1–2023:Q1
2022:Nov–2023:Nov, pp
10 European countries
−8.8
−12.7
11 European countries
−2.3
−6.3
Table 2.
Real wage growth and following change in inflation for two European country groups.
Source: Eurostat, National Statistic Bureaus and author’s calculations.
4. How did business firms cope with the pandemics and inflation shocks?
As interest rates presented a big shock to business firms in 2022–2023, we approach the business sector by dividing it into one group of interest rate sensitive firms leaving the rest of the business sector less interest rate sensitive. A special focus is placed on the Swedish real estate industry, which in recent years has been subject to increasing scrutiny and concern, both by financial stability regulators and by financial journalists, due to hefty borrowing triggered by the zero and minus interest rate environment of the 2010s.
In Table 3, it is shown that the real estate industry expanded its balance sheet much more than the rest of the business sector during the 2010s. The trend strengthened further in the latter half of the decade as the central bank’s policy rate went from slightly positive to minus. The main financing source was market debt.
2011–2014
2015–2019
Real estate industry
6.5
8.4
Rest of the business sector
2.3
3.4
Average policy rate, %
1.2
−0.4
Table 3.
Balance sheet growth (%) of two Swedish business groups and the policy rate during 2011–2019.
Source: Statistics Sweden and the Riksbank.
The balance sheet expansion of the real estate industry was reflected by an increase in housing investments, thus adding to gross domestic product (GDP). In Table 4, it is shown that housing investments increased faster than the rest of business investments during the 2010s. The pandemics shock in early 2020 was countered by massive policy easing on the part of fiscal, monetary and macro prudential policy. The policy rate remained at zero percent by the time and instead the central bank resorted to various programs of asset purchases aiming at facilitating the access of credit and liquidity. In Table 4, it is seen that housing investments continued to grow strongly during the Covid period, in fact even stronger than in the 2010s. All other investments did however not fare as well, only rising by 0.3 percent. Why did the two investment types develop so differently during the Covid period? First, note that business firms make a choice of expanding their businesses by assessing future conditions and profits. Real estate firms thus must have made a more positive assessment than all other firms. The pandemics itself was clearly an overly negative economic feature, whereas the combined policy response was a positive one. It is close at hand concluding that real estate firms primarily viewed the positive policy responses in assessing future business conditions, whereas all the other firms were concerned about how the pandemics would affect future demand for their products.
2011–2014
2015–2019
Covid period
Vaccine period
Inflation spurt
Housing investments
4.3
4.0
4.8
11.2
−14.1
Rest of business investments
2.8
3.5
0.3
6.9
5.7
Average policy rate
1.2
−0.4
0.0
0.0
2.5
Table 4.
Growth of two investment types (%, y-o-y, constant prices) and the policy rate during 2011–2023. Sweden.
Source: Statistics Sweden and the Riksbank.
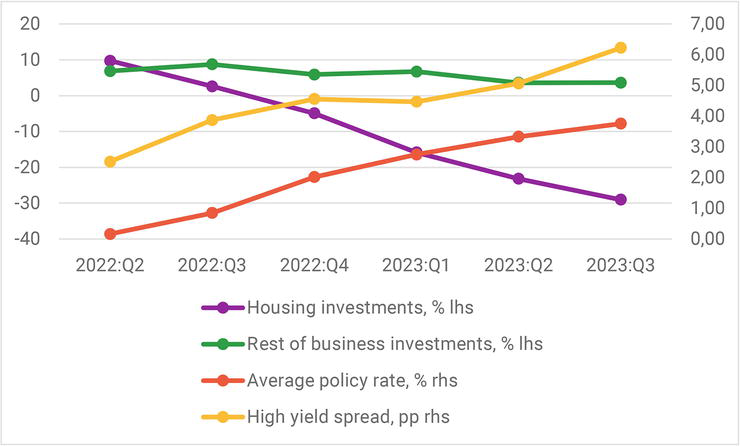
Both investment types boomed during the Vaccine period, reflecting the optimism in the overall economy. Housing investments continued to outpace all other investments, increasing 11.2 percent. This proved to be the peak of a decade-long boom. When first inflation and then interest rates started to rise, the effect on the housing sector was massive. Housing investments collapsed, 14.1 percent, during the Inflation spurt period. Figure 3 shows on a quarterly basis the transition from the Vaccine to the Inflation spurt period for the two investment types. It is clearly seen that the collapse of housing investments coincides with the increase in both the policy rate and the high yield spread. The period average of −14 percent conceals the transition in the course of the period from +3 to −29 percent. As for all other investments, they increased faster (almost the double rate) during the Inflation spurt than during the 2010s. To understand what is behind the perhaps unexpected resilience of all other less interest rate sensitive firms, one can apply the same but opposite logic as during the Covid period. If these firms were gloomy during the Covid period, they have been animal spirited since the Vaccine period and the inflation and interest rate shock has not taken much of a toll on their optimism. At least not yet. That means that other explanatory factors are more positive than the negative interest rate factor, thus making their net assessment of future conditions positive. One can think of the transition to making the society green and fossil free, something which has rendered the northernmost part of Sweden a huge influx of investments, as one among many such positive factors.
Figure 3.
Two investment types (% y-o-y constant prices) and interest rates during 2022:Q2–2023:Q3. Sweden. Note: high yield pertains to real estate firms with a credit rating below BBB- and the spread is percentage points above swap rates. Source: Statistics Sweden and the Riksbank.
The fiscal policy stimulus during the pandemics was unprecedented. What did it achieve in terms of macro economic performance? The question is best answered by linking the timing of the stimulus to the timing of actors’ economic behavior. It was shown that households saved a lot of their incomes during the Covid period and as such contributed to weak overall expenditures. In the ensuing phase when the vaccine to Covid was (expected to be) rolled out, the macro economy skyrocketed as households not only consumed out of their rising incomes but on top of that also used previously saved funds for spending. To summarize, the unprecedented pandemics shock was met with an unprecedented fiscal policy stimulus to which households reacted upon unprecedently by first sending down real expenditures by saving and then with a vaccine sending them up by dissaving. The consumer behavior is unprecedented against the backdrop of the historic tight relationship that households consume most of their incomes and save a small part of them. Policy efficiency, in general, hinges on constant behavior of economic agents. The more this changes, the more expected policy effects can be offset.
Was the fiscal policy stimulus effective? It was clearly not effective during the Covid period, as households then saved en masse. However, considering policy time lags and holding other factors constant readily produce efficiency. Analyzing relevant and highly frequent macro economic variables opens up for the possibility of more exactly determining the power and timing of other factors affecting macro economic outcomes. In Gholipour et al. [3], consumer confidence as a crucial factor in explaining households’ aggregate consumption is analyzed. Their estimation result, covering a wide range of advanced and emerging market economies, is that government stimulus and leading economic indicators have a positive and significant impact on consumer confidence, whereas Covid deaths have a negative and significant impact. When analyzing how these explanatory variables affected economic outcomes of the Covid and Vaccine periods, logic would tell us that Covid deaths and leading economic indicators are linked, driving the economy downward during the Covid period and upward during the Vaccine period. Fiscal policy stimulus is effective to the extent that outcomes would have been worse without it (think of low-income earners spending all the stimuli) but is not powerful enough to affect the overall macro economic outcome. As is concluded in Bergström [4], “the gloomier the economy, the stronger is the case for active fiscal policy, but the lesser is the chance for it to succeed.” This might appear surprising if one is used to thinking about policy efficiency from a ceteris paribus assumption. The conclusion here relaxes that assumption. That is to say that economic policy is risky business, not a mechanical link to growth, when taking into account all other factors that may affect aggregate demand. Policy can but need not affect aggregate demand. One has to separate the gross effect from the net effect. The gross effect of policy on demand may well exist but not a net effect if the countering gross effect of all other countering factors is bigger. And factors competing with policy in affecting aggregate demand tend to be more powerful, the gloomier is the state of the economy. Think of Covid deaths as an explanatory factor of consumer confidence. Think about terrified people facing a deadly virus. They are not happy spenders, although they received a policy stimulus. When the vaccine was invented, people became hopeful again. The newfound hope showed up in a very strong and rebounding real economy. The policy stimulus was eventually spent by households. So, policy was efficient after all? To better understand, make the thought experiment that it had taken a year longer to invent and roll out the vaccine and how the business cycle and government budgets had looked like in such a scenario. Give credit where credit is due. Covid and the vaccine against it were the powerful and driving forces of the tumultuous business cycle of the pandemics, not fiscal policy.
A main lesson of the pandemics is the need for fiscal policy insurance in the face of a big, detrimental and unexpected shock. Affected business firms and households receive an insurance from the government, something which an insurance company would not afford. In that respect, the fiscal policy stimulus amounts more to an insurance policy than a policy driving the business cycle. A prerequisite for such a policy to function is the buildup of fiscal surpluses in normal times.
Higher central bank policy rates in 2022–2023 are often credited with having triggered a slowdown in activity and the deceleration in inflation rates. The review made in this paper leads up to the conclusion that there is no such monetary policy effect. The Inflation spurt and ensuing higher interest rates were a global phenomenon. Yet, real macro economic performance has been highly scattered across economies. Above all, the so much forecasted global recession has failed to appear primarily, owing to a forecast error linking higher interest rates to a weaker labor market. One of the central banks’ favorite workhorses, the Phillips Curve, has continued to be invisible during the 2020s. Analyzing why real household consumption growth has been scattered across nations, it is found that different real wage outcomes are the answer. Countries with significant declines in real wages, such as Sweden, have experienced not as significant declines in real household consumption growth, which in some cases have been enough to drag down the whole economy into recession. But the overall pattern is no recession. The foremost reason is that real incomes have been resilient in 2023. Despite falling real wages in most economies, business firms have been animal spirited expanding their businesses, investments and hiring. For instance, Swedish business investments, except for housing, grew more strongly during the rate rising period of the Inflation spurt than during the minus rate experiment of the 2010s. This is just one example of how monetary policy seems to have difficulties affecting nominal GDP. As for households, the Inflation spurt period has demonstrated that wage-setting actors may indeed be more powerful than monetary policy in triggering slower overall economic activity. One flipside of the coin is that households paid for higher inflation by means of lower real wages. Another that slowing economic activity is no guarantee for falling inflation if the underlying reason for higher inflation is supply side contingent. The shocks of the 2020s put into question the foundation of inflation targeting, namely forecasting future inflation, as virtually no one foresaw the recent Inflation spurt. However, all this does not mean that monetary policy has been completely ineffective. It is easy to think about households with big loans with variable interest rates feeling squeezed by the interest rate shock. But just like with fiscal policy, the effect is selective rather than economy-wide, the gross effect may well be there but not the net effect. Higher inflation affects households more broadly than interest rates, e.g., low-income earners living in rented apartments and senior citizens having paid back their loans. Last but definitely not least, monetary policy in Sweden has proved highly efficient in one area of the economy, the real estate and housing sector. An area in which monetary policy is not supposed to be efficient.
The housing boom in Sweden went on from the early 2010s to mid-2022. When plotting interest rates and housing investments, a very strong negative relationship appears. Housing investments now amount to 14 percent of total business investments after having reached a peak of 20 percent in early 2022. Their direct effect on GDP is therefore limited. The indirect effects are potentially much bigger and more severe. They could be financially related, such as foreign investors distrusting Swedish assets, triggering currency weakness. From a policy perspective, the boom-and-bust cycle of the Swedish real estate / housing sector has proved the insufficient safety net of combined monetary and macro prudential policy. The norm in Sweden since the early 2010s has been that monetary policy sets the interest rate in response to forecast future inflation and economic conditions, whereas the Financial Supervisory Authority is responsible for macro prudential policy. The Riksbank Governor Thedeen was interviewed on December 28, 2023 by the telegram agency TT saying that “it is not reasonable that real estate companies have been able to borrow so much to the extent that they expose the Swedish economy to big risks…it is a system of credit analysts, equity analysts and those who make real estate deals that in some way has let this happen.” The most interesting thing here is not what he says but what he leaves out. Blaming analysts and dealers for the real estate crisis is not necessarily technically wrong, but it is like asking why prices have risen and receiving the answer that there were more buyers than sellers. Resorting to tautology leaves out in both cases the underlying reasons. Unless the analysts and dealers have done something illegal, the crucial and unanswered question is why did the system let it happen. The system clearly does not operate in a vacuum. The financial environment provides the actors of the system with the incentives to take risks that in the long run risk destabilizing the financial system. The system that has in some way let it happen is in fact a neat deflection away from the main focus of the matter: macro prudential regulatory policy as part of the financial stability policy.
The debate on the destabilizing real estate sector that the Riksbank Governor calls for needs to center around the optimal monetary and macro prudential policy mix and the risk-taking channel of monetary policy. The channel is about low interest rates inducing banks, other financial institutions and the whole economy to take big financial risks. The channel can be seen as a new and more unorthodox monetary policy channel beyond the usual ones. In the current policy mix, macro prudential policy has been given the task of containing the risk-taking channel. Monetary policy of leaning against the wind is widely thought to be associated with net costs in terms of higher than necessary unemployment, confirmed by an ECB report by Kockerols and Kok [5] “We find that monetary policy has cumulated net marginal costs in addressing risks to financial stability…furthermore, we assess permanent changes in macroprudential policy and find that the benefits are even greater.”
One reason why the macro prudential policy did not manage to contain the destabilizing risk-taking channel of the real estate sector may be the focus on bank capital and household borrowing. By and large, business firms are rarely the main focus sector of either fiscal or monetary policy. This fact is further complicated by the diversity of the business sector. A business firm operating in the green, transition industry has a completely different business model than a real estate company. The recent boom-and-bust cycle of the real estate sector has overexplicitly shown how fundamental interest rates are in the business model of real estate companies. Low rates have two main effects. First, they appear as a part of the profit margin as long as revenues in the form of rents are higher than the costs in the form of interest rates. Such a real economic business model bears a close resemblance to a phenomenon in the currency market called carry trade, in which investors borrow low-yielding currencies and invest in high-yielding ones, collecting the yield difference as the profit margin. The second effect runs via asset revaluations. Low interest rates have a tendency to inflate assets that are used as collateral for loans. A main reason why monetary policy is highly efficient in affecting asset prices has to do with the equation of exchange within the financial system. Given a rather constant number of financial assets (Y), throwing more money (M) on them gives rise to higher prices (P) by virtue of accounting identity. Both effects are dream effects for participating real estate actors when interest rates are low and asset prices rising. But when the tide turns, the setup is a recipe for disaster. The turning tides are in effect the very definition of financial instability. It is the responsibility of policy, not the profit-and-bonus seeking actors of some “system,” to secure financial stability. Unfortunately, policy has not been up to the job. In the concluding section, a vision of a new and better policy mix is laid out.
The main lesson learned from the unprecedented fiscal policy stimulus of the pandemics is that it resembled a nation-wide insurance system in the face of a huge, negative and unexpected economic shock. In this sense, fiscal policy as a part of economic policy was more insurance policy than economics. The main objective of this fiscal policy was to make affected firms and households feel financially less uncertain. A prerequisite for such a nation-wide insurance system to function is to build up a fiscal surplus in normal times. Economically, the stimulus has had selective, positive effects, such as inducing low-income earners to spend more, but has not driven the tumultuous business cycle of the early 2020s. The reason why fiscal policy is less efficient than is widely thought of has to do with the fact that other factors are more important business cycle drivers, be it Covid and the vaccine against it in the recent cycle or more permanently the business firms via their expectations of future demand. Policy is a risky enterprise lacking a predetermined link to macro economic outcomes. Fiscal surpluses proved a virtue when the pandemics struck and should be part of fiscal policy in the future.
Monetary policy in the early 2020s has not been overly effective. When inflation finally returned, central banks failed to forecast it. And when they started to raise rates significantly, the widely expected global recession has not become a reality. In Sweden, the situation has possibly been even worse, as the interest cycle since the early 2010s has induced a boom-and-bust cycle of the real estate sector, risking triggering a financial crisis. Monetary policy has been highly effective in managing housing investments with the risk of triggering a destabilizing financial crisis. The problem is that such efficiency is not desirable. Macro prudential policy has not managed to contain the dangerous boom-and-bust cycle. This leads up to the conclusion that a new and better policy mix requires that the interest rate more closely follow real economic activity. The aim of which is primarily to get away with destabilizing behavior on the part of actors who rely heavily on the interest rate in their business models. Making monetary policy leaning against the wind need not involve the big costs associated with higher than necessary unemployment. The resilient US labor market and the Swedish business investments, excluding housing, are two examples of how difficult it is for monetary policy to control nominal GDP. This is due to the fact that business firms drive the business via their expectations of future demand, in a metaphorical car in which households sit in the backseat receiving incomes to spend for by the business firms. The car metaphor presents the seed to an endogenous and market-driven business cycle developed in Bergström [6]. A main reason why monetary policy has problem affecting nominal GDP is that business firms control the money creation by accessing purchasing power over the balance sheet. Low and stable inflation coupled with robust growth between 1995 and 2019 owes primarily to business firms increasing money (M) and real output (Y) in tandem, thus leaving inflation (P) stable. On the contrary, in the financial economy the policy rate of the central bank is a central variable in actors’ business models. A central distinction between the real and the financial economy is the nature of assets. In the real economy, assets show up as a new real output, a period flow. In the financial economy, financial assets are more or less constant. This has big implications on how money affects the nominal output/asset (P*Y). The virtual constancy of financial assets makes money flow to financial prices (P). The policy rate is very important in setting off such financial price volatility. Hence, the conclusion here to get away with destabilizing interest rates by letting them in a reactive sense (contrary to today’s proactive, forecasting sense) follows real economic activity.
As for macro prudential policy, its part of the whole policy mix needs to be seen with the eyes of how a nonmarket-interfering monetary policy affects financial stability risks. The current setup with monetary policy in times letting interest rates deviate from real activity consistent rates represents an interference in the market economy. The role of macro prudential policy is to cover risks partly stemming from such a policy intervention. Absent such an intervention, i.e., more market economy, how will risk-taking behavior among banks, financial institutions and households change? What is clear is that macro prudential policy will be ripped of some of its power by the new central bank’s nonintervention policy. But a more exact specification of the macro prudential toolbox needs first to be analyzed in light of the new monetary policy setup. If one believes in the thesis that it is not the market economy that triggers financial instability but rather monetary policy deviations from it, then it is not self-evident that macro prudential policy needs to play a very dominant, “covering” role.
References
1.Goodhart CAE. The continuing muddles of monetary theory: A steadfast refusal to face facts. Economica. Oct 2009;76(supp. 1):821-830
2.Mankiw NG. Real business cycles: A new Keynesian perspective. Journal of Economic Perspectives. 1989;3(Summer):79-90
3.Ghoulipour H et al. Governments’ economic support for households during the COVID-19 pandemic and consumer confidence. Empirical Economics. 2023;65:1253-1272
4.Bergström K. Keynesian without the policy: Why the business cycle is all about business confidence and finance. Journal of Economic Analysis (Anser Press). 2023;2(2):114-129. Available from: https://books.anser.press › view
5.Kockerols T, Kok C. Leaning Against the Wind: Macroprudential Policy and the Financial Cycle. ECB Working Paper Series. No 2223. European Central Bank; January 2019
6.Bergström K. The crucial role for money and business firms for short-term economic growth. Review of Pacific Basin Financial Markets and Policies. 2022;25(2):2250010 (27 pages). World Scientific Publishing Co. and Center for Pacific Basin Business, Economics and Finance Research
Written By
Karl Bergström
Submitted: 15 January 2024Reviewed: 26 January 2024Published: 22 April 2024