
Abstract
In spite of young populations, sub-Saharan Africa (SSA) is lagging behind on several development indicators. Yet, previous research introduced the concept of “demographic dividend” to showcase how a country can capitalize on its population age structure to boost its economic growth, which could ultimately mitigate social inequality. To reap the demographic dividend, a country should implement major and drastic policies, including those necessary to shift its population age structure. Indeed, demographic studies showed that change in population age structure is the prerequisite to reap the demographic dividend. The proximal factors mediating its effects built upon the “enabling environment,” including policies in health, education and economics, and governance. Of course, enablers are all important; however, this chapter answers the following question: What should be the gradient among all factors in the enabling environment? The main argument is that governance, referred to as strong leadership and an enlightened vision, is the most important factor in the enabling environment. Without a significant shift in leadership in sub-Saharan Africa, no miracles could be expected and, likely, most SSA countries will not reap demographic dividend.
Keywords
- demographic dividend
- governance and public policy
- social inequality
- sustainable development goals
- sub-Saharan Africa
1. Introduction
Millennium Development Goals (MDGs) now belong to the past. Since September 2015, Sustainable Development Goals (SDGs) succeeded to MDGs and will be the driving development framework for the planet in the next 15 years. Despite the observed positive economic growth (3.5% and above), many sub-Saharan Africa (SSA) countries are still lagging behind on many health and socioeconomic indicators after the end of the MDGs and the adoption of the SDGs. The majority of countries listed at the bottom of the Human Development Index (HDI), World Governance Indicators, and Global Peace Index (GPI) rankings are located in the SSA region [1]. According to previous research, demographic burden or unfavorable demographic conditions explain the delay in achieving economic benefits and improving population well-being in SSA countries. Indeed, birth rates remain high in many SSA countries, whereas child survival has significantly improved. As a consequence, most SSA countries experienced rapid population growth. On the opposite, a young population’s age structure requires more resources in social services (education, housing, health, etc.) and would result in low economic growth [2, 3, 4]. Therefore, the demographic dividend (DD) could be used as a unified framework to define a research agenda, advocate for more effective policies, and mobilize resources for accelerated economic growth within and across countries [5, 6, 7]. Particularly, the economic growth in the region is weakening, falling to 3.5% in 2015 compared with an average of 5–7% in the last decade [2]. In between, the demographic dividend has jumped into the economic debate as a promising avenue for SSA countries to transform youth bulge into economic growth to improve population well-being. The overarching goal for MDGs, SDGs, and the demographic dividend is to improve the population well-being within a country, a region, and ultimately the whole planet through a set of well-oriented policies. If this trend continues, the relative gain of the last decade will be lost, threatening the lives of many million in the region.
This chapter builds on the existing literature on MDGs, SDGs, and the DD in sub-Saharan Africa to draw a thorough landscape and predict whether SSA countries would reap DD contingent on the actual state of development indicators in the region.
2. Demographic dividend: foundations and ongoing debate
2.1 Foundations of demographic dividend
The concept of demographic dividend (DD) has received increasing attention over the last three decades in both scientific and policymaking fora. DD refers to economic benefits that a country could gain contingent on a decline in fertility and mortality rates (see for more details: [3, 4, 5, 6, 7]) that demographers consider key factors for a change in population structure [8, 9]. Therefore, a thorough understanding of the demographic dividend might address the secular debate about the proximate determinants of fertility. Specifically, DD refers to the potential economic benefits as a result of significant shifts in population age structure, when the working-age group (15–64 years) is larger than dependents (0–14 years old and 65 years and above) [10, 11, 12].
The state-of-art of the demographic dividend, on our point of view, has focused until now on the outcome (economic growth) rather than the processes (e.g., conditions to be met to reap demographic dividend). In other words, is demographic dividend guaranteed, and under which conditions? Although both outcomes and processes are of chief importance, this chapter argues that processes are more important because a mismanagement of, or ignoring processes will lead to poor results. Lessons learned from MDGs showed that most SSA countries did not achieve MDGs. Yet, there is almost no open debate to understand the rationales behind these failures. Are financial, human, and material resources allocated or invested in MDG domains sufficient to achieve the goals that were set in MDGs? If SSA countries do repeat their MDG experiences, is there a guarantee that they will achieve SDGs? To achieve a demographic dividend, many ingredients are required including investments in health and education, the implementation of a conducive economic environment (e.g., good economic policies), and good governance. There have many attempts to explain the conditions under which and/or provide frameworks for sub-Saharan Africa to reap demographic dividend [13, 14, 15, 16, 17, 18]. These works provide a thorough understanding of the requirements for sub-Saharan Africa to reap demographic dividend [19, 20]. However, they almost all fail to address the issue of “prioritization” because governing is most and foremost about planning and prioritization.
The current literature on demographic dividend showed that the linkages between population age structure with demographic dividend as the outcome is mediated by a set of processes or policies (see Figure 1, [21]). This relationship is mediated by a set of policies called “

Figure 1.
Policy interventions facilitating demographic dividend (source: [
2.2 The ongoing debate on the demographic dividend
To answer the questions above, we emphasize that the current debate is silent about what should practically be of top priority within the enabling environment to ensure that SSA countries reap demographic dividend. Demographic dividend is neither automatic nor guaranteed; there are important political and pragmatic actions to be taken at higher levels in a country to reap the demographic dividend [13, 18, 22, 23, 24].
According to Cobb-Douglas production model [25] in its simplest form, capital and labor are important inputs required to get the expected production [16]; these inputs will determine the expected outputs. In this model, decisions about the quality of the labor force and quantity of capital invested in a firm will determine the products (quality and quantity). In the same vein, the policies implemented in education, health, economics, and the quality of governance will likely determine whether a country would reap demographic dividend.
Lessons learned from the past indicate that SSA is experiencing the highest population growth. The region has been struggling since the 1970s, when the first Knowledge, Attitudes and Practices Surveys (KAPSs) were launched to assess knowledge, attitudes, and practices of contraception among women, to take specific actions to leverage population growth. Otherwise, how could we explain that Thailand’s population structure was comparable with most SSA countries [18, 26]. Thirty-five years later, Thailand’s population age structure has radically changed, while SSA countries still have many economic dependents due to young population age structures. With young population age structures, tremendous investments are required in education, economics, health, and other social services; therefore, straining the fragile economies to invest in production sectors. To reap the demographic dividend, a country needs to evaluate its current situation (demography and economy) and consequently invest in what is required to change population structure, and thereafter, it takes specific actions for economic policies that are aligned to better achieve demographic dividend. For instance, Nigeria should wait until 2050 to exhibit a population age structure comparable to Thailand in 2000. It also means 50 years of loss in terms of demographic dividend.
The enabling environment is critical for a country to achieve the demographic dividend. Yet, there aren’t substantial debates regarding the linkages between the “enabling environment” and DD. A few exceptions do exist [3, 4, 27]. For instance, Groth et al. examined public policies to be implemented to reap DD in SSA [3]. They distinguished policies fulfilling
The programmatic implications of this reasoning are to identify the “magic button” within the enabling environment to increase the chances of a country or region to reap DD. We assume that policies in education, health, economics, and governance are relevant. That said, the underlying question could be thought of in terms of prioritization of policies within the enabling environment, especially in the context of resource scarcity. Back to Thailand’s illustration, what was done to drastically shift from a young population age structure to that where working-age share was more important? Also, what was done to efficiently utilize the working-age population to create national richness? How long did it take to reap the demographic dividend?
These questions are simple at a glance; however, they are complex and complementary. Let’s take a look at the education systems in SSA countries. Most policies in education in SSA countries address access to and quality of education to ensure that youth are well-trained and thereafter, competent in the job market. Previous research showed that the number of children and youth enrolled in education systems in SSA countries increased substantially in the last two decades [28], even though policies implemented in many SSA countries are questionable in terms of outcomes obtained so far [29]. Another issue regarding education systems in SSA is the mismatch between education curricula and job markets [30, 31]. This is even more important in the context of high unemployment rates and its interconnections with human development [32] and economic growth [33] in which national governments should be more proactive and create jobs to absorb trained youth, what Groth et al. refer to as “labor market absorptive capacity”, they share the labor market is able to utilize to sustain economic growth in countries and the region.
This chapter seeks to understand the opportunities and challenges SSA countries are facing compared to what is called the “Asian miracle” in Thailand and Asian Tigers which reaped DD in the early 1960s to the 1990s [34, 35]. There are certainly many paths that can be explored to further our understanding of the “Asian miracle.” Here, we assume that the differences between Asian Tigers and the struggles of SSA countries could partially be explained by the “leadership” styles. In fact, how could you explain that SSA countries are not able to shift their population age structures in more than 50 years since the first International Population Conference in Bucharest (19–30 August 1974) with a focus on population issues and development. While clear population policies were implemented in Asian Tigers (e.g., access to contraception and safe abortion), women in SSA countries still experience unsafe abortion and limited access to contraception, with significant urban-rural differences [36]. Commendable efforts have been observed in SSA countries to devise and implement family planning programs and policies [4, 5, 37]; however, overall modest progress in the implementation of family planning programs and policies has been observed [37]. As a consequence, the necessary shift in population age structures in SSA countries is still lacking; therefore, postponing the real demographic dividend due likely to poor leadership and questionable governance [38, 39, 40, 41]. Indeed, governance is crucial to create the necessary shift in population age structures [41] and finally to reap DD in SSA countries [42, 43, 44, 45].
Meanwhile, it is important to unpack, among scientists and policymakers, the black box
SSA is full of harmful socioeconomic experiences, including slavery over centuries, structural adjustment programs in the 1980s, democratization in the early 1990s, political instability, and so on. The region should learn from these experiences and build socioeconomic resilience to better path the future. Overall, the same recipes will always produce likely same results. It is therefore important that SSA countries think of radical political shifts to get better and different socioeconomic outcomes, including demographic dividend. It is clear from the examples above regarding HDI, democracy, and economy that SSA countries are suffering from poor leadership. It is not surprising that these countries did not achieve MDGs, and likely will not achieve SDGs. Likewise, it is unpredictable what these countries will achieve in the next decades. A clear roadmap toward sustainable development is a prerequisite to demographic dividend and socioeconomic development. Indeed, previous studies showed that strategic planning leads to successful socioeconomic development [45, 46]. Definitely, SSA countries have the potential to reap demographic dividend; however, a radical political shift is compulsory toward strong leadership and effective policies benefiting the countries. For example, SSA countries currently have important working-age population shares worldwide. However, high unemployment rates create unfavorable conditions for economic growth in SSA countries [48, 49]. Figure 2 [48] shows that unemployment rates have steadily increased since 2015 despite solid economic growth between 2016 and 2020. Under these conditions, highly educated youth will not positively contribute to economic growth.

Figure 2.
Unemployment rates in sub-Saharan Africa 1991—2023 (source: [
High unemployment rates also imply that informal employment is still prevalent in SSA countries; yet, decent jobs are crucial to generating sustainable income on the one hand, and on the other hand, creating pathways to poverty reduction [50]. There are other dimensions to incorporate to better fight social inequalities, including gender [49, 50] and rural-urban differences [51]. In sum, while a shift in population age structures is important, effective and efficient policies on health, economics, and education are equally important.
2.3 Digging into governance in sub-Saharan Africa: empirical evidence
This sub-section provides empirical evidence of the progress made so far in SSA countries to showcase whether sub-Saharan African countries could reach demographic dividend under actual conditions, using a dataset from the Bertelsmann Stiftung’s Transformation Index (BTI) project [52] on three dimensions: political, economic, and governance.1
Figure 3 displays the progress made in Africa toward governance, democracy, and economy between 2006 and 2022. Countries were classified into three categories: deterioration, no changes, and improvement. From Figure 3, it is clear that most SSA countries in Africa were in the “no changes” category between 2006 and 2022. This is alarming because, over sixteen years, countries did not make significant progress in terms of governance, democracy, and economy. Therefore, how can these countries reap demographic dividends without a significant shift in how public affairs are ruled? Yet, scholars and practitioners contend that good governance is key to achieve positive social and economic outcomes. Some countries have achieved in the last two decades interesting results in their economies; however, the social landscapes still are marked by inequalities and inequities with increasing share of people living in poverty, and those who cannot access decent healthcare.
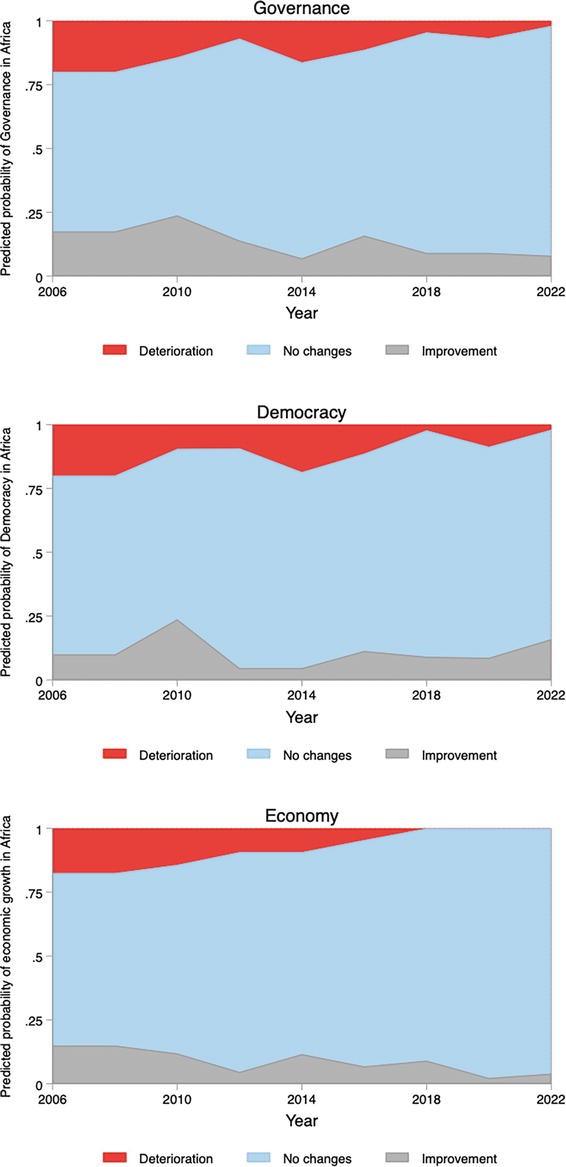
Figure 3.
Evolution of three indicators of leadership between 2006 and 2022. Panel A: governance; panel B: democracy; panel C: economy (source: [
Figure 4 displays the ranking of countries in Africa based on four indicators in 2006 (baseline) and 2022 (endline): status index; democracy status; economy status; and governance index. Again, findings indicated that, between 2006 and 2022, the progress as measured by the status index, democracy status, economy status, and governance index is not significant. Most countries in Africa are located at the bottom of the charts. This means that these countries are not well ruled out on one hand, and on the other hand, they are lacking strong leadership. A closer look at Figure 4 showed that the difference in rankings for each country between 2006 and 2022 is very small. More importantly, Figure 4 shows that many SSA countries shifted from left to right, meaning that the indicators have worsened between 2006 and 2022. In doing so, the chapter addressed the underlying question about the progress of socioeconomic development in SSA countries and how likely these countries could not achieve demographic dividend under such socioeconomic conditions.

Figure 4.
Ranking of countries in Africa concerning Status Index (panel A), democracy status (panel B), economy status (panel C), and governance index (panel D) between 2006 (baseline) and 2022 (endline) (source: [
From Figure 1, the chapter argues that governance is the most important building block of the “enabling environment”. Evidence showed that SSA countries are not well ruled according to the indicators on governance, democracy, and economy. As such, these countries would not likely achieve DD. Therefore, the actual portrait of SSA countries could jeopardize Sustainable Development Goals (SDGs) in the region. Yet, SDGs could eliminate or significantly reduce social inequality within and across countries if more effective interventions are implemented in SSA countries.
3. A call for action for effective policies and social inequality reduction
Demographic dividend is a politico-driven economic benefit of a country due to fertility and mortality declines, and well-oriented economic policies to boost economic growth by effectively and efficiently utilizing its working-age population. Demographic dividend is not a miracle that the scientific community will bring to on table by its tons of presentations and debates. This chapter argues that while all components in the enabling environment are necessary, there is a need to establish a gradient to better feed up the debate on demographic dividend: some components are more important than others even though they are all intertwined. In this short viewpoint, we posit that governance through strong leadership and vision is of paramount importance if SSA countries want to reap demographic dividends and if they want to be on track with SDGs.
Strong leadership and a clear vision highly impact institutional quality within a country, which in turn plays an important role in attracting foreign capital. An excellent example of institutional quality in attracting foreign capital can be found in Costa Rica [54] and Central America [53]. These studies analyzed the final decision of Intel to relocate to Costa Rica in 1996. Mexico and Costa Rica were shortlisted in the final stage of the decision process. Both countries share similarities; for instance, they had a GDP per capita of $US 3000.00 at that time; however, Costa Rica’s stability and lower corruption tilted the balance in favor of the country.
One of the key issues impeding the realization of the demographic dividend is the lack of clear understanding of the fuzzy phrase of “enabling environment.” In many instances, the phrase is vaguely equated with governance, which itself, also lacks a precise and clear definition. In many circles, governance is equated with electoral democracy. However, the return and proliferation of electoral democracies in many SSA countries in the last decade have not led to “good governance.” While electoral democracy is key to good governance, it is not a sufficient condition for realizing the DD. The key to the realization of the DD is a sustained transformational visionary national leadership, which is lacking in the region. By transformational visionary national leadership, we mean consistent and nationalistic governments with a well-thought and dynamic blueprint for national development and population health and wellbeing. While most SSA countries have experienced rapid growth in their gross domestic product (GDP), they rank very low on the Human Development Index (HDI). This is one major difference between the Asian Tigers and SSA countries. In Asian Tigers, the DD was realized by a sustained political handiwork of visionary, focused, strong, and committed national leaderships, who for a long time, pursued and remained committed to a clear agenda of national development and growth. For the most part, this involved a sustained stay in power of a truly nationalistic and forward-looking political class and leadership with clear development policies and agendas as well as unreserved commitment to the development of human resources to generate new and appropriate locally relevant knowledge, operationalize and transfer of existing technologies, promote and accelerate industrialization, institutionalize infrastructural development, and revolutionize social systems to deliver efficient, accessible, and people-oriented services to prevent and control diseases, misery, suffering, and reduce threats.
SSA has plenty of interesting historical experiences to guide current efforts to harness the DD with the ultimate objective of reducing social inequality in the region: slavery, structural adjustment programs, democratization, political instability, and imperialism. From these critical socio-economic events, sub-Saharan Africa (SSA) has learned about its friends, enemies, challenges, weaknesses, and strengths. SSA also learned how to make progress. Prudent, strong, and committed political leadership should have avoided many of the mistakes, pains, and troubles from the past. With a visionary, focused, conscious, and truly nationalistic leaderships, SSA would avoid repeating the recipes that have produced very poor development outcomes in the past. Key to the realization of the DD is political leadership that does not merely assert but unquestionably demonstrates its commitment to sustainable development and progress through well-thought-out plans and policies to improve lives and ensure well-being. Such leadership must be experienced enough to be able to contradistinguish between political ends and economic realities and how to truly work for the citizenry, not for foreign and personal political and economic interests. The core of the DD miracle is a conscientious political leadership that clearly thinks of countries’ social inequality reduction, and develops, and implements a meticulous and dynamic development path and program. Put differently, SSA countries have the potential to realize the demographic dividend. But this is conditional upon an immediate shift toward a strong dedicated political leadership with a commitment to long-term national development. For example, SSA countries currently have some of the most desirable working-age populations worldwide. In most developed countries, the working-age population is declining. It will take visionary leadership to take advantage of such a population structure and ensure that it is fully harnessed to the benefit of Africa.
Without a significant shift in governance, the demographic dividend in SSA will be a vain vow because “there will be no miracles.” SSA countries have made a lot of economic progress during the last decades garnering an impressive economic growth of close to two digits. However, nothing has changed for the “normal” populations: poverty still is rampant; life expectancy is the lowest in SSA compared to the rest of the world, and TFRs still are the highest in SSA countries. With the understanding of the root problems regarding economic challenges in the region, the remaining question is “What does it take to move a step ahead with the right decisions which could drive a sustainable socio-economic development?” We are optimistic that SSA countries’ governments will seize the potential opportunities to place their countries on the right track to reap demographic dividend in this twenty-first century.
4. Summary and concluding remarks
Human capital, measured by the working-age group in most SSA countries, is incontestably the greatest and cheapest resource countries can capitalize on to reap demographic dividend (DD). Definitively, DD could mitigate social inequality in SSA countries if sound and effective policies are implemented. However, statistics clearly indicate that SSA countries will not reap DD under current circumstances. In fact, socioeconomic indicators showed that most SSA countries are lagging very behind with persisting poverty and increasing shares of vulnerable populations. Therefore, this chapter addressed the crucial question of the “gradient” in the enabling environment to ensure that sound and effective policies are implemented with the ultimate goal to reap DD on the one hand, and on the other hand, that the resulting economic growth from DD to mitigate social inequality and improve population wellbeing in SSA countries. A critical analysis of the enabling environment referred to as the mediating factors between population age structure and the expected economic growth, showed that governance should be the first pillar to ensure that SSA countries could reap DD. Governance is a complex and interdisciplinary bridging concept; however, its most interesting feature is “leadership,” which can really make a difference, especially in the context of SSA. Enlightened and visionary leaders create and maintain cultures of integrity, competence, and service. Great leaders anticipate emerging challenges and opportunities to provide local solutions to global issues. Rampant poverty, social inequalities, and inequities in healthcare, high unemployment rates, and weird school outcomes could only be tackled with enlightened leadership with a clear vision to solve local issues by implementing adapted solutions.
The evidence reported in this chapter has strengths and limitations. Among the strengths, conclusions are based on a situational analysis of development indicators in SSA countries and reliable databases including The World Bank and BTI. A major limitation is that the chapter did not report within countries disparities; this is partly due to the lack of reliable data to dig deeper into social inequalities within countries. Programmatically, national governments should work to improve data governance to provide a thorough landscape of social inequalities in their countries based on reliable data.
References
- 1.
International Monetary Fund (IMF). Regional Economic Outlook. Sub-Saharan Africa: Time for a Policy Reset, in World Economic and Financial Surveys [Internet]. Washington, DC 20090 (U.S.A.): International Monetary Fund; 2016. p. 137. Report No.: 0258-7440. Available from: https://www.imf.org/en/Publications/REO/SSA/Issues/2016/04/05/Time-for-a-Policy-Reset - 2.
Groth H, May JF, Turbat V. Policies needed to capture a demographic dividend in sub-Saharan Africa. Canadian Studies in Population (Cape Town, South Africa). 2019; 46 :61-72. DOI: 10.1007/s42650-019-00005-8 - 3.
Groth H, May JF, Turbat V. Policies needed to capture a demographic dividend in Sub-Saharan Africa. Canadian Studies in Population. 2019; 46 (1):61-72. Available from:http://link.springer.com/10.1007/s42650-019-00005-8 - 4.
May JF, Turbat V. The demographic dividend in Sub-Saharan Africa: Two issues that need more attention. Journal of Demographic Economics. 2017; 83 (1):77-84. Available from:https://www.jstor.org/stable/26422414 - 5.
Garenne M. Where are the demographic dividends in Sub-Saharan Africa? World. 2023; 4 (3):612-623. Available from:https://www.mdpi.com/2673-4060/4/3/38 - 6.
Tsala Dimbuene Z, Haregu TN, Nzita Kikhela PD, Muanza NR. The role of leadership in Sub-Saharan Africa in promoting maternal and child health and Sandra Babic. In: Jovandaric MZ, Babic S, editors. Maternal and Child Health. London, UK: IntechOpen; 2023 - 7.
Desai S. The other half of the demographic dividend. Economic and Political Weekly. 2010; 45 (40):12-14. Available from:https://www.jstor.org/stable/25742137 - 8.
Bongaarts J. Fertility transitions in developing countries: Progress or stagnation? Studies in Family Planning. 2008; 39 (2):105-110. Available from:https://www.jstor.org/stable/20454448 - 9.
Bongaarts J. Global fertility and population trends. Seminars in Reproductive Medicine. 2015; 33 (1):5-10. Available from:http://www.thieme-connect.de/DOI/DOI?10.1055/s-0034-1395272 - 10.
Bongaarts J, Casterline J. Fertility transition: Is sub-Saharan Africa different? Population and Development Review. 2013; 38 :153-168. Available from:https://www.jstor.org/stable/23655292 - 11.
Bongaarts J. Modeling the fertility impact of the proximate determinants: Time for a tune-up. Demographic Research. 2015; 33 :535-560. Available from:https://www.demographic-research.org/articles/volume/33/19/ - 12.
Majunder N, Ram F. Explaining the role of proximate determinants on fertility decline among poor and non-poor in Asian countries. PLoS ONE. 2015; 10 (2):e0115441. Available from:https://journals.plos.org/plosone/article?id=10.1371/journal.pone.0115441 - 13.
Bloom DE, Canning D, Fink G, Finlay JE. Fertility, female labor force participation, and the demographic dividend. Journal of Economic Growth. 2009; 14 (2):79-101. DOI: 10.1007/s10887-009-9039-9 - 14.
Lee R, Mason A. What is the demographic dividend? Finance & Development. 2006; 43 (3):16-17 - 15.
Williamson JG. Demographic dividends revisited. Asian Development Review. 2013; 30 (2):1-25 - 16.
Rusatira JC, Cardona C, Martinez-Baack M, Rimon JG, Ahmed S. Development of the Demographic Dividend Effort Index, a novel tool to measure existing efforts to create a favourable environment to harness a demographic dividend: Results from an experts’ survey from six sub-Saharan African countries. BMJ Open. 2023; 13 (3):e059937. Available from:https://bmjopen.bmj.com/content/13/3/e059937 - 17.
Roy M, Kayesh MS. Reaping demographic dividend in Bangladesh: Challenges and prospects. Global Journal of Human-Social Science. 2016; 16 (2):11-20. Available from:https://socialscienceresearch.org/index.php/GJHSS/article/view/1772 - 18.
Olaniyan O, Soyibo A, Lawanson AO, Olasehinde N, Odumosu M, Orekoya A, et al. Harnessing the Demographic Dividend for Nigeria’s Sustainable Development: 2016 Demographic Dividend Report of Nigeria. Nigeria: United Nations Population Fund; 2018 - 19.
Onyango BO, Oosthuzien M, Zulu EM, Williams EM, Allhassan N. Barriers to maximising the demographic dividend in Southern Africa: Fertility and labour market scenarios in Botswana, Namibia, Swaziland and Zimbabwe. In: Paper Presented at the Population Association of America Annual Meeting, Denver, Colorado, April 26-28, 2018 - 20.
Izugbara CO, Tilahun T, Owii H. Fostering political leadership for the demographic dividend in Africa: Relevant cultural values. Development in Practice. 2018; 28 (5):705-713. DOI: 10.1080/09614524.2018.1465528 - 21.
Gribble JN, Bremner J. Achieving a demographic dividend. Population Bulletin. 2012; 67 (2):1-15. Available from:https://www.popline.org/node/566139 - 22.
Gupta MD. Reaping demographic dividend: Components and policies required. In: Paper Presented at the Population Association of America Annual Meeting, San Diego, April 30-May 2, 2015 - 23.
Dramani L. Harnessing demographic dividend in Africa: A framework for strategic sectoral investments analysis. In: Paper Presented at the Population Association of America Annual Meeting, Denver, Colorado, April 26-28, 2018 - 24.
United Nations, Department of Economic and Social Affairs. Harnessing the Economic Dividends from Demographic Change [Internet]. 2023. p. 9. Available from: https://www.un.org/development/desa/dpad/wp-content/uploads/sites/45/FTI_2023_July.pdf - 25.
Zellner A, Kmenta J, Drèze J. Specification and estimation of Cobb-Douglas production function models. Econometrica. 1966; 34 (4):784-795. Available from:https://www.jstor.org/stable/1910099 - 26.
World Life Expectancy [Internet]. Thailand Population pyramid. Available from: https://www.worldlifeexpectancy.com/thailand-population-pyramid - 27.
Turbat V. The demographic dividend: A potential surplus generated by a demographic transition. In: Groth H, May JF, editors. Africa’s Population: In Search of a Demographic Dividend. Cham: Springer; 2017. pp. 181-195 - 28.
Lewin KM. Access to education in sub-Saharan Africa: Patterns, problems and possibilities. Comparative Education. 2009; 45 (2):151-174. DOI: 10.1080/03050060902920518 - 29.
Nudzor HP. Taking education for all goals in sub-Saharan Africa to task: What’s the story so far and what is needed now? Management in Education. 2015; 29 (3):105-111. DOI: 10.1177/0892020615584105 - 30.
Bandara A. Youth labor market expectations and job matching in sub-Saharan Africa: Evidence from school-to-work transition surveys. Applied Economics. 2019; 51 (8):762-780. DOI: 10.1080/00036846.2018.1512742 - 31.
Afedzie RH, Aller J, Nketia J. Reshaping education for the new labour market in Sub-Saharan African Countries. In: Research Anthology on Business and Technical Education in the Information Era [Internet]. Hershey, Pensylvania, United States of America: IGI Global; 2021. pp. 403-417. Available from: https://www.igi-global.com/chapter/reshaping-education-for-the-new-labour-market-in-sub-saharan-african-countries/www.igi-global.com/chapter/reshaping-education-for-the-new-labour-market-in-sub-saharan-african-countries/274373 - 32.
Akinyele OD, Oloba OM, Mah G. Drivers of unemployment intensity in sub-Saharan Africa: Do government intervention and natural resources matter? Review of Economics and Political Science. 2022; 8 (3):166-185. DOI: 10.1108/REPS-11-2020-0174 - 33.
Abraham IO, Ozemhoka AM. Youth unemployment and economic growth: Lesson from low-income countries in Sub-Saharan Africa. European Journal of Economics, Law, and Politics. 2017; 4 :1. Available from:https://heinonline.org/HOL/Page?handle=hein.journals/ejelp4&id=13&div=&collection= - 34.
World Bank. International Monetary Fund (IMF). Global Monitoring Report 2015/2016: Development Goals in an Era of Demographic Change [Internet]. Washington, DC: World Bank; 2016. Available from: https://www.worldbank.org/en/publication/global-monitoring-report - 35.
Thakoor V, Wakeman-Linn J. Surf the demographic wave. Finance & Development. 2016; 53 (1). Available from:https://www.imf.org/external/pubs/ft/fandd/2016/03/thakoor.htm - 36.
Marston C, Cleland J. Relationships between contraception and abortion: A review of the evidence. International Family Planning Perspectives. 2003; 29 (1):6-13. Available from:https://www.jstor.org/stable/3180995 - 37.
May JF. The politics of family planning policies and programs in sub-Saharan Africa. Population and Development Review. 2017; 43 :308-329. Available from:https://www.jstor.org/stable/26622884 - 38.
Bloom DE, Kuhn M, Prettner K. Afirca’s prospects for enjoying a demographic dividend. Journal of Demographic Economics. 2017; 83 (1):63-76. Available from:https://www.cambridge.org/core/journals/journal-of-demographic-economics/article/abs/africas-prospects-for-enjoying-a-demographic-dividend/4B9493B9D0A388889BCD28BD9932707B - 39.
Ahmed SA, Cruz M, Go DS, Maliszewska M, Osorio-Rodarte I. How significant is Sub-Saharan Africa’s demographic dividend for its future growth and poverty reduction? Review of Development Economics. 2016; 20 (4):762-793. Available from:https://onlinelibrary.wiley.com/doi/abs/10.1111/rode.12227 - 40.
Eastwood R, Lipton M. Demographic transition in sub-Saharan Africa: How big will the economic dividend be? Population Studies. 2011; 65 (1):9-35. DOI: 10.1080/00324728.2010.547946 - 41.
Osei-Appaw A, Christian A. The demographic dividend as a pathway to development: The role of fertility and education in Sub-Saharan Africa. A narrative review. International Journal of Economics. 2022; 7 (1):76-90. Available from:https://iprjb.org/journals/index.php/IJECON/article/view/1680 - 42.
Woldegiorgis MM. Drivers of demographic dividend in sub-Saharan Africa. Review of Evolutionary Political Economy. 2023; 4 (2):387-413. DOI: 10.1007/s43253-023-00094-x - 43.
Kuyoro M, Leke A, White O, Woetzel J, Jayaram K, Hicks K. Reimagining Africa’s Economic Growth | McKinsey [Internet]. Washington, D.C.: McKinsey; 2023. p. 66. Available from: https://www.mckinsey.com/mgi/our-research/reimagining-economic-growth-in-africa-turning-diversity-into-opportunity - 44.
Wirajing MAK, Nchofoung TN, Etape FM. Revisiting the human capital–economic growth nexus in Africa. SN Business & Economics. 2023; 3 (7):115. DOI: 10.1007/s43546-023-00494-5 - 45.
Fuseini I, Kemp J. A review of spatial planning in Ghana’s socio-economic development trajectory: A sustainable development perspective. Land Use Policy. 2015; 47 :309-320. Available from:https://www.sciencedirect.com/science/article/pii/S0264837715001222 - 46.
Agasisti T, Bertoletti A. Higher education and economic growth: A longitudinal study of European regions 2000-2017. Socio-Economic Planning Sciences. 2022; 81 :100940. Available from:https://www.sciencedirect.com/science/article/pii/S0038012119306809 - 47.
International Labour Organization. Report on Employment in Africa (Re-Africa) Tackling the Youth Employment Challenge [Internet]. Geneva, Switzerland: International Labour Office; 2020. p. 92. Available from: https://www.ilo.org/wcmsp5/groups/public/---africa/---ro-abidjan/documents/publication/wcms_753300.pdf - 48.
Macrotrends. Sub-Saharan Africa Unemployment Rate 1991-2023 [Internet]. Available from: https://www.macrotrends.net/countries/SSF/sub-saharan-africa-/unemployment-rate - 49.
Ferrant G. How do gender inequalities hinder development? Cross-country evidence. Annales d'Economie et Statistique. 2015; 117/118 :313-352. Available from:https://www.jstor.org/stable/10.15609/annaeconstat2009.117-118.313 - 50.
Altuzarra A, Gálvez-Gálvez C, González-Flores A. Is gender inequality a barrier to economic growth? A panel data analysis of developing countries. Sustainability. 2021; 13 (1):367. Available from:https://www.mdpi.com/2071-1050/13/1/367 - 51.
Sehrawat M, Giri AK. Financial development, poverty and rural-urban income inequality: Evidence from South Asian countries. Quality and Quantity. 2016; 50 (2):577-590. DOI: 10.1007/s11135-015-0164-6 - 52.
BTI. 2022. Available from: https://bti-project.org/en/downloads - 53.
Larrain BF, Lopez-Calva LF, Rodriguez-Clare A. Intel: A Case Study of Foreign Direct Investment in Central America. Report No.: CID Working Paper No. 58. Boston, MA; 2000. p. 40 - 54.
Spar D. Attracting High Technology Investment: Intel’s Costa Rica Plant. Washington, DC: International Monetary Fund (IMF); 1998. Report No.: 17753
Notes
- Readers might consult the documentation to better understand the construction of the indicators, which is beyond the scope of the chapter. The Bertelsmann Stiftung’s Transformation Index (BTI) project collects and publishes every two years, information on developing countries and countries in transition the progress toward democracy and a market of economy. Overall, BTI classifies countries according to two main dimensions: (i) status index measures the state of political (based on five criteria) and economic (based on three criteria), while (ii) governance Index measures political leadership (based on five criteria) toward democracy and a market of economy. Details can be found here [53].