
Abstract
This study analyses the city and its surroundings as an integrated natural-anthropogenic system, emphasising ecological urbanisation within the global urbanisation framework. This component is represented as a cycle of interlinked adverse processes, delineating the resilience limits of natural systems under urban anthropogenic impacts. Utilising indicator-based methods, we assessed multifactorial urban impacts on the environment, proposing a practical approach to calculate the ecological urbanisation indicator. Using the indicator, we have investigated the regional aspect of the atmospheric environment’s condition and identified the impact of urban sources of pollution. Additionally, we identified the main patterns of natural and human-induced hazards correlating with different levels of ecological urbanisation in different territories on the example of Ukrainian regions. Our approach addresses the uneven urban load across areas, which is essential for creating regional sustainable development strategies. It integrates environmental factors into regional safety management, requiring principles that regulate environmental impacts and promote safe land use.
Keywords
- urbanised territories
- indicator assessment methodology
- environmental urbanisation
- hazards
- air resources in urban settings
1. Introduction
In today’s world, it is not enough to define urbanisation as the growth and development of cities with a concentration of people who have chosen an urban lifestyle. Urbanisation represents a civilizational choice of humanity, a way to adapt to the conditions brought about by scientific and technological progress, which inevitably enhances the role of cities in societal development. The process of urbanisation is sweeping the globe: at the beginning of 2023, the urban population accounted for 57% of the world’s total population, or 4.52 billion people, and according to data, this figure will gradually increase to 70% by 2050 [1].
Modern Ukraine ranks among the highly urbanised countries, with approximately 70% of its population residing in urban areas [2]. As of 2020, this placed Ukraine 76th in the global ranking of 195 countries and 25th among 44 European nations [3]. However, Ukraine exhibits several fundamental differences from other countries in terms of demographic processes. This is manifested in the sharp decline in the total population, including the urban population (depopulation rates were 1.35 for the total population and 1.2 for the urban population [1, 2] over the period 1991–2021). The coevolution of technological development (techno-genesis) and urbanisation processes has led to an extremely uneven distribution of the urban population (28.6937.08 million individuals as of January 2022 [2]) across 461 cities that occupy only 3% of the country’s territory (19,000 km2) [2]. The placement of Ukrainian cities corresponds to the economic complex established during the Soviet era, although their number has slightly increased (from 434 in 1989 to 461 in 2022 [2]). The population dynamics of cities have also shifted: 14 medium-sized cities (mostly mono-specialised) have been reclassified as small cities, and 2 cities (Donetsk and Dnipro) have lost their status as million-plus cities.
The environmental state of Ukraine’s regions is formed by a combination of factors: on the one hand, the regional differentiation of technogenic (human-induced, technological) processes due to established economic complexes, and on the other, the high mosaic of natural landscapes and their varying types of resilience. The haphazard nature of urban development and the lack of strategic planning in alignment with sustainable development goals have led to a high degree of diversity between regions. This diversity is evident not only in levels of urbanisation (ranging from 37% in the Zakarpatsky region to 90% in the Donetsky region) but also in the ratio of small, medium, and large cities and other parameters indicative of “urban saturation” within administrative units. Furthermore, for most regions, the parameters of demographic urbanisation do not correlate with the indicators of city density and urban population density. Thus, the urbanisation process in different regions is uneven, with varying intensity and manifesting in diverse forms.
Urbanisation is driving negative changes in urban climate and landscapes, chronic pollution, and the dense location of hazardous industrial, energy, and transport facilities within or near residential areas. To detail the territorial features of cities’ environmental impact as holistic entities, it is advisable to use the indicator method. Improving and further developing the system of environmental indicators requires taking into account the factors of homogeneity and differentiation of Ukraine’s regions by the potential of urban hazards to the environment, human life, and health. Integrating ecological indicators into the urbanisation indicators system enables the identification of the impacts of cities, varying by population size and functional purpose, on environmental elements and also allows to differentiate administrative regions of Ukraine by the nature of such impacts. The practical application of the urbanisation indicator lies in determining the regional level of urban-generated pressure on territories and predicting their implications within the framework of the country’s sustainable development plans.
2. Advancing the indicator method for assessing the ecological resilience of urban areas
An indicator is the most generalised measure of the state of the system and its dynamic changes, among which there are stand-alone and aggregate indicators. Stand-alone indicators reflect specific aspects of the state of the system under study, while aggregated ones correspond to complex indicators. They reflect the weight of the indicator, the degree of its involvement in the assessment, the coefficient of use, and correspond to the term “index”.
The concept of global ecological indicators, put forth by the Organization for Economic Co-operation and Development (OECD) in 2004 [4], concurrently provides a unique collection of environmental statistics for 10 indicators (Climate Change, Ozone Layer, Air Quality, Waste Generation, Freshwater Quality, Freshwater Resources, Forest Resources, Fish Resources, Energy Resources, and Biodiversity) [5]. This collection facilitates the evaluation of environmental policy effectiveness predominantly in European and some non-European countries. Regrettably, Ukraine’s presence in the Environment Statistics database [5] is limited to certain sections (greenhouse gas emissions). The EU’s strategy for the environmental dimension of Sustainable Development (SD) is based on indicator groups aligned with Sustainable Development Goals (SDG), among which “Sustainable Cities and Communities” indicators [6] outline European policy trends in this direction. Additionally, the UNECE Working Group on Environmental Monitoring and Assessment recommended 118 top-priority indicators for Eastern European countries from a basic set of 356 indicators based on seven criteria [7]. Current EU trends, as outlined in Eurostat’s publication “Sustainable Development in the European Union — 2022 Monitoring Report on progress towards the SDGs in an EU context” [8], though not an official stance of the EU, reflect the main trends of changes in around 100 indicators structured around 17 SDG. Over a 5-year (short-term) period, among the “Sustainable Cities and Communities” indicators, 11 are aimed at increasing community access to basic services, energy, housing, transportation, and green spaces, while simultaneously reducing resource use and environmental impact.
Using various indicator systems and indices to assess environmental conditions in the light of accelerated urbanisation processes sweeping many countries across Asia, America, and Europe is a “top topic” of scientific research. The rapid urban development and significant population growth in China have spurred numerous studies assessing air pollution in urbanised territories [9, 10, 11], climate changes [12], shortages of quality drinking water [13, 14], and other issues linked to the growing imbalance between the natural environment and urbanised areas.
The sustainable use of water resources is a crucial prerequisite for the sustainable development of urban areas and countries in general. Urbanisation processes have a comprehensive impact on water bodies not only near cities, but also far beyond them. Global urbanisation and environmental degradation are leading to a rapid decline in the quality and quantity of water resources, thereby limiting their suitability for comprehensive use. Huge pressure on water resources from an expanding population is associated with changes in land use [14, 15], development in watershed areas, and alterations in vegetation cover [13], as well as groundwater depletion in the world’s megacities [16].
Numerous indicators and indices reflect the importance of combining integrated urban water management and planning for increasing water consumption over time. The Driving Forces, Pressures, States, Impacts, and Responses (DPSIR) framework facilitates the assessment of water use indicators according to sustainable development criteria [17]. The DPSIR indicator system can be presented as a set of indicators reflecting the ecological status responses of urban systems to anthropogenic pressures of various genesis. DPSIR indices are determined based on statistical data and are part of the well-known Pressure-State-Response (PSR) indicator system [18, 19], developed by the OECD [20].
The shortage of fresh surface water transforms the water management issue into a national threat for many countries, including Ukraine. Sustainable water use indicators [21] compare demographic-economic factors (population growth, gross domestic product) with water demand and water availability. The use of such a system of indicators justifies the regulation of demography and the economy, ensuring compliance with clear rules to limit pollution of basin areas, preserve aquifers, and save water.
The value of the indicator approach in identifying correlations between economic and ecological subsystems lies in its integration into practices across various management levels [22, 23, 24]. Among the key indicators assessing the effectiveness of environmental policy, ecological taxes are highlighted as crucial in Ref. [25], based on indicators that are regularly monitored by the European Environment Agency (EEA), OECD, and EUROSTAT. The contemporary perspective on environmental regulation encompasses the integration of urban land use efficiency, green technology innovations, and the conservation of both natural landscapes, especially forests, and urban green spaces [15, 26, 27, 28].
Ukraine ranked 36th out of 165 countries in the Sustainable Development Index, which is annually compiled by the United Nations and the Bertelsmann Foundation ([29], p. 470). Unfortunately, the performance indicators for SDG11 – Sustainable Cities and Communities are currently in the “orange zone” and do not yet reflect the country’s progress towards sustainable urbanisation. Ukraine has joined the global effort to achieve sustainable development, with strategic frameworks set for the period up to 2030 [30]. The national system consists of 86 national development goals and includes indicators to monitor the realisation of goals and targets, adapted to the Ukrainian context. Ukraine has presented three voluntary National Monitoring Reports: “Sustainable Development Goals: Ukraine 2019” [31], “Sustainable Development Goals: Ukraine 2020” [32], and “Sustainable Development Goals: Ukraine 2021” [33]. The war in Ukraine has interrupted not only the nascent monitoring process but also the country’s development itself. However, Ukrainian scientists continue to work both on improving indicators and on methods of their measurement [34] and on analysing the reasons that did not allow achieving the Goal 11 (Sustainable development of cities and communities) [35].
Overall, the implementation of a sustainable development strategy and a voluntary reporting system in Ukraine has stimulated the development of comprehensive indicators for assessing the environmental condition of regions and the sustainability of individual cities, including indicators of the environmental dimension [36, 37, 38, 39, 40, 41, 42].
Unfortunately, Ukraine still lacks sufficiently developed indicator systems for assessing the regional aspects of sustainable development. Research by national scientists using the index approach has primarily focused on comparing the country’s administrative regions based on natural and technogenic hazard factors [43, 44, 45, 46, 47]. The decrease in the total number of natural disasters and the 1.3-fold excess of man-made threats over natural ones in most regions of the country are established in Ref. [45]. The advantages of the indicator method include the broad application of mathematical models and modern information technologies, which enable not only the assessment but also the prediction of territorial risk conditions [47]. In general, the indicators are intended to be the basis for the implementation of coordinated measures to minimise and prevent negative environmental changes and deterioration of overall safety. Their implementation into Ukraine’s actual policy should aim to address global issues such as poverty alleviation, ensuring high quality of life, and the safety of urban populations.
In contrast, our analysis of methods for ranking Ukrainian regions based on ecological safety [48] revealed significant discrepancies in the assessment results obtained using indexes and risk indicators. This contradicts the principle of systematisation and diminishes the effectiveness of ecological safety management at the national level. Regional “safety” rankings do not highlight the contribution of urban systems to the ecological state of a region. Generally accepted assessments are limited to the criteria of unilateral negative impacts of cities on the environment and do not include reverse cumulative effects when areas are globally covered by urbanisation processes.
3. The formation of the environmental state of the “city-adjacent territories” system
To accurately consider the “city – adjacent areas” system, let us clarify some concepts. Indeed, it is crucial to differentiate between “city” and “urban agglomerations,” as well as “suburban areas” and “adjacent areas”. In Ukraine, the term “suburban territory” is not clearly defined ([49], p. 84). It can refer to city green belts, like forests and parks, as well as small suburban settlements. It also includes urban high-rise districts, such as the “Rainbow” area in Odesa. Additionally, farms, agricultural lands, and industrial enterprises that create urban industrial zones fall under this category. Various interpretations of “suburban zone” are discussed in Ref. [50]. Indeed, the interconnection between a city and its suburban areas is in a symbiotic development. Unfortunately, in Ukraine, the features of suburban areas’ development are almost unstudied, except for the general acknowledgment that they are impacted by cities and slowly become urbanised. Official information sources do not include data on city territory expansion through the incorporation of suburban areas. However, the problem of merging cities with suburban areas into urban agglomerations is of utmost importance all over the world. The main stages of this process for different continents are analysed in Ref. [51]. The authors noted terminological discrepancies in defining urban agglomerations, identified infrastructure expansion (especially railway lines) as a leading factor in urban space growth and aptly described this process as “Urban sprawl flooding”.
Urban agglomerations serve both as a reserve for city development and as a framework for urban settlement within administrative-territorial units. Unfortunately, a legislative definition of urban agglomeration in Ukraine (23 ones by official counts as of the beginning of 2013) is still lacking. The cities within the 19 largest agglomerations were home to about 17 million people, accounting for 36% of the country’s population [2]. However, the State Strategy for Regional Development for 2021–2027 [52] only recognises following agglomerations—Kyiv, Kharkiv, Dnipro-Kamianske, Zaporizhzhia, Kryvyi Rih, Odesa, and L’viv. It is important to note that the World Bank (OECD) [53] establishes these agglomerations using a publicly undisclosed methodology, which differs from the night-time lights (NLS) mapping method used.
Since 2017, the draft law “On Urban Agglomerations” [54] has yet to be considered in Parliament. In 2022, the concept of a draft law defining “Agglomeration as a special form of cooperation between territorial communities (urban, settlement, rural) located in the zone of impact of the agglomeration centre” was developed by the Association of Ukrainian Cities [55]. The revised edition emphasises that agglomerations are essential for both the communities and the state, and that formalising this cooperation model in Ukrainian legislation will create additional opportunities for the development of territories and Ukraine’s economy. In September 2022, a public discussion on the role of agglomerations in war and post-war reconstruction took place in L’viv during the IX National Forum of Local Self-Government, supported and moderated by the Council of Europe [56]. Regrettably, since the onset of the war, this law has not been adopted. The delay in the legislation creates a significant gap in utilising the potential of large cities in Ukrainian regions. In Ref. [57], the adverse effects of the lack of legal regulation on local self-government development are outlined. In Ref. [58], the focus is on logistical connections and the creation of economic and infrastructure clusters, as well as the degree of cooperation in production processes and services. The adoption of the law on urban agglomerations would enable harnessing the potential and capabilities of large cities to enhance the competitiveness and economic growth of the respective regions and the country as a whole.
Thus, we delved into the nature of relationships within the “city – adjacent territories” system model, examining it as a nexus of interconnected interactions [59]. A city is considered within its administrative-territorial boundaries as defined in Ref. [2] and represented as mandatory statistical information in the Environmental Passports of regions [60]. Adjacent territories are those that surround a city, potentially including or extending beyond suburban areas. The rapid degradation of territorial resources and alterations in natural cycles extend far beyond urban settlements. Areas impacted by urbanisation are continually evolving under chronic anthropogenic pressure, significantly altering natural processes. Key factors of urban-technogenic impact include the following:
Impact on Water Resources: anthropogenic changes in ecosystems in catchment areas (e.g. deforestation, drainage of marshes, eutrophication of water bodies); development, fragmentation, pollution of catchment areas; changes in land use patterns; changes in the hydrological regime due to excessive consumption, climatic factors, construction of hydraulic structures; changes in the hydro-chemical regime as a result of wastewater discharge [61].
Impact on Airspace (impact of “city breathing”): pollution from mobile and stationary sources, including emissions of greenhouse gases and ozone-depleting substances; transformation of quantitative and qualitative parameters of the atmosphere, initiation of natural disasters (hurricanes, whirlwinds, tornadoes, etc.) related to climate change [62].
Impact on land resources: changes in the hydro-geological regime; mechanical loading on the soil due to infrastructure objects (roads, pipelines) [43]); waste disposal; development of hazardous geodynamic processes (karsts, landslides, flooding, etc.), in addition to the changes in the structure of land use.
Impact on biota: biodiversity loss, loss or critical decline in population numbers, destruction of habitat, disruption of wildlife migration corridors, impacts on fish spawning by hydraulic structures.
Impact on environmental safety: consequences of man-made accidents, man-made fires, and initiation of forest fires [63]; initiation of dangerous exogenous geological processes (landslides, mudflows, karst, flooding); initiation of natural disasters due to urban climate changes.
All groups of factors have a cumulative impact on natural landscapes, which are initially formed under these effects. It should be noted that changes in the land use structure have a direct impact on water and land resources, and an indirect impact on atmospheric (through changes in the conditions of dry and wet deposition of pollution) and biological (through changes in habitat conditions) ones.
The relationship between urbanisation and changes in the ecological state of most Ukrainian cities and their adjacent areas cannot be simplified into broad generalisations. The deterioration of the quality of the components of the natural and built environment complicates multi-level natural and anthropogenic phenomena. Adverse events and processes, when interacting within landscapes of different types, create environmental situations with varying degrees of tension. The ability of natural landscape components (natural water bodies, forest and steppe areas, comprehensive green zones) to maintain their core resilience parameters under anthropogenic pressure is key to minimising natural-technological adverse events in urban areas.
Urban sprawl and the formation of urban agglomerations lead to the expansion upon suburban natural areas, change the way natural resources are utilised, and lead to the loss of their ecosystem services [64, 65]. Overall, this disrupts the stability of natural complexes, triggers, and intensifies hazardous phenomena, which, in turn, adversely affect the state of ecological risk in urban systems.
There exists a direct and back relationship between the ecological state of the urban territories and the extent of transformation and degradation of natural systems in adjacent territories, where anthropogenic pressure on suburban natural areas initiates a certain sequence of adverse events, schematically represented in Figure 1.
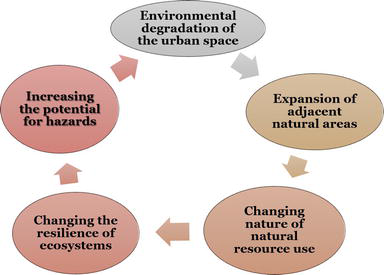
Figure 1.
The positive feedback loop in the “city-adjacent territories” system.
The diagram illustrates a cycle of unidirectional adverse phenomena and processes that disrupt the balance of the “city – adjacent areas” system through a mechanism of positive feedback:
the city determines degradation and destructive processes in the adjacent territories, increases the overall potential of hazards, and intensifies their negative consequences;
as a result, significantly altered and distorted natural processes accelerate degradation and increase the level of danger in the urban environment.
Thus, the boomerang effect from the initiation of this cycle (Figure 1) returns to the urban system. The city not only generates urban-technological impacts on the entire urbanised area but also evolves within the ecological situation and circumstances created by such impacts. Changes in the quantity and quality of resources (biological, mineral, climatic, landscape) lead to increased demand for them. This dictates the extensive development of cities, counteracting the goals of sustainable development. Therefore, urban communities should be interested in limiting urban-technological impacts on the environment and developing cities in an intensive scenario in line with the SDGs.
The analysis of the city-adjacent territories system linkages essentially provides a theoretical basis for urban ecological resilience [66], encouraging the revitalisation and change of urban areas and cities to improve living conditions, promote innovation, and reduce environmental impact, maximising economic and social co-benefits.
4. Understanding ecological urbanisation
Traditionally, urbanisation is viewed in terms of transitioning to an urban lifestyle. Regional urbanisation processes are considered through the settlement system in large, medium, small cities, and megacities. Today, urbanisation is an all-encompassing process that affects all facets of life. Demographic changes correspond to the nature of a country’s post-industrial development but do not reflect all the interconnected aspects of the urbanisation process, components of which are presented in Figure 2. It should be noted that the concepts of demographic, spatial, and socio-economic urbanisation have already been utilised in Ref. [24]. We proposed from Refs. [59, 67] a set of interdependent components of the urbanisation process (Figure 2), which collectively determine the ecological state of territories. Among them, only demographic urbanisation is quantitatively assessed through the percentage of urban population. The nature of the impact of each component has both negative and positive sides. For example, while industrial urbanisation is directly associated with negative environmental pollution, climate and landscape changes, and other destructive processes, technological urbanisation, through structural and technological modernisation of the industrial sector of the economy, mitigates the effects of industrialisation. With the modern production of complex goods (machinery, equipment, tools) and information services (patents, licenses, software products), the pressure on all environmental components is reduced compared to the waste generated by the extraction and processing industries.
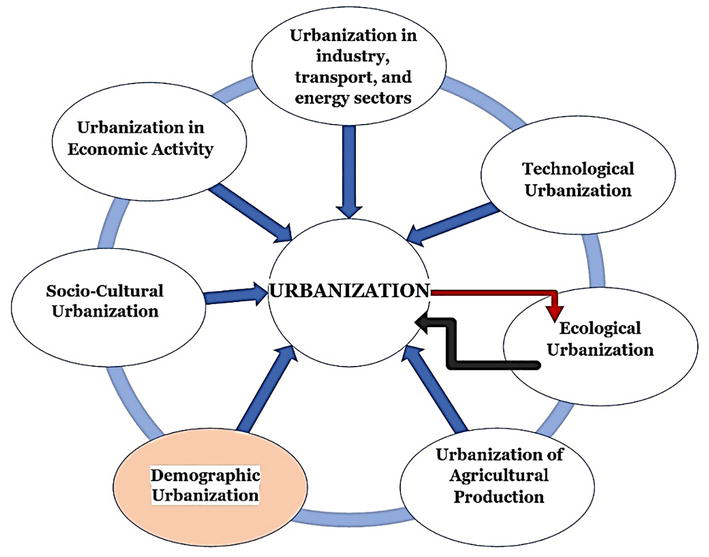
Figure 2.
Framework of urbanisation process elements.
Urban enterprises reap positive effects from urbanisation due to the concentration of labour, financial, material, and natural resources, intensive information exchange, and improved conditions for innovation and investment. Infrastructure costs are reduced due to the localisation of industrial zones and the formation of agglomerations, among other factors. Socio-cultural urbanisation accompanies and partly conditions the scientific and technological evolution predominantly of cities. The need to meet the growing demands (food, water, raw materials, etc.) of urban residents stimulates the urbanisation of agricultural production. The growth of cities requires sustainable land management, a move away from extensive forms of agricultural development, and the adoption of modern environmentally friendly production methods for all types of agricultural products. The urbanisation of economic activity lays the groundwork for stimulating innovative development in the regions of Ukraine [68], facilitating the use of modern eco-economic tools in implementing sustainable development programmes and managing the safety of the urban environment.
Under ecological urbanisation, we comprehend the totality of negative processes and phenomena, specifically the degradation and depletion of natural resources, landscape losses, changes in ecosystem productivity and biodiversity, and alterations in natural cycles. These occur not only within cities but also extend far beyond urban settlements and define the degree of transformation of natural systems under the pressure of urban-technological impacts. Ecological urbanisation may coincide with spatial urbanisation and be measured as the proportion of urbanised area relative to the total area of a region or country. Essentially, this quantitative indicator reflects the extent of artificial surface within the urban area.
Artificial surfaces can be represented by impervious surfaces due to changes in soil mechanical properties (compaction, loosening, weathering) and disruptions in gas and water exchange, or by completely sealed (isolated) surfaces made of asphalt and concrete coverings of streets and roads, roofs, buildings, industrial areas, and disturbed lands. In both cases, the artificial surface of urban space does not participate in the natural cycle. Therefore, destructive processes and adverse natural phenomena (e.g. disruptions in water runoff regime, and hydrogeological and geological hazards [68]) lack mechanisms for natural regulation and self-recovery. It is the artificial surface that is responsible for the creation of heat islands in cities and other factors of climate change [69]. As a result, the global stability of the territory is disrupted. The spread of artificial surfaces within cities and urban agglomerations is associated with transport infrastructure, construction, and changes in land use.
Within the system of urbanisation process components, it is important to note the dualism of ecological urbanisation (indicated by black and red arrows in Figure 2). On one hand, environmental elements and biological populations (including humans) are the primary recipients of the multifaceted impact of all urbanisation components (the black arrow in Figure 2 indicates this impact). It is this impact that causes degradation and disrupts the stability boundaries of the “city-environment” system. On the other hand, ecological urbanisation acts as a limiting factor in all evolutionary changes due to the limited availability of exhaustible natural resources, energy sources, and land resources. Anthropogenic changes in the quality and quantity of natural resources and the scope of their ecosystem services create natural barriers to socio-economic, scientific, and technological development of society, and slow down the tempo of urbanisation.
To preserve the “ecological health” of urban systems, establishing ecological boundaries is crucial, dictated by the imperative to conserve part of the ecosystems, the so-called “wild nature,” beyond anthropogenic impact, to maintain the global stability of territories. Thus, ecological urbanisation, through the limitation of natural and territorial resources, restricts the intensity of the entire urbanisation process (indicated by a reverse red arrow in Figure 2). Therefore, ecological urbanisation is a defining factor in the stability of the “city – adjacent areas” system and a limiting factor in the urbanisation development of territories.
5. Developing an indicator approach to identify urbanisation characteristics in Ukrainian regions
We suggest using an indicator of ecological urbanisation to evaluate the environmental health of administrative units. As previously discussed, ecological urbanisation is defined by the scale of urban space (the city and its adjacent areas under its direct and indirect influences) and depends on factors such as the proportion of urbanised territory and the density of the urban population, which affect the intensity of natural resource use and determine the nature of land use. This approach does not require a large number of indicators or specialised methods for their processing. Simultaneously, the selection of indicator parameters aligns with fundamental ecosystem laws. All data presented below are based on indicators as of the beginning of 2022 [2, 67].
The ecological urbanisation indicator (Iec.urb) was calculated as a linear combination of normalised indicators of urbanised population density (ρpop.urb) and the proportion of land occupied by urban settlements (Surb) relative to the total area of the region, as demonstrated in Ref. [67]. The indicator (Surb) is assumed under the premise that the entire city territory is conventionally artificial. In addition to the sealed surface of residential and industrial areas, even urban green spaces are mostly artificially created systems in which natural processes are modified and subordinated to anthropogenic activities (organisation of plant supervision, selection of species composition, soil cultivation, removal of leaf litter, etc.). In our view, the indicator of the proportion of land occupied by cities relative to the total area of the region reflects the overall level of urban coverage of the territory and allows, subsequently, to define the ecological boundaries of urbanisation.
The ranking of Ukrainian regions by Iec.urb indicator ranges presented in Ref. [67] allowed us to organise administrative territories of different functional purposes and varying degrees of population aggregation by the level of urban saturation. It was found that the Donetsk region significantly differs from others, characterised by the highest value of the Iec.urb indicator. Other regions are conditionally divided into four groups based on the index ranges. We also conducted a cluster analysis of the (Iec.urb)n values normalised by the standard procedure [63] using the k-means method [70] to determine the affiliation of Ukrainian regions to a single group, in which the regional characteristics of urbanisation processes are more similar compared to entities from other groups. We identified three clusters:
Indicator values (Iec.urb)n close to the median (0.37) (numbers in the interval between the first and third quartiles); 15 regions (excluding AR Crimea, for which there is no data): Cherkasy (0.315), Sumy (0.320), Zaporizhzhia (0.355), Kherson (0.358), Mykolaiv (0.365), Rivne (0.375), Chernivtsi (0.390), Odesa (0.400), Ternopil (0.405), Vinnitsa (0.425), Khmelnitsky (0.450), Ivano-Frankivsk (0.470), Volyn (0.500), Luhansk (0.500), and Kharkiv (0.505);
Indicator values (Iec.urb)n below the median (below the first quartile); 6 regions: L’viv (0.165), Zakarpattia (0.230), Chernihiv (0.240), Zhytomyr (0.265), Kirovograd (0.270), and Poltava (0.300);
Indicator values (Iec.urb)n above the median (above the third quartile); 3 regions: Dnipropetrovsk (0.540), Kyiv (0.590), and Donetsk (0.775).
This differentiation does not align with the traditional division into southern, northern, eastern, and western macro-regions but reflects the general characteristics of urbanisation processes. It should be noted that Ukraine, as the content of cluster I shows, is a medium-urbanised country with a disproportion of types of demographic settlement in medium and small cities. Low-density urban population living in urban settlements, which occupy a small portion of the total regional area, characterises cluster II. Cluster III, consisting of only three regions, is distinguished by a combination of maximum urban population density and significant volumes of urbanised territories in the regions.
The regional differentiation in the intensity of urbanisation processes has led to significant differences among regions in terms of demographic behaviour, which correlates with the index of actual urbanisation [71]. To account for the settlement systems of different regions, the indicator of real urbanisation (Ireal.urb) was applied. It was calculated as the geometric mean of four indicators: X1, the proportion of urban population in the total population of the region (the region’s level of urbanisation); X2, the proportion of urban settlements in the total number of settlements; X3, the proportion of cities with a population of more than 50,000 in the urban population; X4, the proportion of cities in the total number of urban settlements [72]. A complex index of ecological-demographic urbanisation (Iedu) was calculated based on a linear combination of real and ecological urbanisation indicators. Its values, in comparison with the normalised indicator of demographic urbanisation level (D) for the country’s regions, are presented in Figure 3. Thus, the integral indicator, the ecological-demographic urbanisation index, takes into account both demographic and ecological factors of urbanisation processes.
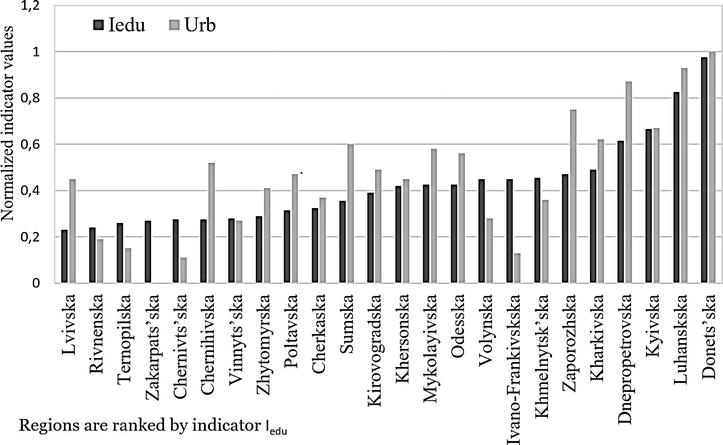
Figure 3.
The value of the ecological-demographic urbanisation index in relation to the level of demographic urbanisation in Ukrainian regions.
Indeed, the proposed indicators are based on a limited set of readily available metrics, straightforward to calculate, which can be employed to distinguish Ukrainian regions by their urban load. We will show how we used these indicators to study the state of natural environment elements and patterns of natural-technogenic threats depending on the level of ecological urbanisation in the regions.
6. Characteristics of atmospheric pollution across regions of Ukraine with diverse urbogenic loads
An ecologically safe atmospheric environment is an indispensable condition for ensuring high quality of life and socio-economic activity of people. Transformations in the quantitative and qualitative parameters of the atmosphere are inextricably linked to climate changes, as they share a common source: energy generation and carbon fuel combustion [9, 10, 22, 24, 62, 73, 74, 75]. Air pollution in densely populated urban agglomerations is not limited to local effects. Pollutants are transported over vast distances, up to thousands of kilometres, significantly contributing to the overall background atmospheric pollution. In general, the maximum negative effects of changes in the quality of the atmospheric environment are typical for the most urbanised industrial centres. According to the Pollution Index for European cities, annually reported by the online database numbeo.com [76], major regional centres in Ukraine such as Dnipro, Odesa, Kyiv, Kharkiv, and L’viv are among the 50 most polluted European cities, with Dnipro, scoring 80.98 on the Pollution Index, ranking sixth. Exceeding the World Health Organization (WHO) target values for the annual amount of fine particulate matter (PM2.5), which causes approximately 50,000 premature deaths per year, is also common in urban areas of Ukraine. As of 2020 [77], Ukraine ranks 8th in Europe (with an annual average PM2.5 concentration of 19.2 μg/m3), and Kyiv ranks 39th among the capitals of 106 countries worldwide.
The analysis of the dynamics of pollutant quantity changes from stationary and mobile sources over the period 1995–2020 [78] has shown a positive impact of the urbanisation process on the reduction of emissions from stationary sources: the pollution load per capita in the country decreased by 1.8 times. In recent years, there has been an increase in the negative trend of environmental pollution by transport, resulting in a 1.13-fold increase for pollution per capita. This situation in Ukraine aligns fully with global trends.
The analysis of the ratio of stationary and mobile source capacities in regions with varying levels of urban impact (Figure 4) revealed the following trends: firstly, an increase in total emissions from both types of sources in line with the growth of the (Iedu) index; secondly, the prevalence of stationary emissions over transport emissions in only five regions—Vinnitsa, Dnipropetrovs’k, Donetsk, Zaporizhzhia, and Ivano-Frankivsk. In Dnipropetrovsk and Donetsk regions, they account for about 60% of the total emissions from stationary sources. Transport emissions dominate in most regions across various levels of ecological-demographic urbanisation, with the most significant impact observed in highly urbanised areas such as Dnipropetrovsk, Kharkiv, and Kyiv regions. The peak in the Kyiv region reflects the capital’s impact on the sharp increase in vehicle traffic.
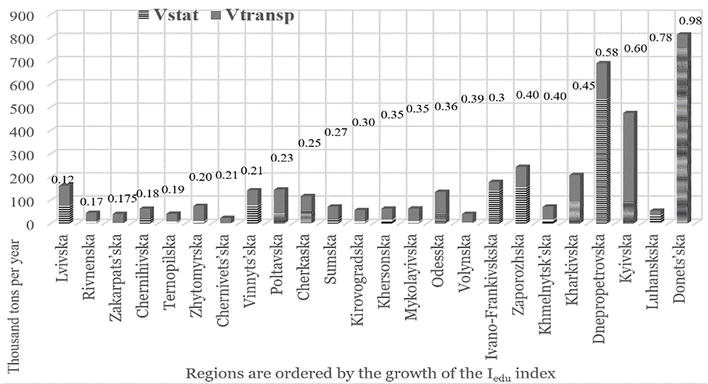
Figure 4.
Emissions from stationary and transport sources by region of Ukraine compared to the Iedu index. *Kyiv region includes data for the city of Kyiv.
Evaluating the impacts of urbanisation faces the challenge of defining their boundaries. Polluting aerosols emitted through the high smokestacks of energy and industrial plants tend to spread over vast distances, significantly affecting the global safety of the atmospheric air. We have identified the contribution of urban stationary sources to the regional level of air threat through the coefficient of urban air pollution of regions (Urbstat)n (the part of emissions from urban stationary sources in the total regional capacity) and have shown a sufficient level of correlation with the indicator of environmental urbanisation (Іec.urb)n (Figure 5).
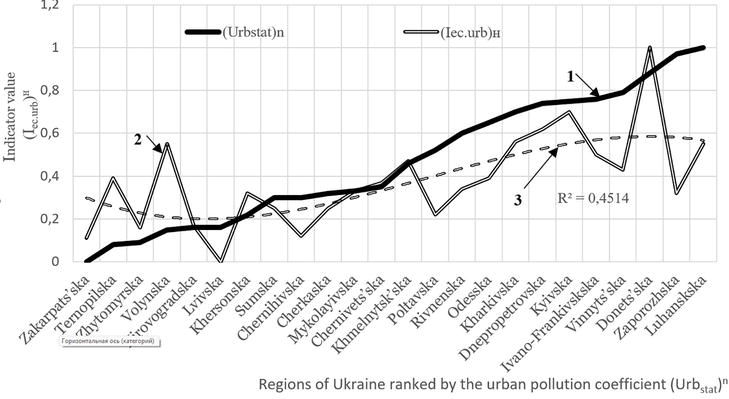
Figure 5.
Combination of indicators of air pollution by urban stationary sources and the indicator of environmental urbanisation: 1—(Urbstat)n; 2—(Iec.urb)n; 3—polynomial trend line for the (Iec.urb)n indicator.
The hazard level of the air basin of cities of regional significance was also assessed accordingly (Iedu)n [62]. Regardless of the urbanisation level, cities with a concentration of hazardous techno-sphere objects experience the highest environmental load, as demonstrated by the examples of Ladyzhyn, Cherkasy, and others. On the other hand, cities, as economic development centres, make better use of science and available technologies. In the management of large cities, cutting-edge technologies are more widely implemented, and modern air protection measures are better organised. Enterprises are typically located outside city borders, in industrial zones. Thus, the positive impacts of urbanisation can explain the low specific atmospheric pollution load per unit of area and population in cities of the Odessa, Kherson, Kyiv, and Khmelnitsky regions, which have a sufficiently high level of ecological-demographic urbanisation [62].
Our research emphasises the priority of combating transport pollution, which prevails in most regions regardless of the level of ecological-demographic urbanisation. Therefore, controlling emissions from mobile sources, urban road planning and organising traffic flows in cities and beyond are necessary measures for a sustainable urbanisation process. In Ref. [79], we also proposed protective roadside barriers of a special configuration in the form of discrete shields. Unfortunately, in Ukraine, the use of roadside shields (which are a mandatory attribute of highways in Europe and other countries) is at an early stage. The policy for ensuring a high level of environmental safety of atmospheric air must consider the features of cities and urbanised territories to enhance the effectiveness and efficiency of environmental protection measures and improve the decision-making apparatus at the regional and national levels.
7. Natural and technological safety
Throughout history, natural disasters and anthropogenic catastrophes have claimed lives, inflicted material and financial losses, and created widespread issues across various countries and continents. Until now, no scientific or technical achievements can fully protect people and their places of residence from the consequences of disasters of any genesis. In Ref. [72], the effects of urbanisation processes on the nature of emergencies and the individual risks to the population in different regions have been analysed. We have conditionally divided all regions into four groups depending on the ratio of natural (Emn)n and technological hazards (Emt)n and index (Iedu)n. We concluded that the urban impact on the territories is growing, especially in the case of southern Odesa, Kherson, and Mykolaiv regions, which are prone to negative exogenous geological and hydrological processes.
Regions with a sharply increased level of technological accidents and high values of the Iedu index (Donetsk, Luhansk, Kyiv, Dnipropetrovsk, Kharkiv, and Zaporizhzhia) are characterised by a powerful industrial and energy complex dominated by extremely dangerous heavy and mining industries and nuclear power. The economic complex of the regions was formed in the context of long-term urbanisation, which was not accompanied by innovation and technological progress, modern re-equipment of production. Outdated (or destroyed on the temporarily uncontrolled territories of Donetsk and Luhansk regions) infrastructure, industry, and energy facilities pose a real threat of large-scale industrial accidents.
Given the fact that the war will undoubtedly lead to a decrease in demographic indicators, let us consider the impact of urban pressure on the regions of the second cluster (described in paragraph 5 of this chapter) with the lowest level of urban load based on environmental safety indicators (Figure 6).
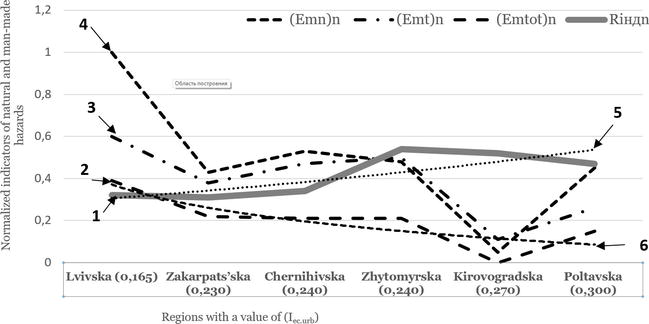
Figure 6.
The feature of natural and technological hazard indicators for the cluster of minimal urban load among the regions of Ukraine: 1—indicator of individual risk of the population (Rind)n; 2—indicator of disaster hazard of all types (Emtot)n; 3—disaster hazard of man-made genesis (Emt)n; 4—indicator of disaster hazard of natural genesis (Emn)n; 5—trend line (Rind)n; 6—trend line (Emtot)n.
Two opposing trends are shown: a decrease in the occurrence of emergencies and an increase in individual risks with the increase in the urbanisation of Ukraine's regions, assessed through the environmental urbanisation indicator. The first trend is demonstrated by the trend line (curve 6 in Figure 6) of the disaster hazard of all types (Emtot)n, which essentially serves as a summary for other types of hazards. It is important to note its regional characteristics. For instance, the L’viv region is characterised by a relatively high potential for technogenic hazards, which does not correlate with the lowest level of urbanisation in the cluster group. Changes in the placement of infrastructure objects during the war can only increase the region’s significance as a major industrial-energy centre and a national-scale transport hub. At the same time, the high level of negative exogenous geological and hydrological processes is not a direct consequence of urbanisation processes and is explained by natural-landscape factors. Overall, the combination of natural and human-induced emergencies synergistically increases the overall hazard potential. The observed trend of decreasing natural-technological emergency indicators with the gradual increase in urbogenic load of regions up to a certain level may indicate the positive consequences of urbanisation. These include a higher level of information and material-technical provision for emergency services, modernisation of technical means, and better organisation of the entire environmental safety management system. However, these positive aspects of urbanisation cannot fully compensate the population risks if the territory of region is prone to various human-induced accidents, natural disasters, and the development of adverse geological processes. Thus, the trend line (curve 5 in Figure 6) demonstrates a slow increase in individual risks, regardless of the frequency of disasters, with a gradual increase in urban load.
The definitions and correlations of hazard factors and urbanisation indicators conducted have potential for use in relation to Target 11.4: Ensure timely public alert about emergencies through innovative technologies. Differentiation of regions by the levels of individual risks for the population will be useful for determining the algorithm and stages of implementation of this target.
It should be noted that the war in Ukraine creates conditions for increasing the risks of both purely human-induced accidents due to the destruction of techno-sphere facilities and those associated with natural disasters initiated by environmental damage. Therefore, the combination of the factor of environmental urbanisation and the risks of human casualties in disasters can only increase. Therefore, when developing risk-oriented strategies to mitigate the consequences of man-induced accidents and natural disasters at both the national and local levels of management, it is advisable to use indicator assessments of urban features of similar regions that affect the formation of the environmental safety level.
8. Dangers of karst processes
Complex anthropogenic factors primarily have a destructive impact on the geological foundation of urban landscapes, triggering dangerous exogenous geological processes (EGPs) such as landslides, mudflows, karst, flooding, and others. Today, 25% of the world’s population lives in areas where karst processes are active [80, 81], which manifest in the form of karst sinkholes or ground collapses. The hazards associated with karst processes are rapidly growing and spreading to urban areas, especially if they were developed without proper planning considering the hydrogeological features of the built-up territories. Cities become centres of degradation of the bedrock of natural landscapes. The destruction of the green cover, the placement of solid and liquid waste, numerous accidents of underground utilities, losses from them of large amounts of water and heat, concentrated mechanical loads on the soil, compaction, and sealing of their surface initiate exogenous processes of the lithosphere group. Karst, flooding, landslides, abrasion, and destruction of river valley slopes cover most of the territory of Ukraine [82] and are activated over significant areas of urban development.
The territorial indicator of karst hazard (Rkarst) is defined as the proportion of the territory covered by karst rocks of various types in the total area of the region [83]. The coefficient of spatial damage to the territory (Rkarst)n calculated in this way determines the potential for the maximum possible risk of karst processes within a certain area. The analysis of regional karst formation hazard indicators (Rkarst)n in comparison with the ecological urbanisation indicator (Іec.urb)n shows that in approximately one-third of the regions (Zhytomyr, Kirovohrad, Zakarpattia, Cherkasy, Vinnytsia, Dnipropetrovsk, Kyiv), the increasing levels of karst process hazards almost coincide with the growth of the degree of ecological urbanisation. In these regions, the share of karst landscapes varies from 1.8 to 65.5%, corresponding to a change in the (Rkarst)n indicator from 0 to 0.645. The correlations between the indicators of geological hazard and urbanisation in the case of low and medium values of karst coverage of regional areas are demonstrated. It is possible to assume a higher probability of urban factors’ impact on the frequency of karst manifestations for eight regions—Dnipropetrovs’k, Kyiv, Ivano-Frankivsk, Khmelnitsky, Donetsk, Luhansk, Kharkiv, and Volyn. For this regional group, high values of the environmental urbanisation indicator (Iec.urb)n (in the range from 0.47 to 1.0) determine the risks of urban initiation of karst manifestations.
The development of karst processes has been studied in dynamics to assess the geological hazards of constantly changing urbanised areas. The consequences of latent processes occurring in the upper layers of surface rocks can be subsidence, collapse, and soil failures both within urban areas and throughout the entire territory of urban impact. For the majority of regions, the area of open karst sinkholes decreased from 19.3 to 11.281 thousand km2 between 2001 and 2020. Only five regions show the opposite trend (Figure 7). The indicator of the increase in the area of open karst (ΔSk.surf) correlates with the indicator of ecological urbanisation of these regions.
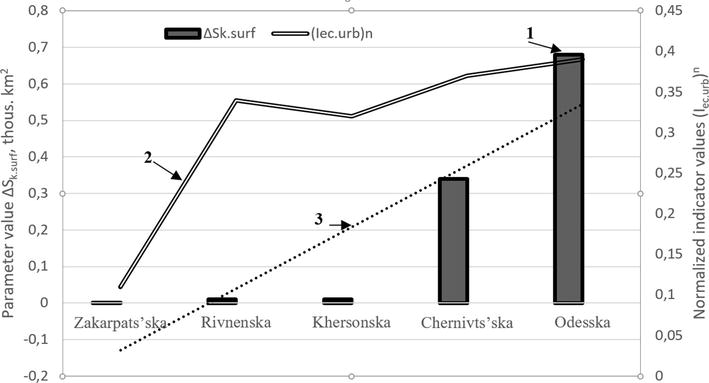
Figure 7.
Expansion of surface karst in the Ukraine regions for the period 2001–2020 in comparison with the ecological urbanisation indicator: 1—indicator (ΔSk.surf); 2—indicator (Іec.urb)n; 3—linear trend of the (Іec.urb)n.
The revealed tendency to increase the area of open karst corresponds to the growth of ecological urbanisation due to the exploitation of natural territorial resources, impoverishment of vegetation, and changes in the feature of land use. The assessment of the impact of urbanised areas on the risk of karst processes in the area of hazardous facilities (using the Rivne Nuclear Power Plant (NPP) as an example) is shown [84]. Based on the differentiation of karst threats according to their significance for the safety of the NPP, the most significant types of risks associated with changes in the hydrological regime of soils under the impact of urban areas are proposed. The ways of solving the problem of prevention and reduction of potential hazards of karst process development in the areas of NPPs location are proposed by regulating the risks of urbanised environment impact, limiting urban sprawl in vulnerable areas, and organising an effective system of integrated geo-ecological monitoring.
Urbanisation parameters are directly linked to the vulnerability of karst aquifers to various types of pollution and disruptions in underground drainage. The organisation of surface runoff, the capacity of water supply networks, the purification ability, and the technical condition of sewage facilities are crucial factors that govern the state of karst formations. The execution of engineering-geological works, construction of new techno-sphere objects, and the expansion of areas for economic activities necessitate the application of effective methods for predicting hazardous geological processes, strict regulation of the level of technological load on karst-prone areas, and establishing boundaries for changes in land use.
9. Conclusions
We have highlighted various facets of the urbanisation process (demographic, industrial or industrial-technological, ecological, agricultural, socio-economic, etc.), which affect the formation of territorial ecological safety both positively and negatively. The ecological aspect acts as a limiting factor for all evolutionary changes due to the scarcity and quality of natural resources. The concept of ecological urbanisation is based on the following key principles:
The direct and feedback connections between urban environments and the natural systems of adjacent territories develop through a mechanism of positive feedback, which tends to disrupt the balance of the geosystem. This increases the hazard potential of the urban environment and amplifies the adverse outcomes of emergencies.
The city is considered as an integral object of environmental impact. This eliminates the simplistic procedure of assessing one-way links between urbanisation and the degradation of individual environmental components, even if such impacts are summed up.
It should be emphasised that this chapter does not include a discussion of the compensatory capacity of natural systems to mitigate urbanisation impacts. Indeed, urbanised landscapes are expanding faster than any other type of land use. They are absorbing natural areas that are critical to maintaining ecological balance. SD documents link human well-being to biodiversity, ecosystem conditions, and ecosystem services. The development of green urban infrastructure, the maintenance of green belts, ecological network facilities and ecological corridors within urban agglomerations are essential for sustainable urban development. Indeed, the direction of changing the nature of the ecosystem service of urban ecosystems [71] and the development of ecosystem services of green urban areas [72] have begun to be developed. Recommendations were made to the environmental programmes of Odesa for environmentally oriented urban planning. Unfortunately, this area has been put on hold. The main reason for this is the reorientation of city budgets in times of war. Additionally, fully exploring these aspects is unfeasible without access to remote sensing data and GIS technologies. These restrictions are also related to the war.
The war in Ukraine has significantly altered both the scale of urbanised territories and demographic indicators, particularly in the south-eastern regions where active military actions have devastated dozens of cities. Demographic realities also indicate a population decrease by almost a third, especially in urban areas. However, this has not diminished the value of the indicator as a universal tool for assessing the ecological state of territories.
The proposed methodology of environmental assessments will be essential in determining the recovery strategies for different regions of the country. The integration of sustainable urban planning methods, including green infrastructure, efficient transport systems, and sustainable land use, can significantly affect the state of cities and their surrounding areas. The environmental factor should become a determining one for sustainable and safe development of regions when rebuilding destroyed and new settlements, restoring industrial and infrastructure facilities, and addressing population resettlement issues. It is promising to use the factor of ecological urbanisation to dose the environmental load on territorial resources, in environmental rules of permissible land use, and safe land use. Urban planning parameters must ensure the preservation of natural landscapes and greenery both within and around urban areas, preserve and enhance biodiversity, and provide ecosystem services to city residents.
Acknowledgments
We are grateful to Kіminchіdzhi Mariia for her contribution to the collection and processing of statistical data. We also extend our thanks to Butenko O.G., Arsiriy V.A., Surkov S.V., and Smyk S. Yu for their valuable comments.
Conflict of interest
The authors declare no conflict of interest.
References
- 1.
The World Bank: Urban Population [Internet]. Available from: https://data.worldbank.org/indicator/SP.URB.TOTL.IN.ZS . [Accessed: December 2, 2023] - 2.
State Statistics Service of Ukraine [Internet]. 2023. Available from: https://www.ukrstat.gov.ua/ . [Accessed: December 2, 2023] - 3.
United Nations Population Division. World Urbanization Prospects: 2018 Revision. [Internet]. Available from: https://www.indexmundi.com/facts/indicators/SP.URB.TOTL.IN.ZS/rankings . [Accessed: December 14, 2023] - 4.
OECD Key Environmental Indicators: OECD Environmental Directorate/ Paris, France. 2004. [Internet]. Available from: https://www.oecd.org/environment/indicators-modelling-outlooks/31558547.pdf . [Accessed: December 14, 2023] - 5.
OECD Environment Statistics. [Internet]. Available from: https://www.oecd-ilibrary.org/environment/data/oecd-environment-statistics_env-data-en . [Accessed: November 28, 2023] - 6.
European Environmental Agency. Indicators. [Internet]. Available from: https://www.eea.europa.eu/en/analysis/indicators . [Accessed: November 28, 2023] - 7.
UNECE Working Group on Environmental Monitoring and Assessment: Core Set of Environmental Indicators for Eastern Europe, the Caucasus and Central Asia. [Internet]. Available from: https://unece.org/DAM/env/europe/monitoring/Indicators/Core_indicators_for_EECCA.En.pdf . [Accessed: November 30, 2023] - 8.
Sustainable development in the European Union Overview of progress towards the SDGs in an EU context, 2022 edition, Eurostat Supports the SDG s. [Internet]. Available from: https://ec.europa.eu/eurostat/documents/4031688/14665125/KS-06-22-017-EN-N.pdf/8febd4ca-49e4-abd3-23ca-76c48eb4b4e6?t=1653033908879 . [Accessed: January 4, 2024] - 9.
Liu W, Jiao F, Ren L, Xi X, Wang J, Wang X. Coupling coordination relationship between urbanization and atmospheric environment security in Jinan City. Journal of Cleaner Production. 2018; 204 :1-11. DOI: 10.1016/j.jclepro.2018.08.244 - 10.
Liang K, Wang Z, Ji L. The effect of urbanization on environmental pollution in rapidly developing urban agglomerations. Journal of Cleaner Production. 2019; 237 :117649. DOI: 10.1016/j.jclepro.2019.117649 - 11.
Zhang Z, Xia F, Yang D, Chen Y. Discussion of an environmental depletion assessment method – A case study in Xinjiang, China. PLoS One. 2022; 17 (1):e0262092. DOI: 10.1371/journal.pone.0262092 - 12.
Yang J, Ren J, Sun D, Xi X, Xia J-C, Jin C, et al. Understanding land surface temperature impact factors based on local climate zones. Sustainable Cities and Society. 2021; 69 :102818. DOI: 10.1016/j.scs.2021.102818 - 13.
Yu D, Shi P, Liu Y, Xun B. Detecting land use-water quality relationships from the viewpoint of ecological restoration in an urban area. Ecological Engineering. 2013; 53 :205-216. DOI: 10.1016/j.ecoleng.2012.12.045 - 14.
Junguo L, Qingying L, Hong Y. Assessing water scarcity by simultaneously considering environmental flow requirements, water quantity, and water quality. Ecological Indicators. 2016; 60 :434-441. DOI: 10.1016/j.ecolind.2015.07.019 - 15.
Carey RO, Migliaccio KW, Li Y, Schaffer B, Kiker GA, Brown MT. Land use disturbance indicators and water quality variability in the Biscayne Bay watershed, Florida. Ecological Indicators. 2011; 11 (5):1093-1104. DOI: 10.1016/j.ecolind.2010.12.009 - 16.
Arfanuzzaman M, Atiq Rahman A. Sustainable water demand management in the face of rapid urbanization and ground water depletion for social–ecological resilience building. Global Ecology and Conservation. 2017; 10 :9-22. DOI: 10.1016/j.gecco.2017.01.005 - 17.
Pires A, Morato J, Peixoto H, Botero V, Zuluaga L, Figueroa A. Sustainability assessment of indicators for integrated water resources management. Science of The Total Environment. 2017; 578 :139-147. DOI: 10.1016/j.scitotenv.2016.10.217 - 18.
Burkhard B, Müller F. Drivers-pressure-state-impact-response. Encyclopedia of Ecology. 2008; 5 :967-970. DOI: 10.1016/B978-008045405-4.00129-4 - 19.
Brambila A, Flombaum P. Comparison of environmental indicator sets using a unified indicator classification framework. Ecological Indicators. 2017; 83 :96-102. DOI: 10.1016/j.ecolind.2017.07.023 - 20.
Development. Group on Environmental Performance, and Development. Group on the State of the Environment. OECD core set of indicators for environmental performance reviews. In: Enviromonographs №. 83. Organisation for Economic Co-Operation and Development. Paris: OECD; 1993 - 21.
Maurya SP, Singh PK, Ohri A, Singh R. Identification of indicators for sustainable urban water development planning. Ecological Indicators. 2020; 108 :105691. DOI: 10.1016/j.ecolind.2019.105691 - 22.
Ya L, Yi L, Zhou Y, Shi Y, Zhu X. Investigation of a coupling model of coordination between urbanization and the environment. Journal of Environmental Management. 2012; 98 :127-133. DOI: 10.1016/j.jenvman.2011.12.025 - 23.
Ozturk I, Al-Mulali U. Investigating the validity of the environmental Kuznets curve hypothesis in Cambodia. Ecological Indicators. 2015; 57 :324-330. DOI: 10.1016/j.ecolind.2015.05.018 - 24.
Wang S-J, Ma H, Zhao Y-B. Exploring the relationship between urbanization and the eco-environment—A case study of Beijing–Tianjin–Hebei region. Ecological Indicators. 2014; 45 :171-183. DOI: 10.1016/j.ecolind.2014.04.006 - 25.
Vavrova K. Environmental indicators. In: Proceedings of the Conference on Current Problems of the Corporate Sector, 2020. SHS Web of Conferences. Vol. 83. France: EDP Sciences; 2020. p. 01070. DOI: 10.1051/shsconf/20208301070 - 26.
Ma L, Xu W, Zhang W, Ma Y. Effect and mechanism of environmental regulation improving the urban land use eco-efficiency: Evidence from China. Ecological Indicators. 2024; 159 :111602. DOI: 10.1016/j.ecolind.2024.111602 - 27.
Gonzalez S, Belen M, Ortega E, Azevedo JC. Relationships between amount and configuration indicators in real-world landscapes: Novel references for the assessment of forest cover in the Iberian Peninsula. Ecological Indicators. 2024; 159 :111634. DOI: 10.1016/j.ecolind.2024.111634 - 28.
Pukowiec-Kurda K. The urban ecosystem services index as a new indicator for sustainable urban planning and human well-being in cities. Ecological Indicators. 2022; 144 :109532. DOI: 10.1016/j.ecolind.2022.109532 - 29.
Sachs JD, Kroll CH, Lafortune G, Fuller G, Woelm F, editors. The Decade of Action for the Sustainable Development Goals: Sustainable Development Report 2021. Cambridge: Cambridge University Press; 2021. 518 p. DOI: 10.1017/9781009106559 - 30.
The Law of Ukraine “On the Main Principles (Strategy) of the State Environmental Policy of Ukraine for the Period up to 2030” of 28.02.2019 No. 2697-VIII / Verkhovna Rada of Ukraine. Available from: https://zakon.rada.gov.ua/laws/show/2697-19 . [Accessed: December 22, 2023] - 31.
Sustainable Development Goals Ukraine. 2019. Monitoring Report. [Internet]. Available from: https://www.ukrstat.gov.ua/csr_prezent/2020/ukr/st_rozv/publ/SDGs13.01.2020_engl.pdf . [Accessed: December 22, 2023] - 32.
Sustainable Development Goals Ukraine. 2020. Monitoring Report. [Internet]. Available from: https://www.ukrstat.gov.ua/csr_prezent/2020/ukr/st_rozv/publ/SDGs_Ukr_2020_Monitoring_Report_eng.pdf . [Accessed: December 22, 2023] - 33.
Sustainable Development Goals Ukraine. 2021. Monitoring Report. [Internet]. Available from: https://www.ukrstat.gov.ua/csr_prezent/2020/ukr/st_rozv/publ/SDGs%20Ukraine%202021%20Monitoring%20Report%20engl.pdf . [Accessed: December 22, 2023] - 34.
Redko K, Miroshnychenko V. Research on sustainable development in Ukraine: Assessment of goal achievement. Entrepreneurship and Innovation. 2022; 22 :5-13. DOI: 10.37320/2415-3583/22.1. [Accessed: December 23, 2023] - 35.
Sergienko LV. Assessment of sustainable development indicators of urbanization areas and cities of Ukraine. Public Management and Administration. 2022; 28 :207-214. DOI: 10.32782/pma2663-5240-2022.28.41. [Accessed: December 23, 2023] - 36.
Klymenko MO, Pryshchepa AM, Brezhytska OA. Assessment of the City Territories' Condition Based on Sustainable Development Indicators: Monograph. Rivne: NUWGP; 2018. 221 с - 37.
Kyryn RS. Legal tools for implementing strategic directions for the development of the City's environmental security system: International and European levels. Economics and Law. 2022; 2 :39-55. DOI: 10.15407/econlaw.2022.02.039 - 38.
Stolberg FV, Kovalenko YL. Improvement of the environmental monitoring system and indicators of the environmental dimension within the framework of the sustainable development strategy in Ukraine. Municipal economy of cities. 2016; 132 :88-92 - 39.
Grechanyk NY. Ecological dimension of sustainable development. A marketing approach. Sustainable development of the economy. 2014; 1 (23):94-101 - 40.
Zgurovskyi YV. Ukraine in the Indicators of Sustainable Development. K: NTU “KPI”; 2014. 172 с - 41.
Lelechenko AP. Ensuring environmental safety of a large city in the context of sustainable development. Investments: practice and experience. 2022; 5—6 :38-42. DOI: 10.32702/2306-6814.2022.5—6.38 - 42.
Skok SV, Stratichuk NV. Scientific and methodological aspects of assessing the sustainable development of urban ecosystems. Ecological sciences. 2020; 1 (28):367-372. DOI: 10.32846/2306-9716/2020.eco.1-28.58 - 43.
Ivaniuta SP. On the integrated assessment of environmental safety of the regions of Ukraine. Ecological safety and nature management. 2013; 13 :34-44. [Internet]. Available from:http://nbuv.gov.ua/UJRN/ebpk_2013_13_6 . [Accessed: December 24, 2023] - 44.
Varlamov EM, Tolstykh YO. Analysis of the formation and use of ecological and economic indicators and indicators for assessing sustainable development of the region. Information processing systems. 2011; 3 (93):165-168 - 45.
Tyutyunyk VV, Ivanets HV, Horylyshev SA. Methodology for assessing the level of technogenic, natural and social hazard of administrative and territorial units of Ukraine. Collection of Scientific Works of the National Academy of the National Guard of Ukraine. 2016; 1 (27):29-37 - 46.
Kolesnik VY, Borysovs'ka OO, Pavlychenko AV, Shirin AL. Determination of the trends and regularities of occurrence of emergency situations of technogenic and natural character in Ukraine. Науковий вісник НГУ. 2017; 6 :124-131 - 47.
Ivanets G, Tolkunov I. Complex model for predicting losses due to emergencies in the state. Control, navigation and communication systems. Collection of scientific papers. 2018; 6 (52):68-73. DOI: 10.26906/SUNZ.2018.6.068 - 48.
Vasutynska KA, Barbashev SV. The analysis of the principles and methods evaluation of environmental safety levels in regional context. Proceedings of Odessa Polytechnic University. 2017; 3 (53):114-121 - 49.
Geographical Encyclopaedia of Ukraine, Volume 3 (P to Z). Kyiv: M.P. Bazhan Ukrainian Encyclopaedia - 50.
Voloshyna YY. Theoretical Foundations of the Concept of Suburban Area and its Main Interrelations with the City. Vol. 10. Available from: http://www.economy.nayka.com.ua/pdf/10_2015/45.pdf . Effective economy; 2015. [Accessed: December 24, 2023] - 51.
Loibl W, Etminan G, Gebetsroither-Geringer E, Neumann HM, Sanchez-Guzman S. Characteristics of urban agglomerations in different continents: History, patterns, dynamics, drivers and trends [Internet]. In: Urban Agglomeration. InTech; 2018. DOI: 10.5772/intechopen.73524 - 52.
On approval of the State Strategy for Regional Development for 2021-2027: Resolution of the Cabinet of Ministers of Ukraine of 05 August. 2020 р. 695. Available from: https://www.kmu.gov.ua/npas/pro-zatverdzhennyaderzhavnoyi-strategiyi-regionalnogo-rozvitku-na-20212027-t50820 . [Accessed: December 24, 2023] - 53.
OECD. Redefining “Urban”: A New Way to Measure Metropolitan Areas. Paris: OECD Publishing; 2012. DOI: 10.1787/9789264174108-en - 54.
Draft law from 17.07.2017 №6743. Available from: http://w1.c1.rada.gov.ua/pls/zweb2/webproc4_1?pf3511=62318 . [Accessed: December 24, 2023] - 55.
Draft law from 19.12.2019 № 2637. Available from: http://w1.c1.rada.gov.ua/pls/zweb2/webproc4_1?pf3511=67710 . [Accessed: December 24, 2023] - 56.
Council of Europe Office in Ukraine. Available from: https://www.coe.int/en/web/kyiv/-/metropolitan-governance-in-ukraine - 57.
Steshenko TV. Urban agglomerations as a form of cooperation of territorial communities legal scientific. Electronic Journal. 2023; 3 :114-117. DOI: 10.32782/2524-0374/2023-3/25 - 58.
Stepanenko AV, Omelchenko AA. Urban agglomerations as a form of the modern world urbanisation process. State and Regions. Series Economics and Entrepreneurship. 2019; 3 (108):184-192 - 59.
Vasutynska KA, Barbashev SV, Butenko OG, Surkov SV. Determination of the urbans indicator as a complex index of the environmental safety of city course territory system. In: Collection of Scientific Papers of the XIII International Scientific and Technical Conference “Problems of Environmental Safety”. Ukraine, Kremenchuk: Kremenchuk National University; 2-4 October 2019. pp. 212-215 - 60.
Ministry of Environmental Protection and Natural Resources of Ukraine. Environmental Passports of the Regions [Internet]. Available from: https://mepr.gov.ua/diyalnist/napryamky/ekologichnyj-monitoryng/ekologichni-pasporty/ . [Accessed: January 13, 2024] - 61.
Vasiutynska K, Barbashev S, Kiminchydzhy M. The risk of a water scarcity in the Ukraine regions in urbanization terms. Ecological Science. 2020; 4 (31):42-48. DOI: 10.32846/2306-9716/2020.eco.4-31.6 - 62.
Vasiutynska K. Assessment of urbogenic load on territory and population of regionally important Ukraine cities by emissions from stationary sources of air pollution. Ecological Science. 2021; 4 (37):102-108. DOI: 10.32846/2306-9716/2021.eco.4-37.15 - 63.
Vasutynska K, Barbashev S. Analysis of dynamics of man-made fires in conditions of urbanization in Ukraine. Technology Audit and Production Reserves. 2018; 4 (3(42)):16-23. DOI: 10.15587/2312-8372.2018.141376 - 64.
Vasutynska K. Assignment of the new type of ecological services for providing human safety under conditions of urban environment. EUREKA: Life Sciences. 2018; 2 :9-18. DOI: 10.21303/2504-5695.2018.00598 - 65.
Vasiutynska K. Assessment of the ecosystem service indicators of urban green zones in relation with the urbogenic load of Ukraine regions. Ecological Science. 2021; 1 (34):36-43. DOI: 10.32846/2306-9716/2021.eco.7-34.7 - 66.
European Environment Agency. EEA's Conceptual Framework for Urban Sustainability. Modified 14 Apr 2023. Available from: https://www.eea.europa.eu/en/topics/in-depth/urban-sustainability . [Accessed: December 27, 2023] - 67.
Vasiutynska K, Barbashev S, Kiminchydzhy M. Evaluation of the environmental urbanization’s complex indicator of the Ukraine regions. Ecological Science. 2020; 3 (30):7-14. DOI: 10.32846/2306-9716/2020.eco.3-30.1 - 68.
Komarnitskaya GO, Shipulina YS, Ilyashenko NS. Influence of urbanisation on the innovative development of the regions of Ukraine. Marketing and management of innovations. 2017; 3 :336-345. Available from:http://mmi.fem.sumdu.edu.ua/ . [Accessed: January 10, 2024] - 69.
Shevchenko O, Vlasiuk O, Stavchuk I, Vakoliuk M, Ilyash O. Assessment of Vulnerability to Climate Change. Ukraine: The Eastern Partnership Climate Forum (EPСF) and the Working Group of Civil Society Organisations on Climate Change (WG CSO CC); 2014. Available from: https://necu.org.ua/wp-content/uploads/ukraine_cc_vulnerability.pdf . [Accessed: January 10, 2024] - 70.
Jupyter Notebook [Internet]. Available from: https://jupyter.org/ - 71.
Gavryliuk OK. Analysis of approaches to assessing the level of urbanisation: The case of the northeastern macro-region of Ukraine scientific bulletin of Kherson state university. Series Geographical Sciences. 2018; 8 :21-31 - 72.
Vasiutynska K., Barbashev S. Indicator assessment of the impact of urbanization processes on the state of natural and man-caused safety in the Ukraine regions. In: Sustainable Development: Environmental Protection. Energy Saving. Balanced Nature Management". Lviv: ZUKC LLC; 2020. р. 232-255. DOI: 10.23939/book.ecocongress.2020 - 73.
WHO’s First Global Conference on Air Pollution and Health Improving air quality, Combatting Climate Change – Saving Lives. Available from: https://www.who.int/airpollution/events/conference/WHO_Conference_on_Air_Pollution_and_Health-Concept_Note-final.pdf . [Accessed: December 27, 2023] - 74.
Kinney PL. Interactions of climate change, air pollution, and human health. Current Environmental Health Reports. 2018; 5 :179-186. DOI: 10.1007/s40572-018-0188-x/ - 75.
Baklanov A, Molina LT, Gauss M. Megacities, air quality and climate. Atmospheric Environment. 2016; 126 :235-249. DOI: 10.1016/j.atmosenv.2015.11.059 - 76.
Numbeo.com. Europe: Current Pollution Index de City. Available from: https://www.numbeo.com/pollution/region_rankings_current.jsp?region=150 . [Accessed: January 10, 2024] - 77.
World Air Quality Report 2020: Region and City PM2.5 Ranking. Available from: https://www.iqair.com/world-air-quality-report (дата звернення 4.08.2021) - 78.
Vasiutynska K, Barbashev S. Impact assessment of the urbanization factors on the atmosphere pollution in the Ukrainian regions. Bulletin of Kremenchuk Mykhailo Ostrohradskyi National University. 2021; 4 (129):83-90. DOI: 10.30929/1995-0519.2021.4.83-89 - 79.
Arsiriy VA, Vassyutinskaya EA, Smyk SY, V.A. Chumachenko optimization of air flow while using roadside protective Shildings in the urban highway system. Ecology and industry of Russia. 2022; 2 (26):26-31. DOI: 10.18412/1816-0395-2022-2-26-31 - 80.
Ferreira CSS, Walsh RPD, Ferreira AJD. Degradation in urban areas. Current Opinion in Environmental Science & Health. 2018; 5 :19-25. DOI: 10.1016/j.coesh.2018.04.001 - 81.
Guttierrez F, Parise M, De Waele J, Jourde H. A review on natural and human-induced geohazards and impacts in karst. Earth-science Reviews. 2014; 138 :61-88. DOI: 10.1016/j.earscirev.2014.08.002 - 82.
DNVP “Geoinform Ukrainy”: Information Yearbook on the Activation of Hazardous Exogenous Geological Processes in the Territory of Ukraine Based on Monitoring Data EGP. Available from: https://geoinf.kiev.ua/publikatsiyi/shchorichnyky/shchorichnyk-egp/ - 83.
Vasiutynska K, Barbashev S. The impact assessment of the urbanization factors on the hazard of the expansion of karst rocks in the Ukraine regions. Geochemistry of Technogenesis. 2021; 5 :33-40. DOI: 10.15407/geotech2021.33.034 - 84.
Vasiutynska K, Barbashev S, Smyk S. Іmpact of urban land on the risk of karst processes in the NPP location area (on the example of Rivne NPP). Problems of Atomic Science and Technology. 2023; 3 (145):120-126. DOI: 10.46813/2023-145-120