Open Access is an initiative that aims to make scientific research freely available to all. To date our community has made over 100 million downloads. It’s based on principles of collaboration, unobstructed discovery, and, most importantly, scientific progression. As PhD students, we found it difficult to access the research we needed, so we decided to create a new Open Access publisher that levels the playing field for scientists across the world. How? By making research easy to access, and puts the academic needs of the researchers before the business interests of publishers.
We are a community of more than 103,000 authors and editors from 3,291 institutions spanning 160 countries, including Nobel Prize winners and some of the world’s most-cited researchers. Publishing on IntechOpen allows authors to earn citations and find new collaborators, meaning more people see your work not only from your own field of study, but from other related fields too.
The protection of fish habitat near water diversion or hydrotechnical facilities is of particular interest for researchers working in various fields. The chapter is focused on an experimental study of a fish behavioral barrier consisting of a bubble curtain operating along a river water intake scale model. It approaches elements of fish hydrodynamics, river water intakes, as well as physical and non-physical barriers for fish diversion from hydrotechnical facilities. The design, development, and testing of the fish behavioral barrier as well as the results of the experimental analysis are discussed. The proposed experimental setup was based on a barrier placed in the proximity of a river water intake scale model fitted and tested in a closed-circuit hydraulic stand. The intake chamber is provided with perforated orifices which communicate through an inlet with a lower tank for discharging the water into another tank located beneath. A certain water velocity within the hydraulic stand was set to assess the tandem operation of the bubble curtain and water intake. A sharp velocity gradient was found in most cases, indicating local velocity changes and creating the premises for impacting the fish behavior. Conclusions and future research development are also envisaged in the chapter.
Electrical Engineering ICPE-CA, National Institute for Research and Development, Bucharest, Romania
Rares-Andrei Chihaia
Electrical Engineering ICPE-CA, National Institute for Research and Development, Bucharest, Romania
Lucia-Andreea El-Leathey
Electrical Engineering ICPE-CA, National Institute for Research and Development, Bucharest, Romania
Andreea Voina
Electrical Engineering ICPE-CA, National Institute for Research and Development, Bucharest, Romania
*Address all correspondence to: gabriela.circiumaru@icpe-ca.ro
1. Introduction
As human activity development has a significant impact on biodiversity, there is an increasing need of environmental protection solutions and new legislative measures. According to World Wide Fund for Nature [1], due to the accelerated decline of fish populations and aquatic fauna, new and important measures have to be undertaken in order to reduce the anthropogenic effects caused by hydrological changes [2] as well as the environmental degradation. In this regard, national and international legislation in the field of aquatic habitat protection has been continuously updated, taking into account more and more of its requirements and providing rules for the design and elaboration of sustainable integrated watercourse management regulations. These rules [3] provide the inclusion of alternatives for the fish protection in the passage, diversion, and catchment constructions. The fish protection involves not only their transit or removal from the construction but also the prevention of their injury or death as a result of the facility components’ operation. The hydrotechnical constructions interrupt the rivers longitudinal and lateral connectivity, making it almost impossible for fish to migrate or to have access to primary resources that ensure their welfare.
Therefore, in order to improve or restore the rivers connectivity, proper fishways must be designed and deployed, as components of complex hydraulic infrastructures, as reported by Bunt et al. [4]. In addition, to ensure proper living conditions for fish, the water of the streams should have certain dissolved oxygen (DO) concentrations. The oxygen is present in surface water bodies due to the free surface aeration, achieved as a result of the turbulence. The DO is permanently influenced by a series of processes like diffusion, photosynthesis, and decomposition. The aquatic fauna as well as the decaying organic matter consume oxygen. Also, its concentration varies with water temperature, salinity, pressure, and season. Consequently, all these factors lead to a DO variation from 1 to 20 mg/L. Thus, due to its importance to the fish welfare, it should be monitored in freshwaters such as lakes and rivers.
According to European and national legislation [3, 5], the design of an ecological water intake must take into account the following fish habitat characteristics: the migratory species’ presence on medium and long distances on the river sector of interest, the fish migration duration, the migration period, the species’ swimming abilities, and their behavior to various external stimuli. Over time, both physical (structural/constructive) and nonphysical (behavioral guidance systems based on the natural fish attraction and repelling behavior) barriers have been developed and used. Some traditional physical systems (such as exclusion screens and grates, with or without screens) may be ineffective for certain smaller species, for juvenile specimens, or for species with special swimming performance. Hence, the need to design and develop appropriate systems for fish guidance in the proximity of river water intakes by also considering the local species characteristics is outlined. The fish guidance systems have the role either to discourage the migration of some species or to direct the fish away from certain hydropower facilities or river water intakes. Therefore, the design criteria of the protection systems have to consider their size, biomechanics, and age, as well as the understanding of the needs, psychology, and behavior of each species [6].
In order to improve the efficiency of fishways, fish ladders, or fish guidance systems, several research has been undertaken. Among the literature studies that address this topic is the study conducted by Bunt et al. [4], which analyzes and compares the results of 19 studies on different types of fish passages. The analysis included 26 species of anadromous and potamodromous fishes, and the results showed that the passages efficiency depends mainly on the fish biological characteristics and less on the type of fish ladder, slope, and so forth. Moreover, in order to increase the fishway efficiency, the need for rigorous studies related to each fish species and for different types of fish passages was emphasized.
Also, to improve the means of fish attraction or diversion to river infrastructure, Kerr and Kemp [7] performed laboratory studies on whether the hydraulic noise generated by water turbulence can mask certain stimuli such as a velocity gradient detecting. The fish response analysis showed mixed results; still, in some cases, it was concluded that the detection is lower when the turbulence is high. Some studies analyzed the importance and influence of water body hydrodynamics on fish behavior and their swimming efficiency. By numerical modeling and on-site data collection (bathymetry, acoustic tag fish location, measured data from an acoustic Doppler current profiler, ADCP), Silva et al. [8] studied the fish movement and the hydrodynamics effect in the proximity of a hydropower plant turbines. Hockley et al. [9] analyzed the modification of fish behavior with the water flow conditions (water velocity, turbulence), in correlation with their size and sex. For the analyzed species (guppies - Poecilia reticulata), swimming behavior and different preferences were identified in a heterogeneous flow from a free surface channel, by using boulders to change the flow conditions. Thus, it was detected that larger size fish prefer areas with high velocity and low turbulence, and those of smaller size spend more time in areas characterized by low velocity and high turbulence degree (behind the boulders). According to Mogdans [10], fish can detect velocity and pressure gradients by using specialized organs that can help in their orientation inside the water, in order to feed or escape from predators. The neurological response that these organs give to fish is used in guiding them away from various dangers or in attracting fish on particular routes.
The chapter aims to present an insight regarding several aspects that define a fish guidance system development and operation. Therefore, the chapter is structured in 6 sections, each of them approaching one of the key elements that contribute to the fish behavioral barriers characterization. The first section provides a broader context of the subject addressed by the research and underlines the purpose of the study. The second section approaches some aspects related to the study of water intakes with behavioral barriers. Thus, the physical and nonphysical fish guidance systems, fish hydrodynamics, as well as the main requirements related to the design of ecological river water intakes are discussed. For the experimental study of the behavioral barriers, a bubble curtain operating along with a river water intake scale model was designed, developed, and integrated in an experimental setup. The bubble curtains combine two stimuli (velocity and sound) to deter or guide fish. Hence, sound waves associated to the bubbles propagation and splitting as well as local velocity modification are generated by the curtain in the surrounding water. In addition, the bubbles create a visual barrier for the aquatic fauna. Besides these aspects approached in the third section, the next one presents the developed experimental setup and the methodology applied for the measurement of the velocities induced in the water by the bubbles at different airflow rates. The investigation of the velocities is necessary for evaluating the bubble curtain potential in guiding or deterring fish. In order to assess the water aeration associated to the bubble curtain generation, the experimental setup was provided with the necessary equipment for the dissolved oxygen measurement. The following section summarizes the results and their analysis, as well as the main findings of the study. Since river water intakes can be placed also in remote areas, with no connection to the power grid, the fifth section approaches the analysis of power autonomy solutions for the behavioral barrier based on bubble curtains.
2. General aspects regarding the study of water intakes with behavioral barriers
In order to protect the fish population, various solutions of fish guidance systems have been developed. Thus, several types of physical and nonphysical barriers have been proposed and studied, as reported by Turnpenny [11]. The physical barriers represent direct methods for fish exclusion, while nonphysical barriers stand as indirect solutions, designed to deter fish outside the proximity of water intakes area. The physical barriers consist of specially designed screens or sieves, which can be either fixed or mobile. Bubble curtains, pressure waves, strobe light, sound, electricity, chemical stimuli, magnetic, and velocity fields are nonphysical means of influencing the natural behavior of fish.
Given the fact that the chapter deals with the development and testing of a bubble curtain, the information provided below mainly refers to various research on behavioral barriers.
2.1 Assessment and analysis of behavioral barriers
Behavioral fish guidance barriers represent alternative solutions in comparison to conventional mechanical ones. The main advantages of behavioral systems consist in the fact that these are easy to use, safe, and also need just a low-cost maintenance. They can be applied in locations where grills are difficult to install, being at the same time eco-friendly, not impacting the aquatic fauna by injuring or killing fish. However, behavioral barriers have an important disadvantage considering that they do not create an absolute exclusion barrier and that the exclusion efficiency varies with the species, fish and stage development, environmental conditions (flow and variability), water quality, or lighting. They are also not generally accepted as fish exclusion methods by agencies/fisheries and so on.
In the following paragraphs, the analysis of behavioral barriers is presented [12].
Electrical barriers consist of a series of metal anodes and cathodes placed in the water body. Thus, an electric field is created in the barrier proximity, causing fish to avoid the area [13]. The main limitations of electric barriers are represented by deactivation in the event of power outages and low efficiency for small fish, which are not affected by electric fields.
It is to be mentioned that when using strobe lights barriers, different light levels influence fish behavior. Thus, fish orientation and other survival behavior in the aquatic environment can be affected. The efficiency of these deterrent systems is influenced by the life history of the target species, the lights brightness and design, the turbidity, and the ambient light level [14, 15].
Acoustic fish guidance barriers are suitable when in situ conditions do not allow the use of visual stimuli, being based on sound and pressure waves, which can be detected by the inner ear and fish lateral line system [16]. Fish have been broadly classified [17] as either “hearing generalists” or “hearing specialists”. While the generalist fish detect sounds with a frequency below 1kHz, specialists can detect frequencies up to several kHz. The carp lateral lines [18] are similar to most of the Romania native species, for example, trout. The anatomical characteristics of the carp (Weberian ossicles) allow the swim bladder to act as an acoustic pressure transducer in addition to the inner ear, thereby increasing sensitivity to environmental sound levels. The best sound detection of the carp corresponds to a frequency in the range of 100–500 Hz and 60–90 dB sound pressure level. One of the main disadvantages of acoustic barriers is that low-frequency sound waves propagate better in deep water and on softer substrates. Thus, they have limited efficiency in the case of shallow water bodies. Usually, acoustic systems are used to repel fish from hydropower facilities area. For example, high-frequency sounds in the range of 122–128 kHz demonstrated an efficiency of 87% in repelling a species of herring (Alosa pseudoharengus) from the proximity of a water intake placed in Lake Ontario [19].
Velocity barriers are based on a local velocity increase above the target species’ swimming speed. This is usually achieved by water flow limitation through a channel, gutter, or culvert, thereby increasing the velocity. When the fish movement in running waters is achieved with difficulty (e.g., upstream, against a current), the local velocity increase can represent a barrier [20]. An experimental barrier used on a Great Lakes tributary that functioned as a spawning ground for invasive sea barbells showed 33% efficiency [21].
Chemical barriers are based on the use of toxic substances in order to create a hypoxia/hypercapnia effect. They necessitate carrying out laboratory experiments in order to establish the tolerance thresholds for each species [22]. Dissolved gas barriers are quasi-efficient as long as a certain concentration is obtained (e.g., approximately 1.5 mg/L DO [12, 23]). Either purified nitrogen or carbon dioxide was injected into the water to determine the feasibility of a gas bubble curtain [24]. Another example of chemical barriers consists in pheromones use, as they are known for their potential on impacting same species individuals [25]. Thus, pheromones that are directly introduced in the water column can deter or attract fish from a certain area. Additional research on the pheromones efficiency and use against invasive species is needed before they can be considered a permanent nonphysical barrier. In any case, alarm pheromones have a more significant potential as a barrier during temporary shutdown of permanent barrier systems. Many widely applicable pesticides and biocides as well as other toxins specific to various species that can be used as deterrents against aquatic organisms are also available [26]. The systems based on fish toxins can generally qualify as nonphysical barriers if their application is limited to a relatively reduced area, necessary for fish passage. In order to be considered a barrier to fish movement, chemical substances should generally be nonpersistent.
Magnetic barriers are based on fish electroreceptive organs (present in the case of some fish—like sturgeons, Scaphirhynchus platorynchus, [27]) that can identify the water electromagnetic fields. Thus, fish can be deterred by the use of magnetic fields in specific cases like diminishing their accidental entrapment in commercial fishing activities.
Bubble curtain barriers generate distinct acoustical and hydrodynamical fields inside the water bodies. By their appropriate use, they can be applied in order to guide juvenile fish. The bubble curtain is generated by air diffusers placed along the water bottom, perpendicular to the channel/river. A continuous “screen” of bubbles in the water column provides an unnatural visual obstacle that fish should avoid. Bubble curtains are limited due to the fact that they do not emit own light and cannot be easily observed from a distance. Light penetration, especially due to turbidity, is a major obstacle to their efficiency. Compared to other alternative guidance technologies, the bubble curtain barriers represent a more economically efficient solution that does not impact the river morphology.
A summary of the barrier types and characteristics is provided in Table 1.
Barrier type
Implementation conditions
Description
Advantages
Disadvantages
Electric
Site with suitable power supply; suitable water conductivity
Electric current produced by electrodes located on the channel perimeter
It has proven highly effective against upstream migrating fish
Expensive equipment and maintenance; risk to human and animal health; it is not specific to a species
Visual-strobe lights
Low water turbidity
Strobe light with set water flashing frequency
Relatively small influence on water flow; adaptable to flow; in some species, very effective in combination with bubble curtains
It depends very much on the natural light level; cloudy water reduces its efficiency, and this is not proven in all species
Acoustics
Site with suitable acoustic characteristics
Underwater speaker with specified signal
Flexible to different flow conditions; species specific potential; wide range of sounds
Variable efficiency; the frequencies must be selected according to species; expensive equipment that can clog
Bubble curtains
Low water turbidity, relatively shallow water
Compressed air emitted as bubbles through diffusers
Flexible in different flow conditions; multiple physical stimuli; relatively simple construction; reduced cost. The efficiency increases in combination with other types of barriers
The bubbles can be “washed” at high flow rates; it cannot work in all conditions
Water velocity
Target species (a weak swimmer); narrow channel, adequate water flow
Based on local change in water flow velocity
Selectively excludes disturbing species
Major channel change; few sites meet the criteria
Chemical-Hypoxia and hypercapnia
Relatively shallow water, space needed for bulk gas storage
Based on chemicals that decrease or increase the water oxygen content
It is possible to exclude all fish
Large capital investments and research period
Chemical-Chlorine
Very limited implementation area
Based on the chlorine entry in water
May selectively exclude all fish
Dangerous to almost all aquatic wildlife; negative public perception
Pheromones
Small areas and/or short-term applications
Based on the entry of pheromones in water
May selectively exclude certain fish
Time and effort to purchase pheromones in bulk quantity
Electromagnetism
Narrow areas, narrow spots
Based on the use of electromagnetism
Cost-effective, low environmental impact
Might not work on all teleost fish
Table 1.
Types of behavioral barriers and their characteristics [12].
Bubble barriers for fish guidance have been approached in several laboratory and field studies. Most of them focus on a wide range of species: Asian carp [28], Atlantic salmon, European flounder, mackerel, and herring [29]. The use of a bubble curtain along with a sound source was studied in [28, 30]. The bubble curtain was generated by injecting airflows with 0.1–1 L/s·m rates through a perforated polyvinyl chloride (PVC) pipe. This combined bubble and sound system is developed by Fish Guidance Systems Ltd. in UK. The experimental results shown in [28] indicate a decrease in Asian carp migration by 95%, while in [30], a smolt-guiding efficiency (young catfish (Silurus glanis)) of 20–40% per day is reported, respectively larger than 70% during nighttime. These studies did not consider the bubble curtain as the main guidance solution and therefore did not analyze in detail the generated physical fields. In [31], the efficiency of a bubble curtain and of an electric barrier, respectively, was studied separately. A reduced attraction of the eurasion ruffe (Gymnocephalus cernuus) was observed instead of its repellence when a bubble diffuser with orifices between 0.4 and 1 mm, spaced equidistantly at 6.25 or 12.5 mm, was used. Following the assessment of a bubble curtain in Great Lakes USA, according to [32], it is reported that it is efficient only when used with other guidance systems such as sound or light. One other study that was conducted at a hydroelectric plant site in Michigan, USA [33], demonstrated that choosing a mixed method (by combining bubble curtains with strobe lights) can increase the fish exclusion rate and thus the behavioral barrier efficiency. Therefore, other associations between exclusion or guidance systems based on fish behavior are expected to improve their overall efficiency.
Like other types of behavioral barriers, bubble curtains are most effective when used as a component of an integrated deterrent system. For this purpose, local conditions such as turbidity or river depth must be taken into account. One major disadvantage of bubble curtains regards their ineffectiveness to maintain equal air pressure at different water depths. As mentioned before, studies indicate higher deterrence rates when bubble barriers are associated with an additional source of illumination such as strobe lights [29] or sound barriers [30]. According to [34], an experimental barrier consisting of a bubble curtain and acoustic deterrents is reported to be 95% effective in limiting Asian carp movement.
Turnpenny et al. [35] and Jones et al. [36] also demonstrated that combined behavioral barriers are more efficient than independent ones. Thus, the use of the stroboscopic light or sound systems along with bubble curtains can enhance the effect on fish as well as the barrier efficiency. Frizell and Arndt [37] reported that fish behavior is influenced by ambient light.
Since the bubble curtain can operate as a behavioral barrier to some fish movement, its associated velocity field should be determined and analyzed in order to assess its potential effectiveness for some particular fish species or for particular fish size. To create a velocity barrier, the flow field should be modified as to obtain water velocities superior to the envisaged species swimming capacity [24].
In the design and construction of fish guidance systems, whether attracting or deterring fish, consideration has to be given both to the water body characteristics (flow, depth, seasonal changes, etc.) and to the fish species that populate that water and their swimming characteristics (both anaerobic and aerobic swimming capabilities).
As shown in the following paragraphs, many studies analyze the fish swimming ability and their changing behavior when they encounter barriers (physical or nonphysical). Velocity barriers can be used to attract or deter fish from hydrotechnical facilities in order to avoid their catchment. When the local velocities created by the barriers’ presence on rivers are very high, they can negatively influence the fish movement, affecting the species continuity along the river. Regardless of the species, according to the study conducted by Castro-Santos and Haro [38], the performance of a fish passage “is the product of locomotor behavior generally, including guidance, attraction, and ascent or descent through the fishway” and is not only given by the swimming capacity. Also, the motivation of the fish is important, and the necessity to integrate the “knowledge on the interaction between physical environment, physiology and behavior” is highlighted.
In Sanz-Ronda et al. [39], the efficiency of a velocity barrier consisting of a Flat-V Gauging Weir, characterized by the velocity field variation along the barrier for the Iberian barbel (Luciobarbus bocagei), is analyzed. Given the need to ensure flow continuity and to control the access or removal of fish to and from various hydrotechnical constructions, Kapitze [40] studied barriers and fishway types and characteristics for road crossings. Both the hydraulic characteristics associated to different barriers types (total, partial, or temporal barriers) and the fish swimming ability and speed have been analyzed. Ensuring the fish population continuity has also been intensively studied. Sanchez-Gonzalez et al. [41] analyzed the fish passage through velocity barriers, in particular the northern straight-mouth nase (Pseudochondrostoma duriense), which populates the Portugal and Spain rivers. Experiments conducted in a free surface channel showed that swimming capacity is mainly influenced by the fish size, the larger individuals swimming better; at high velocity, the fish shape has a significant influence. Regarding flow velocity preference, Liang et al. [42] analyzed Schizothorax oconnori Lloyd behavior, a local endemic species in China, by performing experiments in four similar channels, with different velocities up to 0.75 m/s. The velocity preference varied by season and between day and night, indicating that the flow field should not be uniform and various depths and light levels should be provided in the water body.
Besides the usual water velocity measuring methods (like the use of Pitot-Prandtl tube), another reliable method suitable to single- or two-phase flows is Particle Image Velocimetry (PIV). Regarding two-phase flows, PIV can be used for various purposes, in both static and dynamic regime of the liquid phase, to determine the mixing and homogenization, the mass transfer, to characterize the bubble size, their ascending velocity and flow regime, and so on. Thus, in Kovats et al. [43], the method was applied in a bubble column to determine the continuous phase (water) velocities, in order to better characterize the flow and to understand and improve the mass transfer mechanism. In Murgan et al. [44], PIV and LIF were applied to determine the continuous phase velocity field induced by the operation of a sparger in a rectangular column with water at rest. Laakkonen et al. [45] used PIV to determine bubble size distribution and gas holdup in the flowing water inside a stirred vessel.
As regarding the use of PIV technique in free surface flows, literature shows there are different particular cases where this measurement method can provide valuable results. Yao et al. [46] applied PIV to determine the turbulence created by a grid placed inside a free surface channel. Seol et al. [47] used towed underwater PIV to determine the water vertical and horizontal velocity fields behind a floating body, in order to characterize the turbulent wake and the influence that free surface has on it. To demonstrate that image velocimetry can be successfully used to characterize relatively large free surface flows (like rivers), Muste et al. [48] performed laboratory measurements on a 3.4 m wide and approximately 23.5 m long free surface channel combining PIV with controlled surface wave image velocimetry in order to adapt the management of sediments at a river water intake. In this scope, velocity fields, streamlines, and vorticity fields were determined. Lindmark [49] used Laser Doppler Velocimetry and PIV to determine the velocity and the flow field in a channel to study both attraction and guidance methods to direct fish upstream and to guide them away from a turbine inlet.
2.2 Water intakes and ecological design requirements
As the conditions impacting the fish swimming ability are variable and complex, the design criteria of water diversion or intake facilities must be expressed in general terms, while their characteristics must respond to the local conditions. Water intakes represent all the constructions and installations (works) that are used to divert and capture water for various aims such as thermoelectric, hydroelectric, and micro hydroelectric plants producing “green” electric power, pumping stations for irrigation systems, water supply for industrial or domestic end users, navigation facilities, fish farms, tourism, and so forth. In the following paragraph, only river intakes will be analyzed.
During their operation, river intake facilities must be protected by the accidental blocking by solid bodies carried along the water. Any solid body caught in the water intake can cause its obstruction or even the temporary removal of service. One constructive recommendation regards the placement of the intake near the river bend. The most suitable location is toward the exterior, downstream of the maximum curvature point of about (0.66–0.9)·R, where R represents the radius of the meander curvature. Thus, mainly the surface currents will be captured [50].
Hydrotechnical facilities for river water diverting or capturing have proven to have a high impact on fish habitat over time [51]. Therefore, it is important to optimally design systems in order to retain and/or guide fish to/from water intakes, taking into account the size and behavior of local species [33].
According to European and national legislation, the design of an ecological water intake must take into account the following characteristics of the fish habitat:
The presence of migratory species over medium/long distances on the river sector of interest,
Duration of fish migration,
The migration period,
The swimming capacities of each analyzed species,
Fish behavior to various external stimuli.
In order to improve the efficiency of the fish guidance system in real operating conditions, the authors elaborated a patent application [52] that proposes, in addition to the bubble curtain, the use of an optoelectronic device to generate strobe light. These two systems create a behavioral barrier that prevents the accidental entry of small fish or juveniles through the intake holes.
2.3 Aspects related to fish hydrodynamics
Considering that the chapter is dedicated to the analysis of a fish guiding solution, in this section, a few aspects regarding the fish hydrodynamics are provided.
The fish swimming speed varies according to several physiological, biological, and aquatic environmental factors such as species, musculature system, age, stage of physiological development, season, required swimming time, behavioral aspects, flow speed, or water stream depth.
Fish swimming speed is usually defined in fish length and can be classified as:
Cruising speed (or sustained speed) is the fish swimming speed used for long periods of time (2–3 hours) without them getting tired. This speed is characteristic to migration or to maintaining the position in water. It also depends on environmental conditions and biological constraints.
Prolonged swimming speed is the maximum speed that can be maintained for medium periods of time (20–200 s), at the end of which the fish gets tired but recovers by resting [53]. However, since this speed does not lead to fish stress, it is used in the design of fish protection structures. One special category of prolonged speed is represented by the so-called prolonged critical speed that fish can maintain for a specified time period (usually 1 hour) but at the end of which fatigue occurs. According to [54], it was identified that the critical speed for a water temperature of 2–10°C is 1.35–1.55 m/s for trout and 1.3–1.4 m/s for grayling. Therefore, an increasing trend of speed along with temperature is observed.
Burst speed is the highest speed fish can reach for short periods of time (<20 s), after which it returns to a much lower speed for rest or recovery. This speed can be maintained for a short period and is only used in panic situations, as the fish becomes tired and stressed due to the additional energy use. Fish often use this speed in order to burst through fast streams areas, for example, when entering or exiting a water intake. After 20 s of swimming, fish can no longer maintain the swimming direction. The maximum burst speed is usually the initial one. The trout burst speed is about 9 lengths/s (in the range of 2–3 m/s), for 10 to 19°C water temperature.
In the case of fish ladders, when fish have to move at high speeds through fast streams areas, it is important that they recover in order to repeat these short periods of intense effort. The ability of fish to swim at burst speed is limited to a few hours per day, as some species require relatively a long time to recover. As a result of such efforts, some fish may die. The mortality rate of a trout that maintains this speed for 6 minutes is 40% at about 4–8 hours later.
Migratory fish species are attracted by specific water flow rates. These currents are called attraction or guiding flows and are considered criteria in the design of fish passage constructions (fish ladders). Design guidelines recommend specific guiding flow velocities at the fish ladder entrance of 1–2 m/s for trout, 1–1.7 m/s for grayling, and 1–1.5 m/s for barbel and barberry (Barbus petenyi), respectively. At the same time, it must be taken into account that fish need enough water depth when they “jump” within waterfalls, thresholds, or fords. For example, trout can jump up to 1 m. The ecological intake design and development for the experimental setup dedicated to the characterization of the bubble curtain envisaged in this chapter was carried out based on the trout behavior and characteristics. It is worth mentioning that the trout is the most well-known and common fish in the hill and river areas from Romania.
This chapter presents details on the experimental setup developed for the measurement of the velocities induced in water by the bubble curtain, as well as for the assessment of the respective dissolved oxygen variation. The methodology followed in each of the two test campaigns is also provided.
3. Experimental testing of a bubble curtain barrier for ecological water intakes
3.1 Experimental setup and methodology for induced velocities measurement
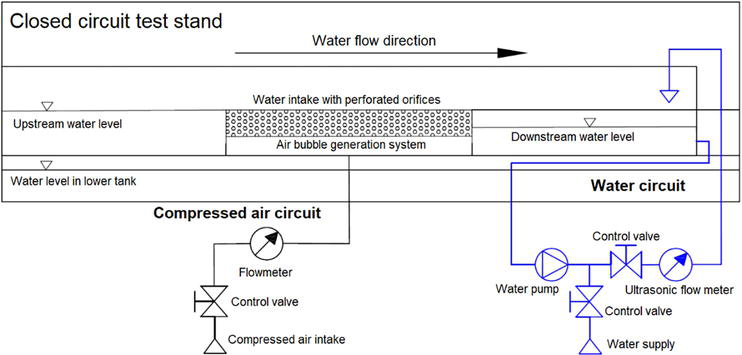
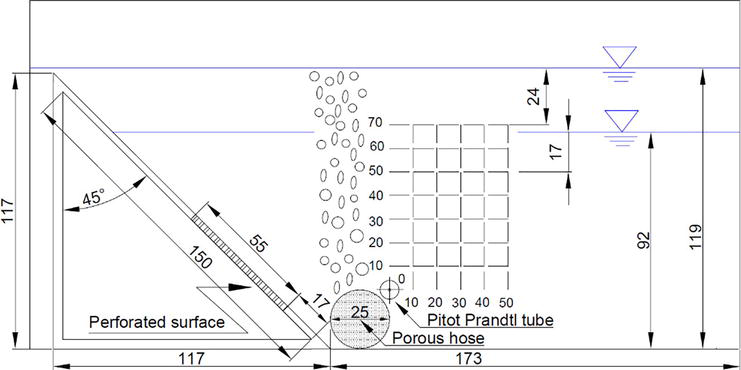
The aim of the experimental testing consists in characterizing the operation of a bubble curtain barrier by analyzing its associated induced velocities. The behavioral barrier was placed in the proximity of a scale model of river water intake. In this regard, an experimental setup has been designed and developed. The setup includes two main components: the water intake model and the bubble curtain behavioral barrier (Figure 1). The entire design has been developed in order to be fitted in a closed-circuit hydraulic stand.
Figure 1.
The design of the water intake and behavioral barrier experimental setup [12].
As described in detail in [12], the first component is represented by an intake chamber with perforated orifices (Figures 2 and 3) communicating through an inlet with a lower tank dedicated to discharging the water from the main channel of the test stand; the lower tank is located beneath the intake chamber, with water storage purpose. It allows the gravitational flow of the water drawn through an upper hole connected to the intake chamber. This water is recirculated by a pump and returned to the main channel. The captured water flow rate is determined by using a flow meter [12]. Figure 1 shows the design of the experimental setup.
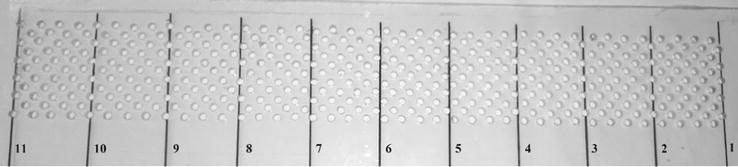
Figure 2.
Perforated plate of the water intake model [12].
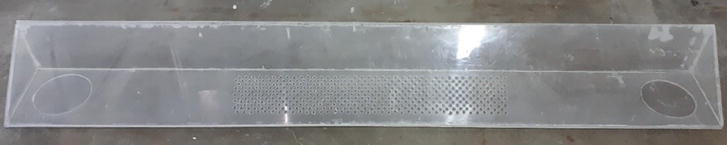
Figure 3.
The water intake chamber [55].
The water enters the intake model through 440 orifices with 4 mm diameter that are perforated on a 55 × 400 mm plexiglass plate as shown in Figure 2. Only 80 orifices have been used during the testing in order to prevent the flooding of the tank placed below (Figure 4) and the suction operating conditions. This way, the gravitational flow could be maintained.
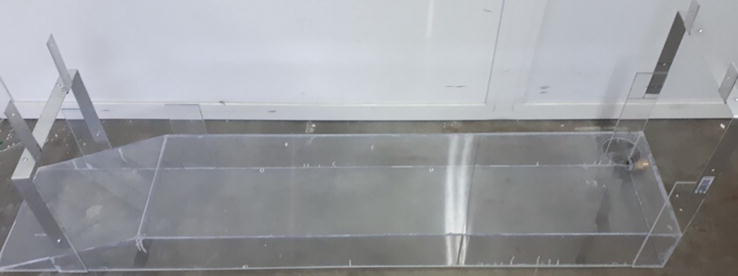
Figure 4.
The lower reservoir, with the role of collecting the water drained through the intake orifices [55].
To obtain the bubble curtain, a porous hose designed for aerating fishponds was placed at the bottom of the intake chamber. The bubble generator is supplied with compressed air through a dedicated circuit, provided with a precision valve for regulating the flow rate and a flow meter for measuring its value.
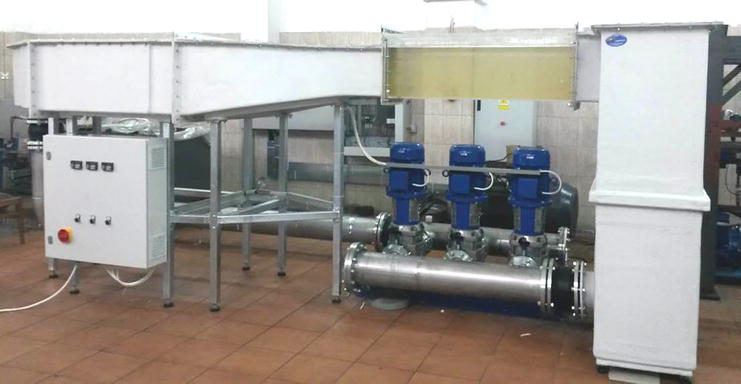
The water intake scale model and the behavioral barrier have been fitted in the closed-circuit hydraulic stand. The two components were placed in the 375 × 300 × 1015 mm transparent section of the stand. Tap water was used for performing the tests. The testing stand is provided with recirculation pumps and variable speed motors, which ensure the variation of the water flow rate and of the velocities between 0.05 and 1 m/s (Figure 5) [12].
Figure 5.
The experimental facility of the closed-circuit hydraulic stand [12].
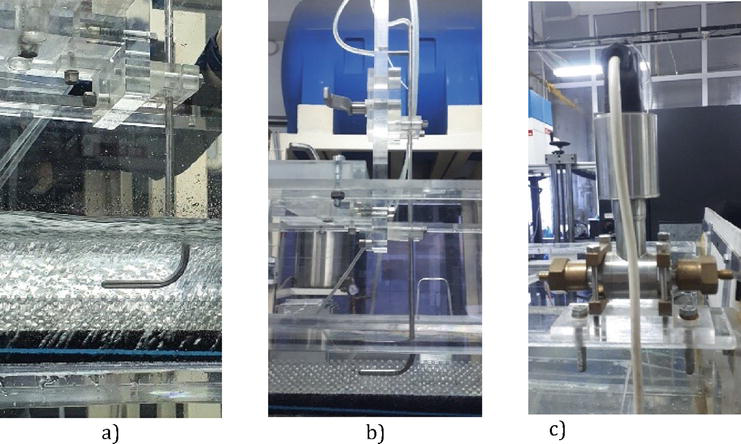
The stand is also provided with an automatic system dedicated to flow and velocity parameters control and acquisition. A Pitot-Prandtl tube has been used to measure the water velocity, as indicated in Figure 6.
Figure 6.
Pitot-Prandtl tube placed in water parallel to the flow direction for measuring the water velocity with (a) and without (b) air bubbles injection and the differential pressure transducer (c).
In order to perform a better characterization of the flow, a dedicated device was used, thus ensuring the velocity measurement in certain positions inside the water as indicated in Figure 6. The vertical and horizontal coordinates of the velocity measuring points are detailed in Figure 7.
Figure 7.
Velocity measuring points for two different water depths in the channel [12].
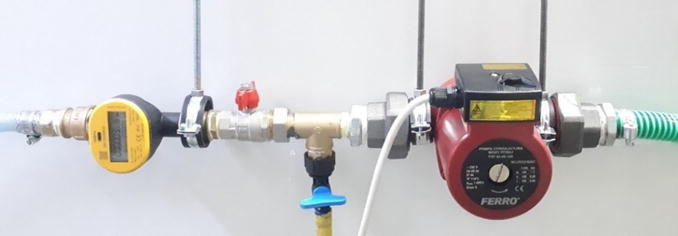
The following paragraph describes the methodology applied for carrying out the experimental testing of the bubble curtain barrier for the ecological water intake scale model. A certain water velocity inside the experimental stand channel was set by varying the pump group rotational speed. To assess the tandem operation of the bubble curtain and water intake, the water levels have to be determined both upstream and downstream the intake chamber upstream, as well as in the drainage area and lower reservoir. A Qalcosonic W1 Axioma smart ultrasonic flow meter was used for measuring the water flow rate (Figure 8) and a Cole Parmer flow meter for determining the air flow rate, respectively. The Cole Parmer flow meter scale ranges from 0 to 20 LPM, with a ± 5% accuracy. The differential pressure transducer model that was used for the water velocity measurement is AppliSens APRE-2000, having an accuracy of ±0.1% for the respective calibrated range of −5 to 70 mbar [12]. In order to perform the envisaged measurements, two water depths were considered: 92 and 119 mm, respectively. A deeper water allows more measurement point in the vertical direction. Thus, 36 points were selected for a water depth of 92 mm and 42 points for the 119 mm water depth. The positions of the measuring points for both cases are indicated in Figure 7.
Figure 8.
Components of the water circuit, which ensure the circulation of the flow captured through the water intake model.
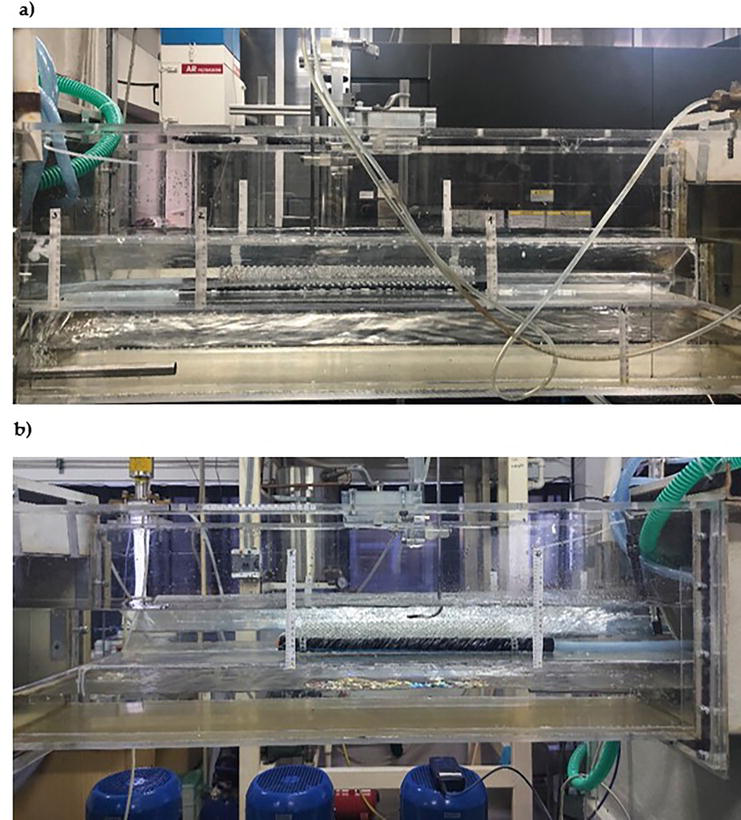
Figure 9 shows two sides of the experimental setup. These images have been selected for providing a better view of the gravitational flow from the water intake chamber to the lower reservoir.
Figure 9.
Experimental setup used for testing the bubble curtain barrier for ecological water intakes from both sides (a) and (b) [12].
Table 2 shows the conditions in which the behavior barrier operation was investigated. The registered induced velocities were compared with no air injection case (0 LPM). The two values of the water velocity inside the transparent channel of the experimental setup were either 0.33 or 0.535 m/s having in mind the most common water velocities of the Romanian mountain rivers.
vchannel [m/s]
H [mm]
Q [LPM]
Figure
0.33
92
0
11
10.5
12
15
17
0.535
92
0
13
10.5
14
15
18
119
0
15
10.5
16
15
19
Table 2.
Water depths, velocities, and airflow rates used for testing the scale model [12].
3.2 Experimental setup and methodology for the dissolved oxygen assessment
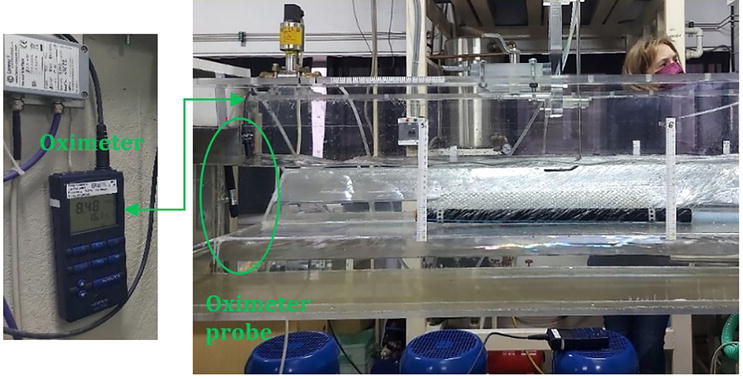
To evaluate the mass transfer (oxygen transfer) induced by the behavioral barrier, measurements were made on the experimental model presented in chapter 3.1, to which an oximeter was added (Figure 10). This measuring device is provided with a membrane sensor. It is worth mentioning that its measuring accuracy does not depend on the recirculated water flow rate. Thus, in order to analyze the mass transfer associated to the bubble curtain, the dissolved oxygen (DO) concentration in the water was measured.
Figure 10.
Measurement of the DO concentration in the water circulated through the experimental setup.
Although the main purpose of the behavioral barrier is to guide fish to the downstream area so that they are not captured by the water intake, the dispersed air injection into the water can lead to an increase in the DO content. Thus, the use of a bubble curtain can improve the living conditions of the fish.
The analysis of the mass transfer induced by the behavioral barrier aimed to determine if the bubble curtain aerates the water and to what extent, as it is known that the water aeration can be achieved by both submerged and surface transfer.
Thus, the DO concentration measurement was carried out with the WTW Oxi 315i oximeter in nonpermanent regime, by determining the dissolved oxygen value at different periods. The oximeter accuracy is ≤0.5% of the measured DO value and ≤0.1 K of the measured temperature value. This measuring device is a portable instrument that has embedded a microprocessor and a rapid pressure and temperature correction system, while the DO concentration measurement range is between 0.00 and 90.00 mg/L. The oximeter calibration was performed in water vapor saturated air, using an OxiCal-SL vessel for calibration in air.
The oxygen sensor was placed downstream the ecological water intake (as shown in Figure 10). The mass transfer generated by the bubble curtain operation along with the water intake scale model was evaluated by measuring the DO concentration variation with time and water temperature. The mass transfer assessment was carried out in two experimental cases, namely, the water intake operation with and without air injection through the porous hose in order to generate the bubble curtain. Thus, to determine the effect of dispersed air introduction into the water, it was necessary to measure the initial DO concentration in the case of water intake single operation. After this initial phase, the measurements were repeated for the case of water intake and bubble curtain tandem operation. The measuring position of the oximeter was kept and the DO values were recorded for two airflow rates injected through the porous hose: 10.5 and 15 LPM, respectively.
Given that a bubble curtain generates changes in the hydrodynamic field, the measurements focused on determining the velocities induced by the bubbles at different airflow rates injected through the porous hose. The field of induced velocities is characterized by the fact that in the far field, the maximum velocity is in the horizontal plane (along the flow), while in the near field, the maximum velocity is in the vertical plane (perpendicular to the flow). Thus, a sharp velocity gradient is created.
The horizontal velocity variation is very low as bubbles rise vertically to the free surface. Since the scope of the behavioral barrier is to repel fish from the water intake area, the vertical movement of the air bubbles was envisaged. Thus, in order to evaluate the impact of the bubble curtain on the channel water flow, only the vertical velocity variation was studied. Even though the bubbles are injected in flowing water, they still rise vertically to the free surface, while the main water flow influence is insignificant.
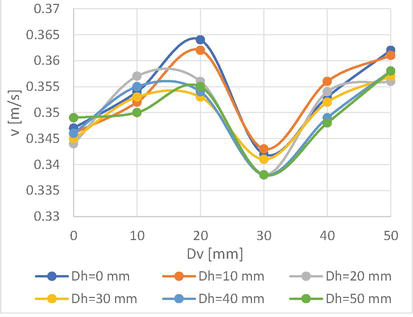
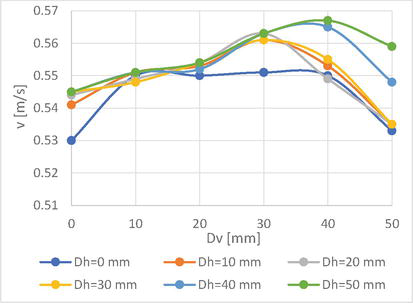
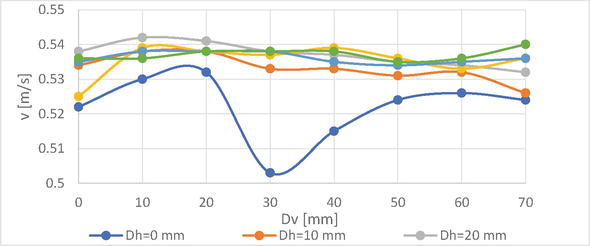
To analyze the bubble curtain impact on the water velocity inside the channel, the velocity variation curves were plotted for each studied case (Figures 11–19, [12]), as shown in Table 1. The velocity induced in water by the bubble column was denoted by v, the initial velocity in the channel by vchannel, the air flow rate by Q , and the vertical and horizontal distance from the origin of the chosen coordinate system to the velocity measuring point by Dv and Dh, respectively [12]. During the experimental testing, the water flow rate of the intake scale model was of 2.04 m3/h for 92 mm water level and of 2.15 m3/h for a level of 119 mm.
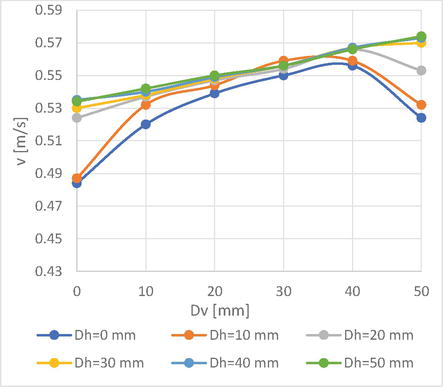
Figure 11.
Induced velocity variation for vchannel = 0.33 m/s, Q = 0 LPM, H = 92 mm.
Figure 12.
Induced velocity variation for vchannel = 0.33 m/s, Q = 10.5 LPM, H = 92 mm.
Figure 13.
Induced velocity variation for vchannel = 0.535 m/s, Q = 0 LPM, H = 92 mm.
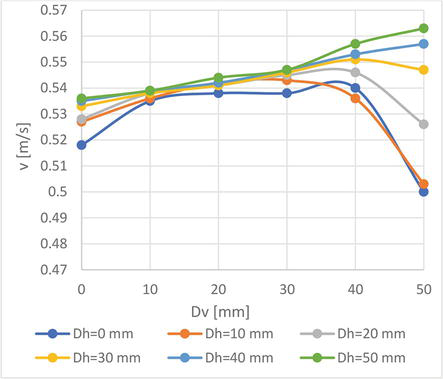
Figure 14.
Induced velocity variation for vchannel = 0.535 m/s, Q = 10.5 LPM, H = 92 mm.
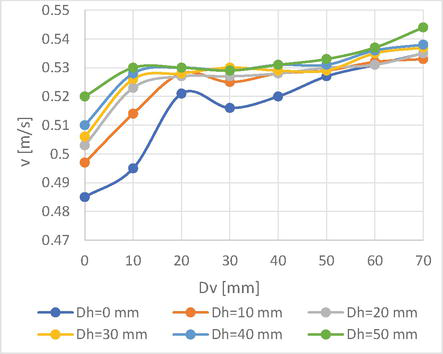
Figure 15.
Induced velocity variation for vchannel = 0.535 m/s, Q = 0 LPM, H = 119 mm.
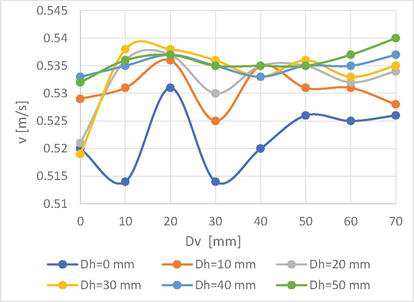
Figure 16.
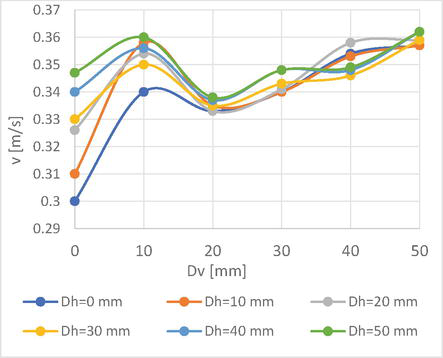
Induced velocity variation for vchannel = 0.535 m/s, Q = 10.5 LPM, H = 119 mm.
Figure 17.
Induced velocity variation for vchannel = 0.33 m/s, Q = 15 LPM, H = 92 mm.
Figure 18.
Induced velocity variation for vchannel = 0.535 m/s, Q = 15 LPM, H = 92 mm.
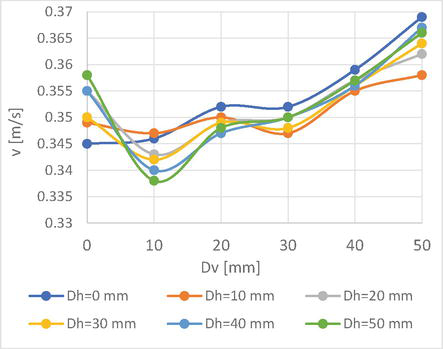
Figure 19.
Induced velocity variation for vchannel = 0.535 m/s, Q = 15 LPM, H = 119 mm.
Figures 11, 12, and 17 show that for 92 mm water depth, the difference between the curves showing the velocity variation on each vertical is smaller for 0.33 m/s water velocity than for 0.535 m/s. As we approach the free surface, an increasing difference between the curves can be noticed. Moreover, the velocity gradients for the 0, 10, 20, and 30 mm verticals are positively influenced by the air flow rate increase.
For the same water depth of 92 mm but a higher water velocity inside the main channel, namely, 0.535 m/s, Figures 13, 14, and 18 show that a higher turbulence degree is developed, mainly in the free surface area. When the velocity measuring points were near the free surface (17 mm, like the case of 40 and 50 mm measuring verticals), the velocities measured by the Pitot-Prandtl tube were lower. For a water depth of 119 mm, the closest measuring point to the free surface is the one located in vertical direction at a distance of 70 mm from the porous hose [12], as shown in Figure 7. In this case, the tube measures at 24 mm below the free surface, and thus, the turbulence influence is diminished.
Figure 15 shows the water velocity curves variation for vchannel = 0.535 m/s, H = 119 mm water depth, and no air injection. As a result of the disturbed water flow in the catchment area of the intake, a rapid increase in the velocity is noticed starting with the 10 to 30 mm verticals. On the other hand, Figures 16, 17, and 19 indicate significant velocity oscillations when the air is dispersed through the porous hose with 10.5 and 15 LPM flow rates. The most substantial oscillations were registered in the vertical measuring sections located in the bubble curtain proximity: 0, 10, and 20 mm, respectively. Starting with the vertical located at 30 mm, the variation becomes uniform. This is due to the increasing distance from the bubble curtain, which leads to a diminished influence on the flow.
The water intake operation also influences the water flow inside the main channel. In the proximity of the intake orifices (at a vertical distance of 20–30 mm from the origin of the chosen coordinate system, [12]), the velocity field is modified. The velocity field in longitudinal direction registers a decrease due to the velocity transverse component increase, as a result of the water lateral catchment trough the orifices. As reported in [12], Figures 11 and 15 show that when no air is injected, this influence is present in both the low water depth (92 mm) and low velocity (0.33 m/s) conditions, as well as in the high depth (119 mm) and high velocity (0.535 m/s) conditions. From a relative depth of 0.33–0.35 (a distance of 30–40 mm away from the intake area) upwards, the velocities in longitudinal direction are no longer influenced by the intake presence. When air is injected in reduced water depth and low velocity conditions (92 mm and 0.33 m/s, respectively), it determines an increase in the longitudinal velocities field in the intake inlet vicinity area (15–30 mm) until a relative depth of 0.33. As the airflow rate increases, the minimum longitudinal velocities’ rise toward the free surface is noticed.
Considering all the above findings of the carried out experimental research, it was concluded that the behavioral barrier causes a local modification in the water velocity field. This effect could be noticed even for low air flow rates (10.5 LPM), indicating that the bubble curtain can be effective also when using reduced airflow rates for its generation. In addition, this effect was noticed for the both tested water velocities in the main channel. In the case of 0.535 m/s, the bubbles are being carried away downstream. As indicated in [12], the position of the porous hose should be reconsidered. Thus, for increased velocities, it has to be placed with few centimeters offset upstream the river water intake model.
The carried-out tests indicated that the environmental barrier modifies the velocity field in the surrounding water, creating recirculation. This finding is motivating and highlights the conclusions reported in [48], which refer to the fact that the fish behavior can be influenced by a sharp velocity gradient.
In contrast to the studies reported in the literature, the present research has analyzed the velocity field under different conditions: two water depths, two velocities in the main testing channel, and two airflow rates for the bubble curtain generation. The results were compared to the case when no air was injected in the water. Furthermore, the experimental analysis was performed on a dedicated experimental setup. It consisted of a hybrid model that comprised both an ecological river water intake that does not influence river morphology and a behavioral barrier based on bubble curtains. The components’ individual operation as well as their tandem operation have been investigated. A special interest presents the impact that the bubble curtain has on the surrounding water velocity. This interest is justified by the presence of velocity and pressure gradient detectors in the fish sensory system as reported by Mogdans in [10]. These detectors make fish react to hydrodynamic stimuli such as sounds from air bubble rise and breakup. In the case of the present study, with the injected airflow increase, there are registered variations in the velocity magnitude in longitudinal direction for the same depth and different cross-channel distances. These variations can be noticed by analyzing Figures 11–19. Popper and Schilt [56] reported that besides the velocity gradient detectors, fish are also sensitive to acoustic underwater sounds of up to 100–200 Hz [12]. As reported by Braun et al. in [57], some fish have an increased sensitivity up to 1000 Hz. Frizell, and Arndt [37] showed that this is in the noise range that bubbles make when splitting. All these findings show that both hydrodynamic and sound stimuli associated to the bubble curtain operation influence the fish response and may be used in repelling fish solutions and strategies.
Taking into account the findings above (especially those reported in [10, 37, 56, 57]), we ascertain that the current research may bring new insights on the fish behavior when encountering bubble curtains.
Another aim of the carried-out research consisted in assessing the dissolved oxygen induced in the water by the bubble curtain. Therefore, Table 3 shows the DO values registered in the following operating conditions: with and without air injection, for 92 mm water depth of 0.33 m/s water velocity inside the main channel and different water temperatures, t.
Q = 0 LPM, t = 15.9 °C
Q = 10.5 LPM, t = 16°C
Q = 15 LPM, t = 16.1 °C
No.
Time [min.]
DO [mg/L]
Time [min.]
DO [mg/L]
Time [min.]
DO [mg/L]
1
0
7.42
0
7.79
0
8.19
2
2
7.45
5
7.88
2
8.22
3
4
7.47
6
7.89
3
8.24
4
5
7.47
7
7.94
4
8.26
5
10
7.48
8
7.98
5
8.28
6
12
7.52
11
8.00
6
8.29
7
15
7.53
12
8.02
7
8.3
8
17
7.54
13
8.03
8
8.31
9
20
7.56
14
8.05
9
8.34
10
25
7.57
15
8.06
10
8.36
11
28
7.58
16
8.07
11
8.38
12
31
7.63
17
8.06
12
8.39
13
33
7.64
18
8.08
13
8.48
14
36
7.64
19
8.12
14
8.5
15
39
7.68
20
8.14
15
8.52
16
42
7.7
—
—
16
8.51
17
45
7.7
—
—
17
8.54
18
48
7.72
—
—
18
8.53
19
50
7.72
—
—
19
8.55
—
—
—
—
—
20
8.59
Table 3.
DO concentrations for vchannel = 0.33 m/s, H = 92 mm, and different airflow rates injected for bubble curtain generation.
The carried-out experiments showed that the water intake operation when no air was introduced through the porous hose led to an increase in the DO concentration inside the circulated water through the experimental setup. This is explained by the fact that the water flows in a turbulent regime in a free surface channel. Thus, surface mass transfer occurs between the water free surface and the surrounding air.
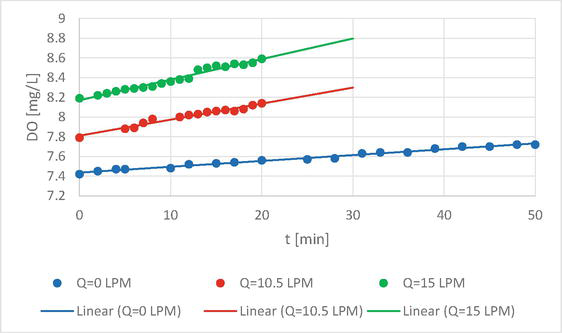
Figure 20 shows the dissolved oxygen concentration values in three experimental conditions: for Q = 0 LPM, Q = 10.5 LPM, and Q = 15 LPM, respectively.
Figure 20.
DO variation trend for different airflow rates injected in the water by the porous hose.
For a 50-minute operation of the water intake model and no air injected in the water, the experimental results indicated that an increase in the DO concentration of 4% is obtained compared to the initial value (DO increases from 7.42 to 7.72 mg/L). This demonstrates that the simple recirculation of water through the free surface channel leads to a surface mass transfer.
The injection of 10.5 LPM through the porous hose for 20 minutes led to a 5% increase (from 7.72 to 8.14 mg/L) in the DO concentration compared to the value obtained at the end of the measurements with zero airflow feed through the porous hose.
When introducing in the water an air flow rate of 15 LPM for 20 minutes, the bubble curtain generation led to an 11% increase in the DO concentration compared to the value obtained at the end of the measurements with no air injection. Thus, the DO increased to 8.59 mg/L.
The performed experiments showed that both the water recirculation through the experimental setup and the air dispersion through the porous hose in order to generate the behavioral barrier leads to the DO concentration increase. This contributes to the improvement of the aquatic fauna living conditions, as it is well-known that fish need a certain amount of DO for an appropriate development.
5. Analysis of power autonomy solutions for the behavioral barrier based on bubble curtains
The solutions that ensure the power autonomy of the bubble curtain behavioral barrier are based on the use of available renewable energy sources [58]. They are aimed especially at the conversion of solar and wind energy and their integration within an off-grid system, without any connection to the electric public grid. Considering that the water intake is intended to be used within mountain rivers, ensuring the energy autonomy of the behavioral barrier can be achieved by a microgrid deployment that consists of distributed generation sources (photovoltaic panels, wind turbines, and/or kinetic turbines) as well as a storage system. The microgrid must provide the necessary energy to operate a compressor that supplies compressed air to the bubble generation system and to the porous hose, respectively. Thus, for the case analyzed within the chapter, a 25-liter compressor was used, with a maximum pressure of 8 bar and 1.5 kW motor power, equipped with a pressure regulator. When the energy demand is simultaneous to the energy production, the battery is no longer needed. In order to prevent the overcharge or the complete discharge of the battery, a charge controller is used between the photovoltaic (PV) system and the battery. The charge controller usually includes also a discharge protection diode, which prevents the battery from being discharged at night by the PV or other system.
If higher output levels are required or industrial appliances are used, systems must provide an output voltage of 230 V A.C. In order to generate this output voltage, the system is provided with an inverter that transforms the direct current produced by the PV system or the battery current to alternating current.
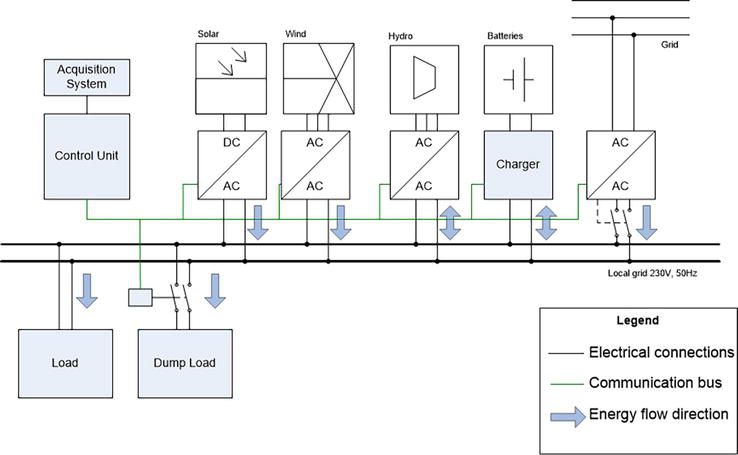
Considering the specific electrical parameters of a compressor, the power supply system solution consists in the production and use of electric power generated by the PV system as well as the wind-turbine, with off-grid operation. Thereby, the microgrid includes a charge controller, batteries to ensure autonomy with a charging management system, and an inverter for 230 V AC consumers. A typical configuration of microgrid using a wind turbine, a PV system, and a hydro turbine is shown in Figure 21.
Figure 21.
Typical configuration of a mixed microgrid [57, 59].
In order to supply the compressor used for the current proposal of behavioral barrier, the hydrokinetic turbine-based solution was not taken into account due to the fact that in general, the generated power is low, the water depth varies significantly, and it requires special attention when operating (periodic maintenance). A possible solution for the use of hydraulic turbines regards the placement of low-head bulb turbines, which provide more power, but these require separate hydrotechnical constructions, which affect the morphology of the river and the natural flow conditions.
In order to reduce losses due to processing and conversion of electrical parameters, a potential solution is given by a compressor with direct current drive and low voltage 12/24 V. Therefore, some of the microgrid components can be removed, such as the inverter and the AC voltage stabilizer. When sizing the system, the solar or wind potential of the envisaged location for the deployment of the water intake must be taken into account. It is also necessary to identify appropriate solutions in case certain renewable energy sources are not available (the presence of trees causes a significant shaded area, which impacts the production of solar energy and also disrupts the wind speed, leading to a low production of wind power).
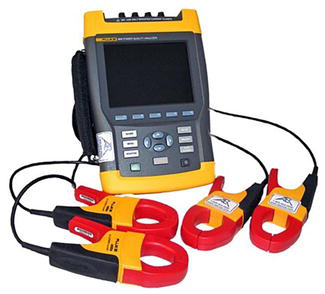
In order to establish the power autonomy solution for the behavioral barrier based on bubble curtains, an important data is represented by the compressor’s consumed power ensuring its operation at different flow rates. Thus, the time related to the air compressor’s electrical energy supply was determined experimentally, at the following airflow rates injected through the porous hose: 8, 10.5, and 15 LPM. Also, in order to determine the power consumed by the compressor, a FLUKE 434 three-phase power analyzer was used (Figure 22).
Figure 22.
FLUKE 434 three-phase power analyzer.
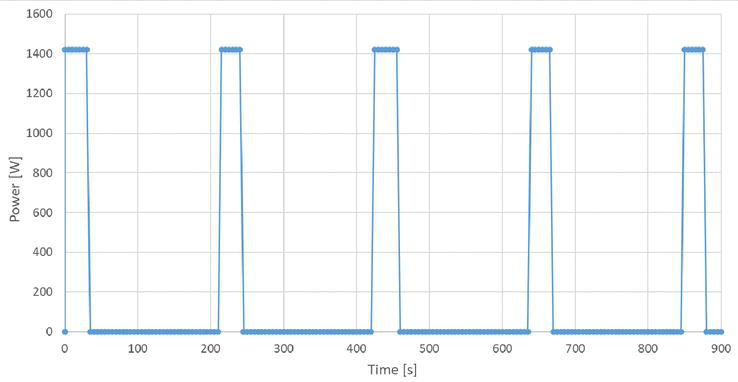
The designed system supplies compressed air with flow rates between 8 and 15 L/min/m to the porous hose. In the tested case, the length of the porous hose was of 1 m. Therefore, in order to provide general applicable results and indications, all the calculations are related to the reference length of the porous hose. Consequently, for longer lengths, the obtained result in terms of power or energy is multiplied by the length required for the considered river water intake (Figure 23).
Figure 23.
The compressor operation diagram for 15 minutes highlighting the input power—Functioning at 15 LPM airflow.
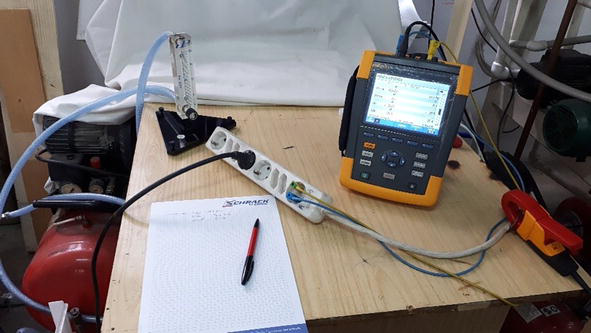
In order to perform the analysis of the required energy, the electrical parameters of the compressor were also measured during tests using the Fluke 434 type power analyzer (Figure 24). This measuring device helps predict, prevent, and solve problems in electricity production and distribution systems.
Figure 24.
Acquisition of electrical parameters during tests.
The characteristics of the compressor used for carrying out the tests, according to its data sheet, are as follows:
Supply voltage: 230 V,
Nominal power: 1.1 kW,
Tank capacity: 24 liters,
Nominal pressure: 8 bar.
The tests aimed to determine the following parameters:
instant power,
energy required for the bubble curtain operation for 1 hour,
operating time of the compressor, respectively the time between two successive drives.
Figure 24 shows an image captured during the electrical parameters measurement.
In the following paragraphs, the results of the performed tests regarding the electricity consumption are presented.
Thus, to initially charge the compressor from 0 to 7.5 bar, it is necessary to power the compressor for 83 seconds. The necessary energy supply is of 30.5 Wh, with 1420 W active absorbed power, 1550 VA apparent power, and a power factor of 0.92. For the proper operation of the bubble curtain (a uniform generation of bubbles over the entire surface of the porous hose), the compressor pressure was adjusted between the minimum threshold of 5 bar and the maximum of 7.5 bar. Thus, after the initial charge, during the bubble curtain generation, the compressor came into operation only to raise the pressure in the tank from 5 bar to 7.5 bar.
During the compressed air injection through the porous hose, respectively the generation of the bubble curtain using different airflow rates, the following values of the envisaged parameters were registered:
for the airflow rate of 8 LPM, the compressor was supplied for 28 seconds in order to raise the pressure from 5 to 7.5 bar, with 5-minute and 49-second breaks. The total energy consumption during 1 hour of operation was of 106.2 Wh; each 30-second operation period required the consumption of 10.9 Wh.
for the airflow rate of 10.5 LPM, the compressor was supplied for 28 seconds in order to raise the pressure from 5 to 7.5 bar, with 4-minute and 15-second breaks. The total energy consumption during 1 hour of operation was of 138.8 Wh, while each 28-second operation period required a consumption between 10.8 and 11.1 Wh.
for the airflow rate of 15 LMP, the compressor operated for 30 seconds to in order raise the pressure from 5 to 7.5 bar, with 3-minute breaks. The total energy consumption over an hour was of 200.6 Wh; each 30-second operating period required an energy of 11.8 Wh.
Consequently, in order to supply compressed air for a 24-hour period, the power required to operate the compressor and to generate the bubble curtain respectively is between 2.54 and 4.81 kWh. An additional 30.5 Wh are also necessary apart to the initial power consumption for loading the compressor. The instantaneous power that has to be ensured is approximately of 1500 W.
It is worth specifying that the values measured and presented above are only valid for one linear meter of porous hose in order to generate the bubble curtain.
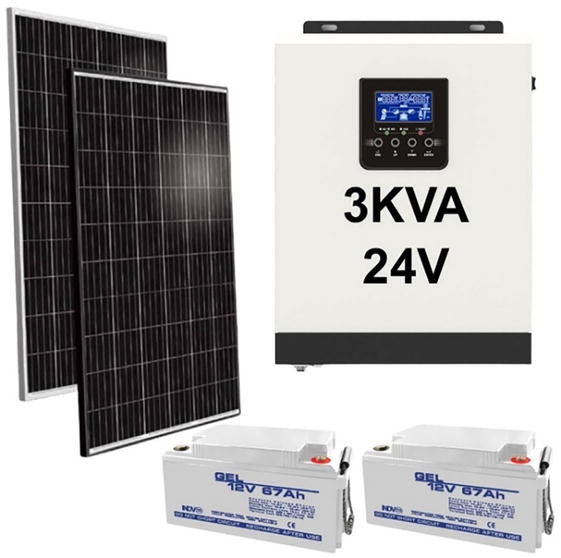
Based on the established necessary power, a photovoltaic system can be used, consisting of a string of PV panels, an off-grid controller, and storage batteries (as shown in Figure 25). If, in case of a specific application, an increased airflow rate, or a longer bubble curtain length is expected, then a wind turbine can also be integrated within the microgrid. An example of a microgrid suitable to isolated locations based on 2 or 3 polycrystalline photovoltaic panels, with a nominal maximum power of 450 Wp each, an off-grid controller of 3 kVA, which stores the surplus energy in two 12 V batteries connected in series, with a capacity of 67 Ah..
Figure 25.
Example of a 3 kVA photovoltaic system ensuring the power autonomy for the behavioral barrier based on bubble curtains.
This system provides the pure sine wave needed by the compressor’s electric motor. The resulting microgrid will include a controller with battery charging function, inverter for AC consumers, and Maximum Power Point Tracking system (MPPT), which optimizes the operation of the photovoltaic panels.
If other consumers are identified such as lighting, data acquisition and transmission, and GSM/4G communications, the system can be adapted with panels and batteries, according to any requirement. The proposed configuration is suitable to low energy consumption and does not require significant acquisition, installation, and maintenance costs. The power supply of the hybrid water intake also allows the addition of many useful facilities to its operation, such as reporting of extracted water flow, incidents or failures warning, video monitoring, and data transmission. Also, there can be achieved the measurement of electrical, hydraulic, as well as meteorological parameters and even remote actuation of certain valves or cleaning installations when required, without the need to travel to the intervention site.
The chapter approached the study of fish behavioral barriers for hydrotechnical facilities. In order to better understand their characteristics and implementation possibilities, some general aspects regarding the study of water intakes with behavioral barriers were presented. Thus, the study includes the assessment and analysis of behavioral barriers, elements regarding river water intakes and ecological requirements related to their design, as well as characteristics of fish hydrodynamics. A fish behavioral barrier based on bubble curtains for a river water intake was experimentally investigated. The experimental setup and the methodology used for measuring the velocities induced by the bubble curtain operation and for assessing its associated contribution to water aeration were also detailed.
The impact of the bubble curtain on the surrounding water velocity was determined by measuring the water-induced velocities in different points located in the experimental channel cross section. The barrier was placed in the proximity of the water intake model, where the flow is influenced by the water admission area. This contributed to the modification of the streamlines, thus helping in diverting the directional flow and deterring the fish from the intake area. Therefore, it can be concluded that the single or combined operation of the bubble curtain may safely divert the fish to a particular route, diminishing their accidental intrusion into the river intake.
The experiments showed a sharp water velocity gradient for almost all of the analyzed cases. This finding demonstrates that the bubble curtain determines the local velocity modification, creating the premises of influencing fish behavior. Furthermore, by modifying the injected airflow rate or the type, number, or placement of bubble generating sources, the curtain can adapt to different river flow conditions. Regarding the on-site operation of the behavioral barrier, its flow regulation can be performed from the river bank. Also, by considering the characteristics of the envisaged fish species, the minimum dispersed airflow rate that ensures an increase in the local velocity has to be identified. Thus, the fish guidance solution may be adapted to different operating conditions.
When operating in remote areas, without access to the electric public grid, a microgrid deployment is considered suitable. Thereby, a PV-based microgrid provided with a storage system was proposed.
The studies presented in this chapter did not include fish in the behavioral barrier testing. This is due to the fact that the current research was carried out in the frame of a national project focused on other scientific means that demonstrate the solution feasibility, namely, the induced velocities determination. The research activity did not consider animal testing for professional ethics reasons and was conducted on a state-of-the-art dedicated hydraulic stand that can accurately measure velocity fields and other parameters. Thus, reliable results can be provided for the preliminary experimental validation of the behavioral barrier. The inclusion of a biotic model is envisaged in the future research, in order to validate the proposed fish guidance solution.
An in-depth insight of the complex flow phenomena can be provided with the help of the Particle Image Velocimetry (PIV) measuring technique. PIV can be easily applied on the experimental setup developed in the current research and can be used to determine the velocity vectors direction in the proximity of the bubble curtain and in the water intake area as well.
After performing this laboratory testing, a combined water intake-behavioral barrier fish guidance solution can be deployed on-site to study the fish interaction with the bubble curtain in a real water body. Since the bubble plume better develops in higher water depth, a general recommendation for real operating conditions would refer to placing the diffuser as low as possible in the riverbed.
This work was supported by the Romanian Ministry of Education, Research and Digitalization, UEFISCDI, project number PN-III-P2-2.1-PED-2019-1444–Eco-hybrid Water Intake with Behavioral Barrier to Reduce the Impact on Fish Fauna and River Morphology, project number PN-III-P2-2.1-PTE-2021-0075 within PNCDI III as well as Nucleu contract no. 42 N/2023, project no. PN 23140101/2023.
1.World Wide Fund for Nature [Internet]. 2016. Available from: https://wwfint.awsassets.panda.org/downloads/lpi_technical_supplement_2016.pdf [Accessed: October 26, 2023]
2.Brasovanu L, Gogoașe Nistoran DE, Armaș I. The hydrological regime of the Prahova River along Carpathian and Subcarpathian stretch. Gtaylorruebuseo Patterns. 2018;3(1):32-42. DOI: 10.5719/GeoP.3.1/5
3.Water Framework Directive 2000/60/EC - Directive 2000/60/EC of the European Parliament and of the Council of 23 October 2000 establishing a framework for Community action in the field of water policy, Official Journal of the European Communities. 22.12.2000, L 327/1-L 327/72. Available from: https://eur-lex.europa.eu/resource.html?uri=cellar:5c835afb-2ec6-4577-bdf8-756d3d694eeb.0004.02/DOC_1&format=PDF [Accessed: October 26, 2023]
4.Bunt CM, Castro-Santos T, Haro A. Performance of fish passage structures at upstream barriers to migration. River Research and Applications. 2012;28:457-478. DOI: 10.1002/rra.1565
5.WWF-România [Internet]. Analysis of Specific Legislation Related to Planning and Issuance of Regulatory Acts Related to the Construction and Operation of Micro Hydropower Plants in Romania (Analiza Legislaţiei Specifice Din Domeniul Planificării şi Emiterii Actelor de Reglementare Aferente Construirii şi Funcţionării Microhidrocentralelor în România). 2013. 1-53. WWF-România, Bucharest, Romania. Available from: https://wwfeu.awsassets.panda.org/downloads/wwf_raport_legal_mhc_nov_2013.pdf [Accessed: October 26, 2023]
6.Linnansaari T, Wallace B, Allen Curry R, Yamazaki G. Fish passage in large rivers: A literature review. Mactaquac Aquatic Ecosystem Study Report Series. 2015:2015-2016. DOI: 10.13140/RG.2.2.32204.41604 [Accessed: October 26, 2023]
7.Kerr JR, Kemp PS. Masking a fish's detection of environmental stimuli: Application to improving downstream migration at river infrastructure. Journal of Fish Biology. 2019;95(1):228-237. DOI: 10.1111/jfb.13812. Available from: https://onlinelibrary.wiley.com/doi/full/10.1111/jfb.13812
8.Silva AT, Bærum KM, Hedger RD, Baktoft H, Fjeldstad HP, Gjelland KØ, et al. The effects of hydrodynamics on the three-dimensional downstream migratory movement of Atlantic Salmon. Science of the Total Environment. 2020;705:1-10. DOI: 10.1016/j.scitotenv.2019.135773
9.Hockley FA, Wilson CAM, Brew A, Cable J. Fish responses to flow velocity and turbulence in relation to size, sex and parasite load. Journal of the Royal Society Interface. 2014;11(91):1-11. DOI: 10.1098/rsif.2013
10.Mogdans J. Sensory ecology of the fish lateral-line system: Morphological and physiological adaptations for the perception of hydrodynamic stimuli. Journal of Fish Biology. 2019;95:53-72. DOI: 10.1111/jfb.13966
11.Turnpenny AWH, O’Keeffe N. Screening for Intakes and Outfalls: A Best Practice Guide [Science Report SC030231]. Bristol, UK: Environment Agency; 2005
12.Cîrciumaru G, Chihaia RA, Voina A, Gogoașe Nistoran DE, Simionescu ȘM, El-Leathey LA, et al. Experimental analysis of a fish guidance system for a river water intake. Water. 2022;14(3):1-22. DOI: 10.3390/w14030370
13.Katopodis C, Koon EM, Hanson L. Sea Lamprey Barriers: New Concepts and Research Needs. Ann Arbor, MI. Available from: http://www.glfc.org/pubs/pdfs/research/reports/Katopodisbarriers.pdf: Great Lakes Fishery Commission; 1994 [Accessed: October 26, 2023]
14.Li L, Maaswinkel H. Visual sensitivity and signal processing in teleosts. Fish Physiology. 2006;25:179-241. DOI: 10.1016/S1546-5098(06)25005-2
15.McLean AR. Strobe lights as a fish deterrent [thesis]. Victoria, BC: Royal Roads University; 2008
16.Bass AH, Lu Z. Neural and behavioral mechanisms of audition. Fish Physiology. 2006;25:377-410. DOI: 10.1016/S1546-5098(06)25009-X
17.Popper AN, Fay RR. Rethinking sound detection by fishes. Hearing Research. 2011;273(1-2):25-36. DOI: 10.1016/j.heares.2009.12.023
18.Zielinski D. Bubble barrier technologies for common carp [thesis]. USA: University of Minnesota; 2011
19.Ross WE, Dunning DJ, Thorne R, Menezes JK, Tiller GW, Watson JK. Response of alewives to high-frequency sound at a power plant intake on lake Ontario. North American Journal of Fisheries Management. 1993;13(2):291-303. DOI: 10.1577/1548-8675%281993%29013%3C0291%3AROATHF%3E2.3.CO%3B2
20.Haro A, Castro-Santos T, Noreika J, Odeh M. Swimming performance of upstream migrant fishes in open channel flow: A new approach to predicting passage through velocity barriers. Canadian Journal of Fisheries and Aquatic Sciences. 2004;61(9):1590-1601. DOI: 10.1139/f04-093
21.Heinrich JW, Mullett KM, Hansen MJ, Adams JV, Klar GT, Johnson DA, et al. Sea lamprey abundance and management in Lake Superior, 1957 to 1999. Journal of Great Lakes Research. 2003;29(1):566-583. DOI: 10.1016/S0380-1330(03)70517-6
22.Davis JC. Minimal dissolved oxygen requirements of aquatic life with emphasis on Canadian species: A review. Journal of the Fisheries Board of Canada. 1975;32(12):2295-2332. DOI: 10.1139/f75-268
23.Miranda LE, Hodges KB. Role of aquatic vegetation coverage on hypoxia and sunfish abundance in bays of a eutrophic reservoir. Hydrobiologia. 2000;427(1):51-57. DOI: 10.1023/A:1003999929094
24.Noatch MR, Suski CD. Non-physical barriers to deter fish movements. Environmental Reviews. 2012;20:71-82. DOI: 10.1139/a2012-001
25.Sorensen PW, Stacey NE. Brief review of fish pheromones and discussion of their possible uses in the control of non-indigenous teleost fishes. New Zealand Journal of Marine and Freshwater Research. 2004;38(3):399-417. DOI: 10.1080/00288330.2004.9517248
26.Bettoli PW, Maceina MJ. Sampling with toxicants. In: Murphy BR, Willis DW, editors. Fisheries Techniques. 2nd ed. Bethesda, MD: American Fisheries Society; 1996. pp. 303-333
27.Gibbs MA, Glenn NR. Development of the lateral line system in the shovelnose sturgeon. Brain, Behavior and Evolution. 2004;64(2):70-84. DOI: 10.1159/000079117
28.Taylor RM, Pegg MA, Chick JH. Response of bighead carp to a bioacoustic behavioural fish guidance system. Fisheries Management and Ecology. 2005;12:283-286. DOI: 10.1111/j.1365-2400.2005.00446.x
29.Patrick PH, Christie AE, Sager D, Hocutt C, Stauffer J Jr. Responses of fish to a strobe light/air-bubble barrier. Fisheries Research. 1985;3:157-172. DOI: 10.1016/0165-7836(85)90016-5
30.Welton JS, Beaumont WRC, Clarke RT. The efficacy of air, sound and acoustic bubble screens in deflecting Atlantic salmon salmo Salar L., smolts in the river Frome. Fisheries Management and Ecology. 2002;9(1):11-18. DOI: 10.1046/j.1365-2400.2002.00252.x
31.Dawson HA, Reinhardt UG, Savino JF. Use of electric or bubble barrier to limit the movement of eurasion ruffe (gymnocephalus cernuus). Journal of Great Lakes Research. 2006;32:40-49. DOI: 10.3394/0380-1330(2006)32[40:UOEOBB]2.0.CO;2
32.Taft EP. Fish protection technologies: A status report. Environmental Science & Policy. 2000;3(S.1):349-359. DOI: 10.1016/S1462-9011(00)00038-1
33.Bureau of Reclamation. Fish Protection at Water Diversions. A Guide for Planning and Designing Fish Exclusion Facilities. Denver, Colorado: Bureau of Reclamation; 2006; 480 p
34.Pegg MA, Chick JH. Aquatic Nuisance Species: An Evaluation of Barriers for Preventing the Spread of Bighead and Silver Carp to the Great Lakes. Final report for Illinois-Indiana Sea Grant A/SE (ANS)-01-01. Illinois, Indiana; 2018; 20 p
35.Turnpenny AWH. Review of Potential for Coarse Fish Entrainment at Potable Water Intakes on the Lower Freshwater Thames (Hurley-Teddington). Fawley ARL Ltd. Thames Region, Bristol, UK: Client Report to the Environment Agency; No. FCR 302/99; 1999
36.Jones PE, Tummers JS, Galib SM, Woodford DJ, Hume JB, Silva LGM, et al. The use of barriers to limit the spread of aquatic invasive animal species: A global review. Frontiers in Ecology and Evolution. 2021;9:1-9. DOI: 10.3389/fevo.2021.611631
37.Frizell WK, Arndt REA. Noise Generation by Air Bubbles in Water: An Experimental Study of Creation and Splitting. Minneapolis, USA: University of Minnesota Digital Conservancy; St. Anthony Falls Hydraulic Laboratory; 1987. [Internet]. Available from: https://www.usbr.gov/tsc/techreferences/hydraulics_lab/pubs/PAP/PAP-1044.pdf [Accessed: October 26, 2023]
38.Castro-Santos T, Haro A. Fish guidance and passage at barriers. In: Fish Locomotion. New Hampshire, USA: Science Publishers; 2010. pp. 62-89. DOI: 10.1201/b10190-4
39.Sanz-Ronda FJ, Fuentes-Pérez JF, Bravo-Córdoba FJ, García-Vega A, Ruiz-Legazpi J, Martínez de Azagra A. Estimating fish passage over velocity barriers for non-uniform flow conditions: A case study in flat-V gauging weirs. Biology and Life Sciences Forum. 2022;13(1):1-20. DOI: 10.3390/blsf2022013020
40.Kapitze R. Culvert Fishway Planning and Design Guidelines, Part C – Fish Migration Barriers and Fish Passage Options for Road Crossings. Townsville, Australia: James Cook University; 2010. [Internet]. Available from: http://www.jcu.edu.au/fishpassagedesign/ [Accessed: October 26, 2023]
41.Sánchez-González JR, Morcillo F, Ruiz-Legazpi J, Sanz-Ronda FJ. Fish morphology and passage through velocity barriers. Experience with northern straight-mouth nase (Pseudochondrostoma duriense Coelho, 1985) in an open channel flume. Hydrobiologia. 2022;849:1351-1366. DOI: 10.1007/s10750-021-04712-9
42.Liang Y, Hou Y, Hu W, Johnson D, Wang J. Flow velocity preference of Schizothorax oconnori Lloyd swimming upstream. Global Ecology and Conservation. 2021;32:e01902. DOI: 10.1016/j.gecco.2021.e01902
43.Kováts P, Thévenin D, Zähringer K. Characterizing fluid dynamics in a bubble column aimed for the determination of reactive mass transfer. Heat and Mass Transfer. 2018;54:453-461. DOI: 10.1007/s00231-017-2142-0
44.Murgan I, Bunea F, Ciocan GD. Experimental PIV and LIF characterization of a bubble column flow. Flow Measurement and Instrumentation. 2017;54:224-235. DOI: 10.1016/j.flowmeasinst.2017.02.004
45.Laakkonen M, Honkanen M, Saarenrinne P, Aittamaa J. Local bubble size distributions, gas–liquid interfacial areas and gas holdups in a stirred vessel with particle image velocimetry. Chemical Engineering Journal. 2005;109(1-3):37-47. DOI: 10.1016/j.cej.2005.03.002
46.Yao H, Cao L, Wu D, Gao Y, Qin S, Yu F. PIV study on grid-generated turbulence in a free surface flow. Water. 2021;13(7):1-909. DOI: 10.3390/w13070909
47.Seol DM, Seo JH, Rhee SH. Towed underwater PIV measurement for free-surface effects on turbulent wake of a surface-piercing body. International Journal of Naval Architecture and Ocean Engineering. 2013;5(3):404-413. DOI: 10.3744/JNAOE.2013.5.3.404
48.Muste M, Xiong Z, Schöne J, Li Z. Validation and extension of image velocimetry capabilities for flow diagnostics in hydraulic modeling. Journal of Hydraulic Engineering. 2004;130(3):175-185. DOI: 10.1061/(ASCE)0733-9429(2004)130:3(175)
49.Lindmark EM. Flow design for migrating fish [thesis]. Sweden: Luleå University of Technology, Department of Applied Physics and Mechanical Engineering, Division of Fluid Mechanics; 2008
50.Chihaia RA. Innovative Solutions Used for Developing Small Hydropower Plants with Reduced Environmental Impact (Soluţii Inovative Utilizate Pentru Amenajarea de Microhidrocentrale cu Impact Redus Asupra Mediului). Olt County, Romania: Hoffman Publisher; 2021. 126 p. ISBN 978-606-46-1483-4
51.Poletto JB, Cocherell DE, Mussen TD, Ercan A, Bandeh H, Levent Kavvas M, et al. Fish-protection devices at unscreened water diversions can reduce entrainment: Evidence from behavioural laboratory investigations. Conservation Physiology. 2015;3(1):1-12. DOI: 10.1093/conphys/cov040
52.Cîrciumaru G, Chihaia RA, Dancă P, Voina A. Patent application A/00357/23.06.2022. River water intake with behavioral barrier to reduce impact on fish fauna (Priză de apă pentru râuri cu barieră comportamentală pentru reducerea impactului asupra faunei piscicole). Bucharest, Romania: State Office for Inventions and Trademarks; 2022
53.Cano-Barbacil C, Radinger J, Argudo M, Rubio-Gracia F, Vila-Gispert A, García-Berthou E. Key factors explaining critical swimming speed in freshwater fish: A review and statistical analysis for Iberian species. Scientific Reports. 2020;10(1):1-12. DOI: 10.1038/s41598-020-75974-x
54.Taugbøl A, Olstad K, Magnus Bærum K, Museth J. Swimming performance of brown trout and grayling show species-specific responses to changes in temperature. Ecology of Freshwater Fish. 2019;28(2):241-246. DOI: 10.1111/eff.12447
55.Project number PN-III-P2-2.1-PED-2019-1444. Eco-Hybrid Water Intake with Behavioral Barrier to Reduce the Impact on Fish Fauna and River Morphology. Acronym Eco-WIBB; 2020-2022
56.Popper AN, Schilt CR. Hearing and acoustic behavior: Basic and applied considerations. In: Webb FJ, Fay RR, Popper AN, editors. Fish Bioacoustics. New York: NY, USA: Springer; 2008. pp. 17-48
57.Braun CB, Sand O. Functional overlap and nonoverlap between lateral line and auditory systems. In: Coombs S, Bleckmann H, Fay R, Popper A, editors. The Lateral Line System. Springer Handbook of Auditory Research. Vol. 48. New York, NY: Springer; 2013. DOI: 10.1007/2506_2013_19
58.Research project financed by ANCS Romania. Increasing the Efficiency of Technological Equipment and Processes for Energy Conversion from Renewable Sources, Objective 5: 1.5 kW Experimental Model of Autonomous Power Supply System Consisting of Integrated Renewable Energy Sources Grid. Contract no. 09350201. Coordinator: INCDIE ICPE-CA (Team Member);
59.El-Leathey LA. Energy management system designed for the interconnected or islanded operation of a microgrid using LabVIEW software. Chapter 3. In: Nayeripour M, Waffenschmidt E, Khesht M, editors. Smart Microgrids. London, UK: IntechOpen; 2018. pp. 45-64. DOI: 10.5772/intechopen.74856
Written By
Gabriela Circiumaru, Rares-Andrei Chihaia, Lucia-Andreea El-Leathey and Andreea Voina
Submitted: 10 November 2023Reviewed: 02 December 2023Published: 03 January 2024