Open Access is an initiative that aims to make scientific research freely available to all. To date our community has made over 100 million downloads. It’s based on principles of collaboration, unobstructed discovery, and, most importantly, scientific progression. As PhD students, we found it difficult to access the research we needed, so we decided to create a new Open Access publisher that levels the playing field for scientists across the world. How? By making research easy to access, and puts the academic needs of the researchers before the business interests of publishers.
We are a community of more than 103,000 authors and editors from 3,291 institutions spanning 160 countries, including Nobel Prize winners and some of the world’s most-cited researchers. Publishing on IntechOpen allows authors to earn citations and find new collaborators, meaning more people see your work not only from your own field of study, but from other related fields too.
Our team is growing all the time, so we’re always on the lookout for smart people who want to help us reshape the world of scientific publishing.
Home >
Books >
Association Rule Mining and Data Mining - Recent Advances, New Perspectives and Applications [Working Title]
Open access peer-reviewed chapter - ONLINE FIRST
Comparison of MARS, CART, and Linear Regression Models for Prediction of Body Weight of Non-descript Indigenous Goats in Lepelle-Nkumbi Local Municipality, South Africa
Written By
Madumetja Cyril Mathapo, Thobela Louis Tyasi, Kwena Mokoena, Rankotsane Victoria Hlokoe and Madikadike Kagisho Molabe
Submitted: 15 January 2024Reviewed: 23 January 2024Published: 24 April 2024
In Lepelle-Nkumbi Local Municipality of South Africa, 200 none-descript indigenous goats ranging in age from one to five years were the subjects of a study that compared the live body weight predictions made by stepwise linear regression, Classification Regression Tree (CART), and Multivariate Adaptive Splines (MARS) models. Several bodily measurements, such as canonical circumference (CC), sternum height (SH), body length (BL), ear length (EL), head length (HL), head width (HW), rump length (RL), rump height (RH), and rump width (RW). The evaluation criteria included the root mean square error (RMSE), coefficient of determination (R2), to decide which model was the best. According to the results, CART outperformed the others, obtaining the lowest RMSE (3.65) and the greatest R2 (0.80). The stepwise regression model outperformed data mining algorithms in male goats. According to the study, CART is a useful statistical technique for defining requirements for producing indigenous goats that are not very special. In addition, when predicting live body weight from body measuring features, the stepwise regression model should be considered.
Department of Agricultural Economics and Animal Production, University of Limpopo, Sovenga, Limpopo, South Africa
Thobela Louis Tyasi
Department of Agricultural Economics and Animal Production, University of Limpopo, Sovenga, Limpopo, South Africa
Kwena Mokoena
Department of Agricultural Economics and Animal Production, University of Limpopo, Sovenga, Limpopo, South Africa
Rankotsane Victoria Hlokoe
Department of Agricultural Economics and Animal Production, University of Limpopo, Sovenga, Limpopo, South Africa
Madikadike Kagisho Molabe
Department of Agricultural Economics and Animal Production, University of Limpopo, Sovenga, Limpopo, South Africa
*Address all correspondence to: madumetja.mathapo@ul.ac.za
1. Introduction
Livestock body weight can assist farmers in accurately administering medication (drug dosage), providing optimum feeding, estimating market prices, and deciding on appropriate breeding strategy to be implement [1]. In remote areas where there’s lack of weighing scales, morphological traits serve as the simple and cheap method for estimation of body weight [2]. Numerous investigations have been carried out on predicting body weight based on morphological traits using linear regression models [3, 4]. However, it was indicated that this linear regression models fail to accurately estimate live body weight of the animals since they are not able to detect and overcome multi-collinearity problems that occurs between independent variables [5]. The focus on enhancing developmental breeding strategies has increased the popularity of data mining algorithms such as Classification and Regression Tree (CART) and Multivariate Adaptive Splines (MARS) [6], and their application for estimation of body weight has been applied efficaciously on different livestock [7, 8]. CART and MARS are non-parametric methods and are employed for statistical analysis for ordinal, nominal and continuous variables to discover the effect of explanatory variables on categorical response variables [9]. They are statistical techniques which study the mathematical relation between one or more explanatory and response variables [10]. The utilization of CART and MARS methodologies in predicting animal body weight is crucial, considering various elements including age, breed, sex, and environment, all of which can influence body weight [11]. To the best of the authors knowledge, there is a dearth of information comparing stepwise linear regression, MARS, and CART to estimate the live body weight of non-descript indigenous goats in South Africa. Assessing and contrasting MARS, CART, and stepwise linear regression models for predicting live body weight of non-descript indigenous goats in South Africa was the aim of the study. The goal of the study is to determine which model is best suited for measuring the live body weight of non-descript indigenous goats in South Africa, as well as what factors are most important in raising live body weight.
The present study took place in four communities in Lepelle-Nkumpi Local Municipality, which is situated in the Capricorn District of Limpopo Province, South Africa, were the sites of the current study. Lepelle-Nkumpi’s geographic coordinates are roughly 24° 14′60.00″S latitude and 29° 39′59.99″E longitude. The average annual temperature of the area is 20°C, with summer temperature typically reaching 23°C and winter temperature at 20°C. The area receives between 453 and 474 mm of rain annually [12].
2.2 Experimental animals, management, and design
Non-descript indigenous goats of age between 1 to 5 years, sourced from villages within Lepelle-Nkumpi Local Municipality were used. An extensive farming system was employed, and non-pregnant, healthy goats were randomly selected for inclusion in the study. Cross sectional design was employed in the study.
2.3 Sampling method and the size of the sample
A multi-stage sampling method was utilized, with the deliberate selection of Lepelle-Nkumpi Local Municipality due to its highest population of non-descript indigenous goats, as reported by the Department of Agriculture, Land Reform Development in Limpopo. Four villages, namely: Lenting, Morotse, Seleteng and Lesetsi were purposively selected due to the extension officer working hand in hand with the farmers from those villages. Five farmers with at least 10 non-descript indigenous goats in their herd from each village were randomly selected. Therefore, a total of 200 goats of different sexes were used for linear body measurements traits in the study.
2.4 Data collection
A weighing machine calibrated in kilograms (kg) was used to determine the live body weight (BW), and tailor tape calibrated in centimeters (cm) was used to measure the body weight. Using Yakubu’s method [7], the following linear body measurements were obtained: muzzle diameter (MD), head length (HL), withers height (WH), sternum height (SH), body length (BL), head width (HW), heart girth (HG), ear length (EL), rump length (RL), rump height (RH), rump width (RW), and canonical circumference (CC).
2.5 Classification and regression tree (CART) and multivariate adaptive regression splines (MARS)
The binary decision tree structure known as CART is produced by recursively splitting a parent node, which at first holds the whole dataset, into two child nodes. According to Tyasi et al. [13], several comparable nodes are produced from a learning dataset using cross-validation training and test sets to minimize error variation. Producing a terminal node that improves node differentiation is the aim of this methodology [14]. The goal of CART is to create a model that can be easily understood for both ordinal and nominal scale event prediction [15]. In contrast, MARS is referred to as a non-parametric regression technique. The MARS algorithm was applied in accordance with Sengul et al. [6], explanations.
2.6 Stepwise linear regression
The following procedure was followed to estimate body weight via linear body measures using a stepwise regression model:
BW=a+b1x1+b2x2+…+bnxnE1
Where:
a = regression intercept.
b’s = regression coefficient of linear body measurements.
The development Version 29.0 of the Statistical Package for the Social Sciences was used in the creation of the stepwise regression model. To build and assess the MARS and CART models prediction abilities, Rstudio was used.
The MARS model developed to predict BW had 4 basic functions (Table 1). The model commenced with an intercept term, featuring a regression coefficient of 29.45. The subsequent term, being the first basic function, indicated that heart girth (HG) is greater than 65 cm, with a regression coefficient of 0.788.
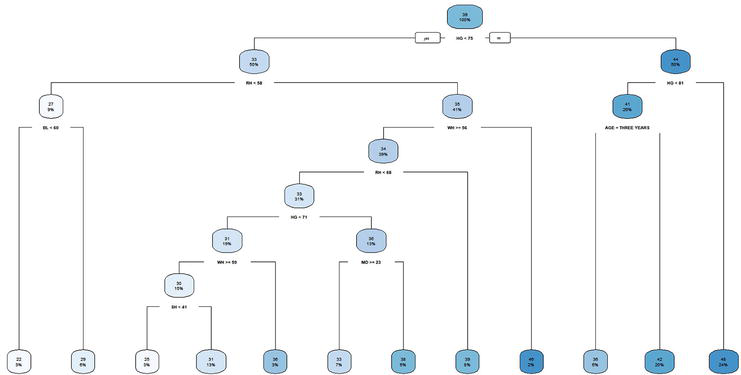
The diagram created using the regression and classification tree model is displayed in Figure 1. The initial node in the diagram displayed an average body weight (BW) of 39 kg, representing the entirely of the (100%). This root node was subsequently split into two subgroups. The primary influential variable on BW at the first level was heart girth (HG). Following that, the second level variables were RH and HG, the third level variables were BL, WH, and age (three years), the fourth level variable was RH, the fifth level variable was HG, the sixth level variable were WH and MD, and the seventh level variable was SH. The division of the root node was based on HG, specifically with value of 75 cm. from the first tree depth where HG is <75 cm the average BW was found to be 33 kg representing 50% of the animals while HG > 75 cm had the average BW of 44 kg representing 50% of the animals. At the second tree depth where RH was <58 cm the average BW was 27 kg representing 9% of the animals and where the RH > 58 cm, the average BW was 35 kg representing 41% of the animals. While when HG < 81 cm the average BW was 41 kg representing 26% and when HG was >81 cm the average BW was 48 kg representing 24% of the animals. At the third tree depth where BL was <60 cm the average BW was 22 kg representing 3% of the animals and when BL was >60 cm the average BW was 29 kg representing 6%, and when WH ≥ 56 cm the average BW was 46 kg with 2% representing the animals and when WH < 56 cm the average BW was 34 kg, representing 39% of the animals. Where the age was equal to three years the average BW was 35 kg representing 6% of the animal and 42 kg representing 20% of the animals. At the fourth tree depth where RH was <68 cm the average BW was 33 kg representing 31% of the animals and when RH > 68 cm the average BW was 39 kg representing 8% of the animals. At the fifth tree depth were HG < 71 cm the average BW was 31 kg representing 19% of the goats while when HG > 71 cm the averages BW was 36 kg with 13% representing the animals. At the sixth tree depth where WH was ≥59 cm the average BW was 36 kg representing 3% of the animals while when WH < 59 cm the average BW 30 kg with representing 15% of the animal. While where MD ≥ 23 cm the average BW was 38 kg representing 6% of the animals and when MD < 23 cm the average BW was 33 kg representing 7% of the animals. At the seventh tree depth where SH < 41 cm the average BW was 25 kg representing 3% of the animals and when SH was >41 cm, the average BW was 31 kg representing 13% of the animals.
Figure 1.
Showing CART diagram.
3.3 The predictive accuracy of MARS and CART
The goodness of fit indicated how well MARS and CART performed on both the training and test datasets (Table 2). The findings indicated that CART was the best model in terms of training data set. The findings showed that CART model had the lowest RMSE (3.65), RRMSE (9.43), SDR (0.45), CV (9.46), RAE (0.01), MAPE (7.93), AIC (370.44) and highest R2 (0.80), AdjR2 (0.80) and PC (0.89).
Criterion
CART
MARS
Decision
Train
Test
Train
Test
RMSE
3.65
6.28
4.36
5.49
Small is fantastic
RRMSE
9.43
16.01
11.24
13.99
Small is fantastic
SDR
0.45
0.82
0.53
0.71
Small is fantastic
CV
9.46
16.13
11.28
14.05
Small is fantastic
PC
0.89
0.65
0.85
0.73
High is fantastic
RAE
0.01
0.03
0.01
0.02
Small is fantastic
MAPE
7.93
11.03
8.46
10.01
Small is fantastic
R2
0.80
0.34
0.72
0.49
High is fantastic
AdjR2
0.80
0.34
0.71
0.44
High is fantastic
AIC
370.44
216.80
430
210.86
Small is fantastic
Table 2.
The predictive accuracy of MARS and CART models.
RRMSE: Relative root means square error; RMSE: Root mean square error; CV: Coefficient of variation; AdjR2: Adjusted coefficient of determination; SDR: Standard deviation ratio; PC: Pearson correlation; MAPE: Mean approximate error; R2: Coefficient of determination; AIC: Akaike information criterion; RAE: Relative approximate error.
3.4 Regression analysis
The stepwise regression model for female goats is shown in Table 3. The stepwise regression model includes features like RW, RH, SH, HW, and CC. the outcomes demonstrated that RW was the first characteristic to be incorporated into the model, explaining minimal variation in BW with a high AIC (713.25), BIC (716.0), and RMSE (6.41) and a lower R2 (36%). The findings showed that AIC, BIC, and RMSE decreased while R2 and AdjR2 increased with the addition of more selected traits to the model. This pattern demonstrated the models increased predictive power for BW.
Model
α
β1
β2
β3
β4
β5
β6
R2
AdjR2
AIC
BIC
RMSE
RW
7.67
1.97
0.36
0.36
713.25
716.50
6.41
RW + RH
−15.21
1.38
0.49
0.47
0.47
678.37
684.89
5.84
RW + RH + HG
−22.98
1.19
0.41
0.22
0.53
0.53
657.44
667.22
5.51
RW + RH + HG + SH
−32.97
0.90
0.27
0.29
0.40
0.59
0.58
633.97
647.00
5.17
RW + RH + HG + SH + HW
−36.26
0.68
0.20
0.30
0.33
1.18
0.62
0.61
620.47
636.76
4.98
RW + RH + HG + SH + HW + CC
−37.82
0.58
0.15
0.28
0.30
1.04
1.24
0.64
0.62
615.79
635.34
4.91
Table 3.
Using stepwise regression to estimate the body weight of female goats based on selected linear body measurements.
RH: Rump height; RW: Rump width, HW: Head width; HG: Heart girth; SH: Sternum height; CC: Canon circumference; α: constant; AdjR2: Adjusted coefficient of determination β1: variable; AIC: Akaike Information Criteria; R2: Coefficient of determination; BIC: Bayesian Information Criteria; RMSE: Root means square error.
Table 4 displays a stepwise regression model for male goats. Linear body measurements such as HG and CC were incorporated into the model. The findings indicated HG as the first trait to be included in the model and explained a higher variation in BW of male goats with R2 (92%), AdjR2 (0.91), AIC (20.63), BIC (23.88) and RMSE (2.84). The results further showed a higher variation, explained in the model when CC was included, with R2 (97%), AdjR2 (0.97), AIC (12.03), BIC (12.64) and RMSE (1.79). These results indicated that as traits added on HG the accuracy of the model for prediction of BW also increases.
Model
α
β2
β2
R2
AdjR2
AIC
BIC
RMSE
HG
−46.03
1.12
0.92
0.91
20.63
23.88
2.84
HG + CC
−52.96
0.93
2.32
0.97
0.97
12.03
12.64
1.79
Table 4.
Predicting the body weight of male goats using stepwise regression based on specific linear body measurements.
R2: Coefficient of determination; HG: Heart girth; CC: Canon circumference; RMSE: Root means square error; α: constant; β1: variable; AIC: Akaike Information Criteria; BIC: Bayesian Information Criteria; AdjR2: Adjusted coefficient of determination.
Different statistical approaches can be utilized to elucidate the variance between distinct characteristics and body weight [16]. Linear body measurements performs a crucial role in estimating live body weight, achieving an accuracy level of up to 90% compared to the actual body weight [13]. CART and MARS, along with a stepwise regression model, were initially employed to determine the impact of linear body measurement traits on the body weight of non-descript indigenous goats. The MARS model identified heart girth exceeding 65 cm as the most reliable estimator of live body weight for these goats. Similarly, CART model also highlighted heart girth as a primary estimator for live body weight for these goats. In does, stepwise regression models suggested that rump width could be employed as a sole trait for predicting body weight, while in the male goats, heart girth emerged as the most effective single predictor. The study’s findings contrast with those of Faraz et al. [17], where body length was identified as the top predictor for Thalli sheep. This discrepancy may be attributed to variations in environmental conditions and species. However, the current study aligns with the conclusions of Berhe [18], Temoso et al. [19], and Odadi [20], where heart girth was identified as the most reliable estimator of live body weight in both goats and sheep. Predictive performance findings indicated that CART model had the best predictive performance compared to MARS and stepwise regression models. However, it was outperformed by stepwise regression models in male goats. The findings of Celik [21] and Tirink et al. [16] were similar with the findings of the current study where CART performed better than MARS. However, Celik [22] and Faraz et al. [17], reported different findings from current study where it was found that CART model performed poor as compared to MARS in Pakistan goats and Thaili sheep, respectively.
Based on the results of the MARS, CART, and stepwise regression models, the greatest predictive live body weight, according to the current study, is heart circumference. When it came to forecasting the body weight of ordinary native goats of South Africa, the CART model outperformed the other models, according to the predictive performance. On the other hand, stepwise regression model outperformed data mining methods in male goats. These results point to the CART model’s importance as a useful technique for setting guidelines for producing nondescript native goats. Furthermore, the findings emphasis how crucial it is to take stepwise regression models into account to precisely predict body weight in native goats of South Africa.
We extend our gratitude to Lepelle-Nkumpi Local Municipality farmers whose animals we were able to use for this research. Furthermore, we are grateful to Dr. S. Mogashoa, a former extension officer at Lepelle-Nkumbi Local Municipality, for helping us comprehend the traits of unique indigenous goats.
1.Sabbioni A, Beretti V, Superchi P, Ablondi M. Body weight estimation from body measures in Cornigliese sheep breed. Italian Journal of Animal Science. 2020;19(1):25-30
2.Sandeep K, Dahiya SP, Malik ZS, Patil CS. Prediction of body weight from linear body measurements in sheep. Indian journal of. Animal Research. 2017;52(9):1263-1266
3.Aytekin I, Eyduran E, Koksal K, Aksahan R, Keskin I. Prediction of fattening final live weight from somebody measurements and fattening period in young bulls of crossbred and exotic breeds using MARS data mining algorithm. Pakistan Journal of Zoology. 2018;50:189-195
4.Rashijane LT, Mbazima VG, Tyasi TL. Prediction of body weight from linear body measurement traits of Boer goats raised at farm Tivolie, Limpopo Province, South Africa. American Journal of Animal and Veterinary Sciences. 2021;16:278-288
5.Eyduran E, Zaborski D, Waheed A, Celik S, Karadas K, Grzesiak W. Comparison of the predictive capabilities of several data mining algorithms and multiple linear regression in the prediction of body weight by means of body measurements in the indigenous Beetal goat of Pakistan. Pakistan Journal of Zoology. 2017;49:257-265
6.Sengul T, Celik S, Sengul O. Use of multivariate adaptive regression splines (MARS) for predicting parameters of breast meat in quails. Journal of Animal Plant Science. 2020;30:786-793
7.Yakubu A. Application of regression tree methodology in predicting the body weight of Uda sheep. Animal Science and Biotechnology. 2012;33(5):484-490
8.Hlokoe VR, Mokoena K, Tyasi TL. Using multivariate adaptive regression splines and classification and regression tree data mining algorithms to predict body weight of Nguni cows. Journal of Applied Animal Research. 2022;50(1):534-539
9.Ali M, Eyduran E, Tariq MM, Tirink C, Abbas F, Bajwa MA, et al. Comparison of artificial neural network and decision tree algorithms used for predicting live weight at post weaning period from some biometrical characteristics in Harnai Sheep. Pakistan Journal of Zoology. 2015;47:1579-1585
10.Hasanah SH. Multivariate adaptive regression splines for modelling. The Student Status at Universitas Terbuka. 2021;7:51-58
11.Khan MA, Tariq MM, Eyduran E, Tatliyer A, Rafeeq M, Abbas F, et al. Estimating body weight from several body measurements in Harnai sheep without multicollinearity problem. Journal of Animal and Plant Sciences. 2014;24:120-126
12.Capricorn District Municipality (CDM). The agriculture statuses in the Capricorn District, Limpopo Province. Integral Development Plan. 2014/15
13.Tyasi TL, Eyduran E, Celik S. Comparison of tree-based regression tree methods for predicting live body weight from morphological traits in Hy-line silver brown commercial layer and indigenous Potchefstroom Koekoek breeds raised in South Africa. Tropical Animal Health and Production. 2021;53(7):854-863
14.Koc Y. Application of Regression Tree Method for Different Data from Animal Science. MSc Thesis. Turkey: Department of Animal Science, Agricultural Faculty, Igdir University; 2016. p. 58
15.Olfaz M, Tırınk C, Önder H. Use of CART and CHAID Algorithms in Karayaka Sheep Breeding. Kafkas Univ Vet Fak Derg. 2019;25(1):105-110. DOI: 10.9775/kvfd.2018.20388
16.Tirink C, Piwczynski D, Kolenda M, Onder H. Estimation of body weight based on biometric measurements by using random forest regression, support vector regression and CART algorithms. Animals. 2023;13(5):798
17.Faraz A, Tirink C, Eyduran E, Waheed A, Tauqir NA, Nabeel MS, et al. Prediction of live body weight based on body measurements in thalli sheep under tropical conditions of Pakistan using CART and MARS. Tropical Animal Health and Production. 2021;53(301):1-12. DOI: 10.1007/s11250-021-02748-6
18.Berhe W. G: Relationship and prediction of bodyweight from morphometric traits in Maefur goat population in Tigray, Northern Ethiopia. Journal of Biomedical and Biostatistics. 2017;8(5):1-6. DOI: doi.org/10.4172/2155-6180.1000370
19.Temoso O, Coleman M, Baker D, Morley P, Baleseng L, Makgekgenene A, et al. Using path analysis to predict bodyweight from body measurements of goats and sheep of communal rangelands in Botswana. South African Journal of Animal Science. 2017;47(6):854-863. DOI: doi.org/10.4314/sajas.v47i6.13
20.Odadi WO. Using heart girth to estimate live weight of heifers (Bos indicus) in pastoral rangelands of northern Kenya. Livestock Research for Rural Development. 2018;30(1):1-9. Available from: http://www.lrrd.org/lrrd30/1/wood30016.html
21.Celik S, Yilmaz O. Comparison of different data mining algorithms for prediction of body weight from several morphological measurements in dogs. Journal of Animal and Plant Science. 2017;27(1):57-64
22.Celik S. Comparing predictive performances of tree-based datamining algorithms and MARS algorithms in the prediction of live bodyweight from body traits in Pakistan goats. Pakistan Journal of Zoology. 2019;51(4):1447-1456. DOI: 10.17582/journal.pjz/2019.51.4.1447.1456
Written By
Madumetja Cyril Mathapo, Thobela Louis Tyasi, Kwena Mokoena, Rankotsane Victoria Hlokoe and Madikadike Kagisho Molabe
Submitted: 15 January 2024Reviewed: 23 January 2024Published: 24 April 2024