Open Access is an initiative that aims to make scientific research freely available to all. To date our community has made over 100 million downloads. It’s based on principles of collaboration, unobstructed discovery, and, most importantly, scientific progression. As PhD students, we found it difficult to access the research we needed, so we decided to create a new Open Access publisher that levels the playing field for scientists across the world. How? By making research easy to access, and puts the academic needs of the researchers before the business interests of publishers.
We are a community of more than 103,000 authors and editors from 3,291 institutions spanning 160 countries, including Nobel Prize winners and some of the world’s most-cited researchers. Publishing on IntechOpen allows authors to earn citations and find new collaborators, meaning more people see your work not only from your own field of study, but from other related fields too.
This work presents an analysis of the impact of nationally determined contributions (NDC) under the Paris Agreement on global temperature rise. With the use of a climate simulation tool based on the concept of system dynamics, the study constructs a framework to project global temperature changes under other policy scenarios. The hypothesis is formulated based on the analysis of current, announced and best-case global/national policy scenarios. The research aims to address critical questions regarding the effectiveness of the ongoing NDC commitments in limiting global temperature rise to well below 2°C, in alignment with the Paris Agreement’s goals. The simulation results offer a roadmap by presenting possible grey areas for optimising the current NDCs in global and national energy policies and treaties, fostering international collaboration and reinforcing the global commitment to combating climate change. In addition, this study also presents other potential strategies for decarbonisation associated with facilitating the implementation of just and fair NDCs.
Industrial Engineering, Durban University of Technology, Durban, South Africa
Oludolapo Olanrewaju
Industrial Engineering, Durban University of Technology, Durban, South Africa
*Address all correspondence to: 22176142@dut4life.ac.za
1. Introduction
The Paris Agreement’s requirements for lowering greenhouse gas emissions and adapting to climate change require countries to be mandated to facilitate this movement by building policies to support the national determined contribution (NDC) initiative for each country. The Paris Agreement requires all nations to contribute ‘nationally determined contributionsʼ (NDCs) to the global effort to mitigate climate change. Countries publicly disclose their post-2020 climate change actions of reducing greenhouse gas emissions, establishing a balance between richer countries and developing nations and promoting equality, sustainable development and poverty eradication [1]. These goals are vital development priorities for many emerging nations. A simplified Earth system model was used in [2] to evaluate the global temperature slowdown in the NDC scenario (T = 0.6°C) and identify the causes in certain locations. The organisation for economic cooperation and development (OECD) and Asian Nations (R5ASIA) were the top two contributors with 39.3 and 36.8 per cent, respectively. The next two largest contributors were the Latin American and Caribbean (R5LAM) and Middle Eastern and African (R5MAF) areas, with 11.5 and 8.9%, respectively. The Reforming 5 Economies Forum (R5REF) is the remaining 3.5%. The extent to which a region pitches in to help cut carbon emissions is a major factor. Short-lived aerosols’ influence on lowering SO2 levels in R5ASIA was modest but significant [2].
In the study by Koven C. et al. [3], CO2 concentrations fall below pre-industrial values when cumulative CO2 emissions approach zero through negative CO2 emissions, yet long-term climate change persists, guided by multi-century dynamical processes. Even if commitment to maintaining a consistent atmospheric composition and a steady stream of emissions, the global mean temperature and sea level would continue to increase [4]. A study by Grigoroudis et al. [5] explored the best emissions policies using the emission plans of only China and the USA that are compatible with temperature limitations. The findings indicate that negative emissions and severe cuts can maintain temperature stability of 2.5°C. However, relying on future technical advancements to make negative emissions feasible might lead to ongoing carbon releases and irreversible climatic implications. Jung et al. [6] examined the financial cost, risk and feasibility of lowering greenhouse gas emissions using a general equilibrium model and many burden-sharing schemes. Evaluations include one extended NDC scenario and three 2050 scenarios. The modelling results suggest that a GHG reduction in the Korean economy might cost between USD 100 and USD 350 in 2050, compared to the NDC extended scenario. Without a major economic and energy infrastructure overhaul, reducing greenhouse gas emissions in Korea would be costly.
Using a shared socio-economic pathway (SSP) of 1–2.6°C, the study by Vakilifard et al. [7] evaluated the advantages of introducing negative emission technologies in the global warming response to cumulative carbon emissions beyond 2050. The effective zero emissions commitment (eZEC) and the global warming response were evaluated over 86 unique model realisations. After net-zero emissions are achieved, the capacity to fulfil climate objectives and avoid further warming is improved by including negative emissions.
The findings from these studies highlighted above and many others, such as the ones in [8, 9, 10, 11, 12], have shown that reducing emissions should not be a delayed option in energy and climate policies or the effort to only selected countries. For instance, the effect of the USA’s withdrawal attempt from the Paris Agreement in 2017 was evaluated to increase strain on the global average of emissions reduction as well because of high costs on other countries [8]. The urgent need to combat climate change has led to the development and implementation of various policies and commitments worldwide. Among these, the national determined contributions (NDCs) under the Paris Agreement stand as a crucial framework where countries pledge their efforts to reduce greenhouse gas emissions [13].
This study uses a system dynamic approach to examine the updated NDCs and classify all the countries under China, the USA, India, the EU, the rest of advanced countries and rest of the developing countries to study the effect of the current NDC on global temperature levels, and what best reduction would result in the 1.5°C scenario.
The ongoing discourse on climate legislation underscores the importance of enhancing and executing NDCs to achieve the objectives outlined in the Paris Agreement. It emphasises the need for meticulously tailored policies and strategies for individual sectors to successfully attain the ambitious objectives of carbon mitigation, as delineated in global accords, particularly the Paris Agreement. Examining the effectiveness of nationally determined contributions (NDCs) in reducing global temperatures to below 2°C as stipulated by the Paris Agreement goals is imperative. Using fractional integration and cointegration methods, the research by Gil-Alana [14] examines the connection between CO2 emissions and global temperatures. The results for the short-term panel dataset contradict the hypothesis of cointegration since the orders of integration are different for the two variables. However, long-term time series data indicates a lasting positive correlation between emissions and temperatures [14]. It is also important to note that the emissions accumulation in the atmosphere within the short-term outlives into a long period, enabling the noticeable effects on global temperatures.
A dynamic simulation framework is useful in predicting variations in global temperatures under various policy scenarios of emissions reduction, which is the aim of this study with the use of a just and fair transition approach. The just transition concept is a philosophical paradigm that promotes social and economic justice in the transition to a low-carbon economy [15, 16, 17]. It prioritises equity, inclusivity, job creation, environmental justice, worker support and sustainable development by employing strategies for reducing emissions. These strategies include investing in green jobs, transitioning to renewable energy, carbon pricing, regulatory policies, infrastructure investment, community engagement, education and training. These strategies aim to create sustainable employment opportunities, reduce pollution and protect vulnerable communities. By embracing these principles, policymakers, businesses and communities can work together to transition to a low-carbon economy that promotes environmental sustainability and social justice, making the journey towards a more sustainable future fair and inclusive.
3. Progresses in global emissions, average temperature rise, renewable energies and commitment to emissions reduction
3.1 Historical emissions versus average temperature rise level
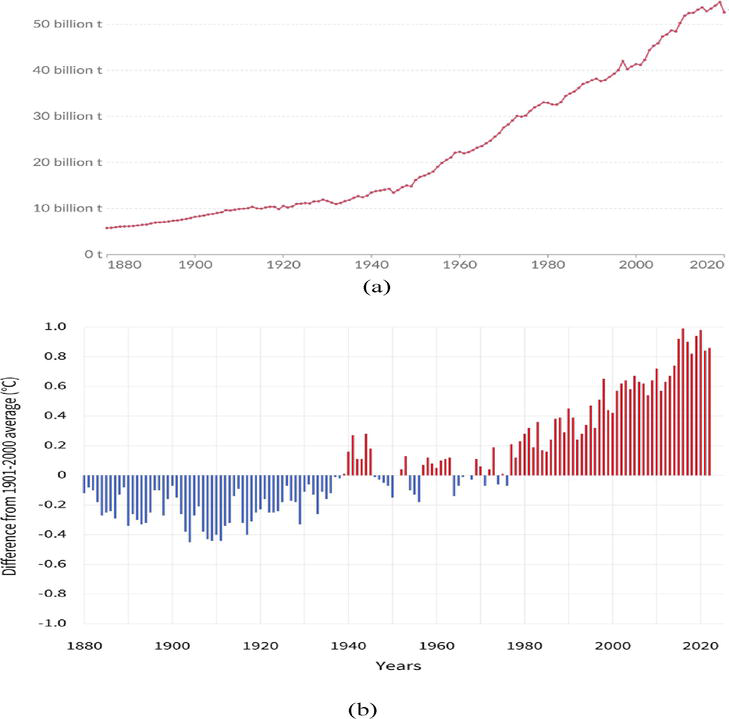
The continuous increase in the emissions level is shown in Figure 1(a), with experience in increasing average temperature as well, beyond the pre-industrial level, as indicated in Figure 1(b). Consequently, there has been resulting global warming and adverse effects that distort the natural ecosystem.
Figure 1.
Historical emissions versus average temperature rise level. (a). Emissions growth, according to Ritchie H. et al. [18] and Jones M. et al. [19]. (b). Global average changes in surface temperature 1880–2022, according to NAOO [20].
Greenhouse gas emissions (GHG) can be categorically divided mainly into emissions from CO2 and other gases such as CH4, NOx, hydrofluorocarbons (HFCs) and sulphur hexafluoride (SF6) and perfluorocarbons (PFCs) based on the Kyoto Protocol [21]. The first constitutes most of the emissions from energy production and consumption, often found in the power, industrial processes, transport and building sectors. Understanding the effects of the emissions in terms of global warming potential (GWP) is often made with reference to its equivalence with CO2. For instance, 1, 25, 298 are regarded as the equivalency factor for CO2, CH4 and N2O in terms of 100-year GWP. Similarly, HFCs (675 and 14,800 for CH2F2 and CHF3), PFCs: 7390, 12,200, 8830, 8860, 10,300, 13,300, 9300 for CF4, C2F6, C3F8, C4F10, c-C4F8, C5F12 and C6F14, respectively, SF6: 22,800.
All the gases have significant impacts on global weather patterns, which last for years; hence, they are determined by adding the radiative forcing caused by a gas’s pulse emission over a certain amount of time. However, an evaluation of the final implications of climate change is not directly tied to these calculations. As a result, Kirschbaum M. [22] developed s new metric called the climate-change impact potential (CCIP), which evaluates the significance of pulse emissions of different gases, such as CO2, methane and nitrous oxide. Three categories of consequences are identified: warming rate, cumulative warming and temperature rise. According to the CCIP, long-lived nitrous oxide has a greater impact than short-lived methane over 100 years.
In the next section of this study, the emissions from the two categories of GHG are presented within the last 5 years.
3.2 Short-term level emissions trajectory
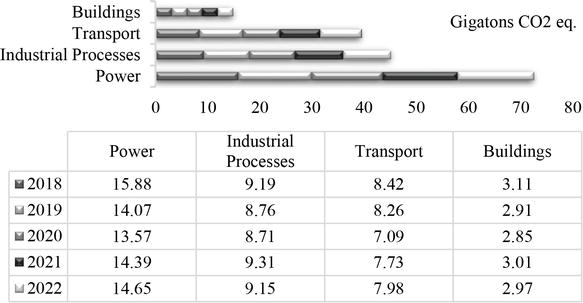
Figure 2 shows the emissions trends from energy (i.e., CO2 emissions) during the last 5 years, while Figure 3 compares emissions of Figure 2 with those obtained from other gases.
Figure 2.
Global CO2 emissions by sector 2018–2022. Data from the IEA report and Ritchie, H. et al. in [9], and [23], respectively.
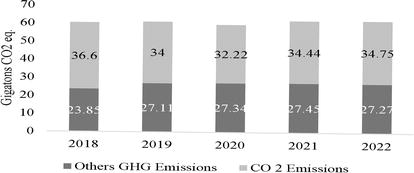
Figure 3.
Global GHG emissions from 2018 to 2022. Data from the IEA report and Ritchie, H. et al. in [9], and [23], respectively.
Over half of all emissions (i.e., 60.5, 55.6, 54.1, 55.64 and 56% between the years 2018 to 2022, respectively) come from the energy processes, where the burning of fossil fuels is the norm in the power sector with the highest value of CO2 emissions contributions for all the years presented in Figure 1. Followed by industrial operations, such as cement manufacturing and chemical manufacturing, also contribute significantly to methane emissions, as do agriculture and land use. Emissions from the combustion of fossil fuels are a huge problem and transportation modes, including cars, planes, ships and trains, all contribute to this problem. Buildings contribute to emissions from heating, cooling and electrical use because of the energy used for these purposes (Figure 4).
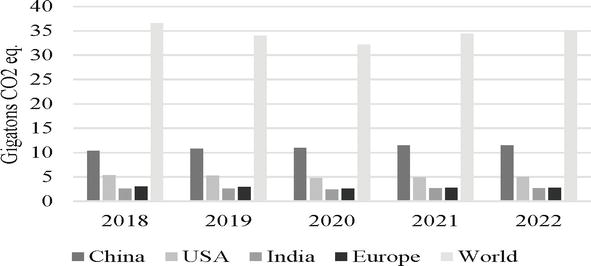
Figure 4.
Top CO2 emitting countries with emission values from 2018 to 2022. Data from the IEA report and Ritchie, H. et al. in [9], and [23], respectively.
3.3 Global renewable levels Progress
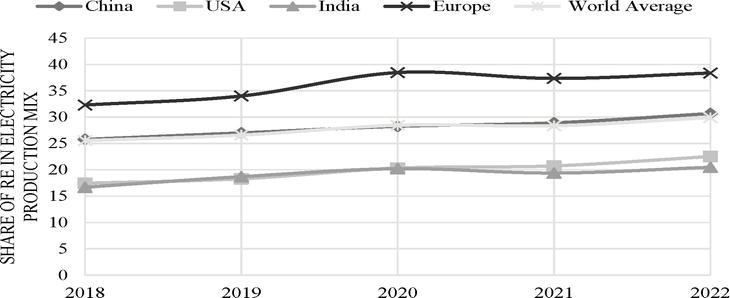
The use of these renewable energy technologies not only helps the economy, society and the environment but also advances the cause of sustainable development. Renewables account for less than two-thirds of total energy consumption and 85% of total power output [24]. The amount of renewable energy that must be deployed must be increased at least six times over what is now planned to keep global warming to far below 2°C; hence, decarbonisation strategies, such as the ones highlighted by Akpan et al. in [25], for carbon emission, control is critical. If the global energy system is transformed, everyone should have access to less expensive and reliable energy at a higher level of security. Theory, ideologies, innovations, global needs and policy conceptions, as well as implementation, continue to influence the adoption of renewable energy technology in a wide range of applications and sectors. Countries striving to achieve a high level of reliance on renewable energy sources employ a diverse range of renewable energy technologies. Factors, such as geographical location, resource availability, technological capacity, governmental aims, policy frameworks, infrastructure development and economic situations, influence the variability of renewable energy sources. About 30 countries that have achieved nearly 100% renewable energy (RE) utilisation exhibit a predominant reliance on a specific RE source such as wind, solar or geothermal [26]. Notably, the most prevalent RE source among these countries is hydropower, accounting for a minimum of 70% of its RE generation. China, the United States, India and the European Union, which are the largest emitters of CO2, are yet to reach even a 40% RE in their national electricity mix, as shown in Figure 5. However, these countries exhibit a diverse range of renewable energy sources within their overall energy portfolio, including hydropower, wind power and solar energy. The United States and India contain a diverse range of renewable energy sources in their respective portfolios, including wind, solar, hydropower and biomass. There is a variance in the proportion of renewable energy sources among member states of the European Union, with significant progress recorded in Germany and Denmark as they transition towards renewable energy. Unfortunately, geothermal energy has received relatively limited attention in many nations, potentially attributable to the significant upfront costs associated with infrastructure development and execution.
Figure 5.
Share of RE in electricity production 2018–2022. Data from Ritchie, H. et al. [27].
To keep this value well within the 1.5–2°C range and mitigate the consequences of climate change, such as drought, flood and heat wave, existing and projected policies have been made by several countries. Meanwhile, the current finance set aside to facilitate clean energy projects to curb the emissions from the different contributing sectors and countries is not sufficient to achieve the Paris Agreement of COP21 [28, 29].
3.4 Updated National determined contribution of top CO2-emitting countries
The use of these renewable energy technologies not only helps the economy, society and the environment but also advances the cause of sustainable development [5]. And because of the urgent need to keep the global temperature within the 1.5°C scenario, many countries, herein top emitting countries, have proposed and are working towards this goal by introducing national energy policies that could drive this change. Mostly the transition to the use of renewable energies. These policies are summarised in Table 1.
Category
Country/Region
Summary of RE Targets
NDC (Emissions Reduction)
To Address 1.5 °C scenario issues
Ref.
A
China
Increased RE Target in the National Grid
The fourteenth five-year plan raises the target for renewable energy to 30 per cent of total electricity consumption by 2025 (18 per cent for non-hydro renewables).
Energy Storage/Hydrogen Roadmap Development
50GW new added battery energy storage capacity by 2025
1.3GW of annual hydrogen production per year by 2025
The process of simulating pathways towards limiting global warming to 1.5 degrees celsius requires the use of complex climate models and scenario studies. These models are designed to incorporate various factors influencing the climate system such as greenhouse gas emissions, land use changes and aerosols. They help predict potential climatic impacts over time resulting from various emission reduction strategies and policies. The intergovernmental panel on climate change (IPCC) frequently assesses diverse emission scenarios and their corresponding implications for global temperature increases. Climate models are sophisticated tools used to simulate the potential effects of various emission scenarios on the Earth’s climate system, considering complex interactions among the atmosphere, oceans, land and ice. Mitigation methods include renewable energy sources, energy efficiency enhancements, reforestation efforts, carbon capture and storage initiatives and modifications in agricultural practices. Simulations also consider potential adaptation actions required to address climate change consequences such as uncertainties related to human behaviour, technological improvements, natural variability and policy changes within the climate system. Policy assessments evaluate the viability and efficacy of various policies and measures designed to mitigate global warming impacts.
4.2 Existing and related climate models and model selection for study
Long-term data (temperature and GHG concentrations) spanning thousands of years is required for studying climate change. The study of current climate change and the development of projections for the future requires a solid foundation in the study of previous climate change. Based on historical findings and trends, many tools have been used to reconstruct the temperature record and predict GHG values and vice versa. The key tools, models and their corresponding findings are presented in Table 2.
U/D – User dependent, NZE – Net Zero, Announced Pledges (AP), STEP (Stated and Planned), A – Assumed based on temperature projections from IPCC reports.
The three models and tools (C-ROAD, MAGIC and GEC) highlighted in Table 2 are all integrated assessment tools, which extract insights and data from several existing and conventional climate models, meteorological, macroeconomic and sector-by-sector data. The GEC model is used mainly to study possible future states of transition into net-zero carbon emissions from energy systems only while keeping in view several sets of assumptions consistent with the sixth assessment report by the IPCC to limit global warming to less than 1.5°C (with a minimum of 50% probability) with a negligible possibility of exceeding that objective [37]. In the temperature projection part, IPCC scenarios are used. The IPCC scenarios are majorly derived from the MAGICC model [36]. The MAGICC is a less complicated climate system model, which anticipates future climate change and Earth’s component interactions with uncertainty. MAGICC simulates the carbon cycle, methane cycle and anthropogenic aerosol emissions in four boxes representing the Earth’s land and ocean. Hence, climate change, greenhouse gas concentrations, effective radiative forcing, temperature change, Earth system heat absorption and sea-level rise are projected [36]. The drawback with the MAGICC is its set temperature projection limitation, making it difficult to assess the exact estimate values of other constituting factors that influence temperature changes. Also, the MAGICC does not allow for user definitions to ascertain possible feedback based on inputs. Therefore, C-ROAD, with several additional capabilities highlighted in Table 3, has become more pertinent and open-source for user interaction and feedback for policy simulation and decisions.
Capability
Description
Accessibility
The model provides real-time features through a user-friendly graphical interface.
Consistency
The findings of the Intergovernmental Panel on Climate Change’s Fifth Assessment Report (AR5), along with other organisations and knowledge derived from comprehensive models, align consistently with the outcomes of the simulator.
Flexibility
The model can accommodate a diverse range of user-defined scenarios, which can vary in terms of their complexity.
Robustness
The model effectively encompasses the inherent uncertainty around the potential climatic effects that are linked to decisions regarding emissions.
Transparency
There is access to the equations; they may be checked, and they are displayed graphically.
Understanding
The causes of the model pattern’s expression can be identified and traced to real behaviours.
Limitation
No economic assessment considerations, less spatial resolution and less detailed assessment of climate impacts.
Table 3.
C-ROAD model capabilities and limitations.
As already mentioned in sections 1 and 2 of this study, the objective of the study is to simulate different policy measures available and may be required to transit towards the 1.5°C scenario. The goal of this simulation procedure is to ascertain the different NDC composition pathways under the context of climate justice needed by all countries and or regions to reduce emissions. The simulation is done to ascertain the possible reduction value at critical years up to the year 2100. Figure 5 shows a schematic of how the model’s process flow is represented, as embedded in the tool used, which is described in the next section.
4.3 Description of tool used for the study and governing equations
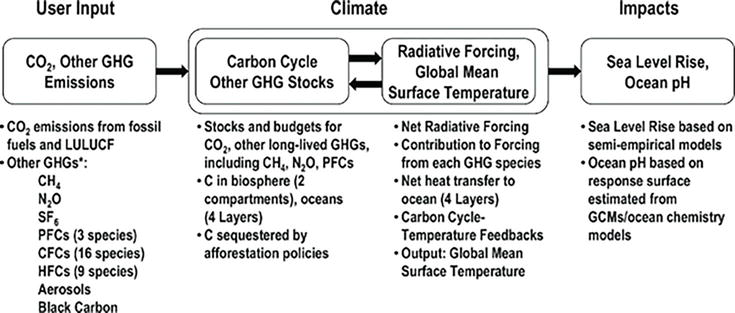
The tool used in this study integrates climate science, economics and policy analysis to develop a comprehensive and reliable simulation framework. Using fundamental principles, C-ROADS is a real-time system dynamics model that allows users to input actions to reduce GHG emissions from land use and forestry. For studying complex systems across time, Jay Forrester developed system dynamics in the 1950s [39]. The system dynamics employs system thinking to analyse the dynamic interplay and feedback between various system components and factors [40, 41]. A system dynamics model’s structure and behaviour may be shown using stock and flow, as in Figure 6 for this study. Users can see the system’s responses through simulations utilising system dynamics models. They also investigate the impact of dynamic complexity on system behaviour and unintended outcomes and can use it to develop a case for business [42], technology, market, carbon dynamics emission [43], strategic scenario forecasting [44] and as a guide for other policy decisions.
Figure 6.
C-ROADS model architecture [45]. Note: Key stocks (carbon cycle and other GHG stocks), key flows (CO2 and other GHG emissions), and feedback (temperature feedback based on carbon cycle from ocean-atmosphere interaction owing to radiative forcing, cooling feedback and heat contents).
The C-ROADS integrates national and regional emission and land use sectors, aiming to understand how national and regional commitments could contribute to climate objectives. It generates findings efficiently and is used to support other integrated assessment models, calibrating results using larger disaggregated models [45]. The capabilities and limitations of the C-ROADS based on the model technical reference in [45] are presented in Table 3.
Figure 6 depicts the C-ROAD architecture for the emissions versus global temperature transition.
The C-ROADS has mainly three phases, as shown in Figure 6. The user input, climate model and the impact phase.
The user input phase allows users to set the year of peak emissions, start reduction and level of effort to prevent deforestation and promote afforestation. The reduction levels are a function of the summation of the aggregate percentages of greenhouse gas emissions. In the second phase, the climate model is a fifth-order linear system with three negative feedback loops that control deep ocean warming (Hd, and Rd), as well as heat content in the atmosphere and surface ocean (Hs, and Rs). Radiative forcing Fr, cooling feedback (Fo, and Fd) and heat content (H and R) all have an impact on the first-order ocean warming response. Based on the climate interactive technical reference in [45], the equation governing the variables can be represented in the Eqs. (1)–(6) as follows:
Ts=HsRsE1
Td=HdRdE2
Hs=∫Frt−Fot−Fdtdt+Hs0E3
Hd=∫Fdtdt+Hd0E4
Where (Ts, and Td) are the surface and deep ocean temperatures, respectively. (Fo, and Fd) are the cooling feedback, outgoing radioactive flux and heat flux to the ocean, respectively.
Fot=λ∗TsE5
Fdt=Rd∗Ts−TdτE6
Where λ and τ are climate feedback parameters and heat transfer constant.
The radiative forcing Fr from CO2 is a logarithmic function of atmospheric CO2 concentration [46,47], while the total Fr, required to quantify CH4 and N2O forcings, is smaller than the sum of the Fr for either gas alone. F-gas forcings are the product of CO2 concentration and radiative forcing coefficient, while other forcings from aerosols and tropospheric ozone are exogenous time-varying parameters. While CO2 concentrations in Eq. (7) are a function of the ratio of atmospheric CO2 concentrations to pre-industrial atmospheric CO2 concentrations.
CO2concentration=CO2atmCO2pre−industrialatmE7
The equilibrium temperature response TE is determined by the radiative forcing coefficient and climate feedback parameters. Therefore, TE is represented in Eq. (8) as follows:
TE=κλ∗InCO2atmCO2pre−industrialatmIn2E8
On running the model, the output shows the temperature changes with the emissions, which can be extracted for further analysis. The last phase, the impact phase, produces the consequence effect of temperature changes on sea level rise with flood risk map, pH level, ocean acidification, crop yield decrease, possible death from extreme heat and animal and plant species loss.
Under full yearly resolution up to 2010, six regions modes were assumed, categorised into China, US, India, EU, rest of advanced countries and the rest of developing countries. Both the techno-economic and socio-economic factors play a role in forecasting CO2 emissions and temperature level changes. The main input variables for estimating emissions in Gigatons per CO2 equivalent and global temperature changes are based on the features of Eqs. (1)–(8).
The model input baseline values of countries and regional generation profiles used are extracted from recent data from the following sources, as stated in Table 4.
The nationally determined contributions (NDC) are extracted from the UNFCCC registry, and with Eq. (9), the emissions reduction rate is determined per annum for the baseline and other scenarios, as in Section 5.4.
Where er is the annual emissions reduction (expressed in percentage), NDC is the national determined contribution for each country i, and n is the number of periods (in years) to fulfil that commitment, starting from the year the NDC was submitted to the UNFCCC under the registry in [13]. The Announced Policies Type 1 emission reduction rate per annum, as calculated, is presented in Table 5.
Category
Country/Region
Annual reduction (%)
NDC (Emissions Reduction Targets)
NDC Target Year
A
China
0.94
65%
2030
A
USA
0.928
50–52%
2030
D
India
0.915
45%
2030
A
Europe
0.903
40%
2030
D
Rest of Advanced Countries (RAC)
NU
—
P/D
A
Rest of Developing Countries (RDC)
NU
—
P/D
Table 5.
Annual emissions reduction based on updated policies of selected top GHG emitters (Announced Policies Type 1, calculated as per eq. (9)).
NU – Non-Uniform, P/D – Partly defined and not same across all the developing and advanced countries.
5.2 Scenario definitions
The definition of the scenarios is presented in Table 6. The different simulation input data in the form of NDC based on each scenario is made as a hypothesis as in Table 6 and described in the Appendix.
Scenarios
Hypothesis
Ref.
Baseline Case
Without NDC
Based on historical country-level data available through [35]
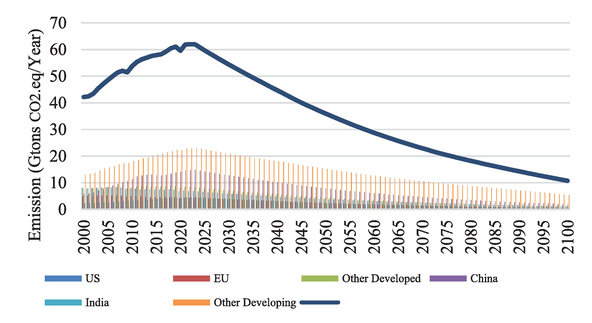
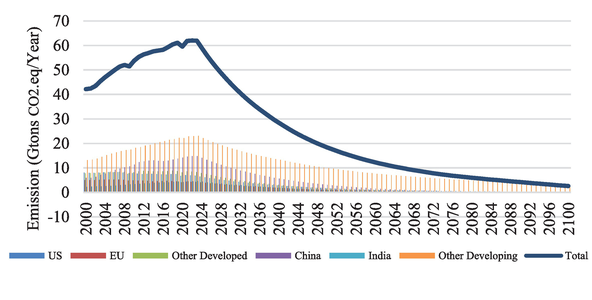
The results of the simulation are presented in this section under two categories: Policy versus global temperature rise in Figure 7 and policy versus emissions in Figure 8. The detailed emissions values per country or region (i.e., USA, EU, Rest of Developed Countries, China, India, and the Rest of Developing Countries) are included in the Appendix, Figures A1–A5 for all the global temperature rises.
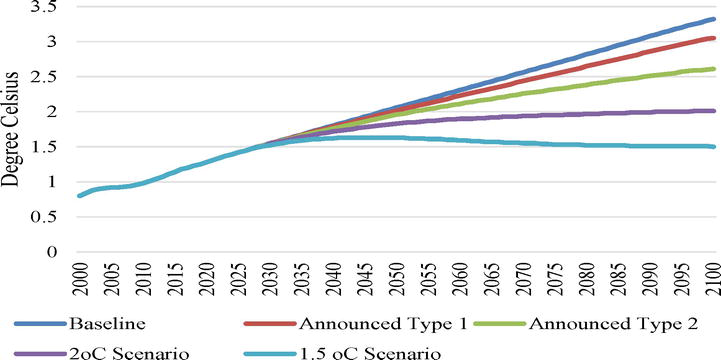
Figure 7.
Different simulated policies versus global temperature rise.
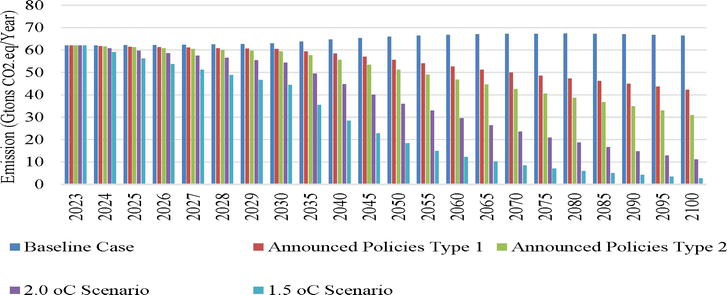
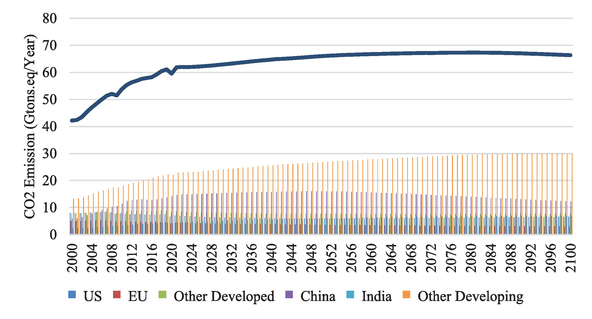
Figure 8.
Different simulated policies versus emission.
The simulation results of the emissions reduction scenarios of Figures 7 and 8 provide insights into how the five scenarios (baseline, announced type 1 and 2, 2 and 1.5°C scenarios) might influence future temperature levels. Simulations show that reducing emissions results in lower temperatures compared to scenarios where emissions continue to rise at the baseline scenarios. The extent of reduction significantly influences the simulated temperature outcomes, with more substantial reductions of 0.9, 2.5 and 6% having a more pronounced impact on limiting global temperature increase to 2.62, 2.0 and 1.5°C, respectively. In all the scenarios, the temperature rises from 2023 till 2100. However, the average annual temperature growth rate is different, with 1.15, 1.04, 0.84, 0.50 and 0.12%, for the baseline, announced type 1 and 2, 2 and 1.5°C scenarios, respectively.
Similarly, the average annual emissions reduction growth rate is −0.09, 0.50, 0.90, 2.28 and 4.12%, respectively. The baseline scenario has a negative emissions reduction growth rate, which implies that emissions may continually be on the increase. Emissions are expected to peak between the years 2070–2080 owing to the envisaged world’s population peak at that time, too; hence, there may be a reduced need for high energy usage in the building and other sectors, resulting in fewer emissions. Ideally, the output of average annual emissions reduction growth rate in, particularly, the announced 2, 2 and 1.5°C scenarios are supposed to be equal to the input emission reduction commitment per annum of 0.9, 2.5 and 6%, respectively. However, this is not the case with the simulation results as the model considers other factors, such as the population-economic growth dynamics of countries. Also, the world economic growth measured in annual GDP growth rate is expected to decrease, based on the OECD data for real GDP forecast [48]. The economies of industrialised nations, such as China, are expected to peak, while those of the developing nations may continue to rise as they transition into being industrialised and with more accessibility to electricity for all population. These dynamics resulted in discrepancies between emission reduction commitment and the output of the average annual emissions reduction growth rate in the announced 2, 2 and 1.5°C scenarios. The cost of delaying the decision to reduce emissions is not to be overlooked as the consequences outweigh the immediate cost of action.
Given a short time interval between 2023 and 2030, the average annual temperature growth rates are 1.76, 1.67, 1.67, 1.67 and 1.48%, while the average annual emissions reduction growth rates are 0.03, 0.06, 0.17, 0.43% for the baseline, announced type 1 and 2, 2 and 1.5°C scenarios, respectively. The percentage changes within a short time series appear very little compared with the case of the long-term difference, even with the large emission reduction commitments. This is in line with the work by L. A. Gil-Alana [14], which has shown that global temperature changes are hardly noticeable until a long-term span. The degree of uncertainty in determining how much temperature rise can be ascertained in the short term is owing to many variables that result in these changes. Some of these variables could be attributed to various factors such as carbon cycle dynamics, complex interactions and other uncertainties such as future human behaviour in terms of the release of anthropogenic gases, technological advancements and natural system responses.
Overall, simulations consistently show that reducing emissions is crucial for mitigating global temperature rise, with even moderate reductions of 0.9% in the announced type 1 scenario slowing the pace of temperature rise.
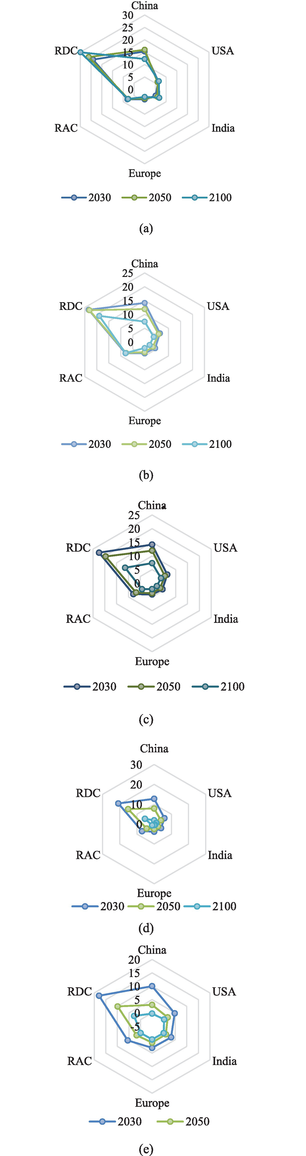
Figure 9 shows the results of all five scenarios in the years 2030, 2050 and 2100 for the different countries and regions where the commitments were made. In the baseline scenario of Figure 9(a), only the EU shows emission reduction to 4.06, 3,63 and 3,03 Gtons CO2 eq in the years 2030, 2050 and 2100, respectively. At the same time, China showed a continuous increase to 15.98 Gtons CO2 eq in 2050 from the 15.29 Gtons CO2 eq value of 2030, with a corresponding reduction to 12.25 Gtons CO2 eq by 2100. The rest of the advanced countries showed a value of 8.4 and 7.67 Gtons CO2 eq in 2030 and 2050, respectively, with an increase to 7.76 Gtons CO2 eq by 2100. For the USA, India and the rest of developing countries, emissions value continually increased across the baseline scenario. In the rest of the other four scenarios, as in Figure 9(b)–(d), all six regions show progress in emissions reduction due to the introduction of policies to support emissions reduction. However, the results show an envisaged high growth in emissions value of the rest of developing countries. This change is an indication of the anticipated high growth in industrialisation and increase in energy accessibility across developing countries, being a part of the UN Sustainable Development Goal (SDG) 7 of providing clean and modern energy for all. Though substantial progress has been made in this regard, there is still a huge gap in the population’s access to electricity in developing countries. For instance, only about 60% of Africa’s population has access to electricity [49] and yet, there is also an increasing population growth compared with the other regions or nations [50]. Therefore, in closing this gap while reducing the probability of high emissions from this form of industrialisation, energy from renewable sources should be highly utilised as this could drastically reduce further emissions from the power sector. Mitra S. et al. [51] emphasised the importance of such energies to be affordable towards increasing universal accessibility. The issues and challenges to achieving these are numerous and diverse, with the key ones being discussed by Akpan J. et al. in [26] and Batinge B. et al. in [52] providing a roadmap for reducing energy poverty in African electricity markets.
Figure 9.
Summary of simulation results at strategic period across countries/regions’ (all scenarios). (a) Baseline scenario; (b) announced policy type 1; (c) announced policy type 2; (d) (d) 2.0°C scenario; (e) 1.5°C scenario.
Consequently, considering climate justice, the NDC initiative proposed during COP26 is left in the hands of each country to determine its contribution to the global value in the drive to meet the UN SDG 2030 target. The results from sections 6.1 and 6.2 indicate that in the baseline case, the announced policies, types 1 and 2, are insufficient to mitigate global warming and climate change effects. Whereas, in the other two scenarios (i.e., 1.5 and 2.0°C scenarios), the world needs to increase its current NDC of emissions reduction by about 6.5% and 2.5%, respectively, and concurrently across the six regions used in the hypothesis of this study has been defined in Table A1. In this way, reduction commitments can be. However, this measure is not without a challenge. The next section presents a discussion on this constraint and then proposes potential pathways that could help overcome the challenge with the strategy of equal percentage reduction commitment.
6.2 The way-forward
The recent turnout from each country for the submission of her NDC has been poor; for instance, to reduce emissions in accordance with the Paris Agreement, ten nations updated their nationally determined contributions (NDCs) in 2022. Of the 195 nations that have ratified the Paris Agreement, just about 30 have nevertheless set clear goals for achieving net-zero emissions [13]. While regulatory policy announcements remained the same, there were around 80 new renewable energy programmes made on the demand side. Eight announcements came from Latin America and the Caribbean, seven from Asia, four from Africa, two from Oceania and just one each from North America, the Middle East and North Africa. Most announcements came from Europe. At the end of the year 2022, 94 countries either had goals or policies in at least one end-use sector, but only three (Spain, Portugal and Turkey) had plans or objectives in all four end-use categories [13].
It is well understood that the complexity of ascertaining NDC is high, as it requires many sectors’ inputs and data. For many countries, arriving at this data that presents the peculiar situation of the country is more cumbersome and would also involve regulation of existing energy policies and regulatory frameworks. Commitment to research findings in preferring holistic pathways in addressing these current issues is very timely. It cannot be overemphasised as many governments and international organisations are actively looking out for the best measures to facilitate the 100% RE vision, UN SDG and climate change agenda of 2030.
Accurate data and long-term estimates of energy demand, the need to create adaptable and responsive market and regulatory frameworks, international collaboration and coordinated activities are mostly highlighted as the necessary strategies to decarbonise the current global systems. In this study, we emphasise just and fair sharing as an important consideration for developing strategic emissions reduction, energy and climate policy for progressive achievements through planning and implementation. Hence, leaving no room for prejudice in the sharing. For instance, this reduction measure employed in this study to achieve the 2.0 to 1.5°C scenarios was fairly shared among the regions and countries used in the simulation.
Suggested in Table 7 below are other possible areas that can help have a more responsive NDC needed to facilitate the rapid deceleration of global emissions increase and to stay within the right temperature rise threshold.
This initiative should be aimed at replacing the current pattern of NDC global stock-taking in a 5-year interval. Rather, stock-taking should be a 2-year interval carried out at the regional or continental level, at least twice before the main global forum. This way, countries’ efforts are measured earlier, and appraisal for immediate support in the continuous reduction of emission synonymous with the requirements for the 1.5°C - 2.0°C Scenario is done well in time. This initiative acknowledges the efforts of a few countries that have made the commitments. But because this commitment is made at the will of individual countries, there is bound to be a possibility of no prioritisation of commitments. Therefore, finding the right emissions reduction sharing ratio that considers other factors such as developmental issues, renewable resource constraints and the economic situation of developing countries is pertinent.
Reducing the CO2 emissions per wealth class per population
The wealthiest individuals and highest-income nations produce a disproportionate amount of the world’s CO2 emissions. In order to reduce emissions, both high-income individuals and rapidly expanding places should be the focus, with each group’s unique challenges and opportunities being carefully taken into account. This initiative should be driven by a global effort that takes these complex dynamic issues, such as behavioural changes in the emissions disparities, into account to ensure a just and fair decrease in CO2 emissions.
Equality with the Drivers of Climate Change Acts and Decisions
This initiative is poised towards the inclusiveness and even appropriation of global climate decision makers as most key representation of climate change decisions is made from a selected few and from countries not representing full global coverage representation.
Emissions Budgeting Framework for Attractiveness of Investment Towards 1.5°C
To meet the 1.5°C objective and reduce global emissions, a huge financial investment commitment is required. In addition to government and public support, private investment is highly required. To ensure that financial commitment in this region is attractive, an emissions budgeting framework is important. This budgeting framework should allow the predictability of carbon emissions cost per investment options, mitigate high-carbon asset risks, align with global climate goals and induce green capital through carbon pricing and tax incentives. Organisations can commit to decarbonisation since clean technology investment and climate action are promoted via low-carbon technology innovation. Hence, promoting social and environmental responsibility, as well as increasing stakeholders and public support. With this approach, the investing community can help create a more sustainable and climate-resilient future.
Table 7.
The way forward in reaching the 1.5°C - 2.0°C scenario.
To help reduce carbon emissions, policy alternatives are continuously being widened to preserve the environment and improve society are complementary goals. The claims in [53, 54] show that Africa generally has historically had a small impact on global warming in terms of countries’ contribution to global CO2 and GHG emissions. But these assertions cannot be used to justify continuing to pollute at current rates for these countries. Why? Because the consequence effect does not exclude fewer CO2 emitters, as the impact can be direct or indirect. Africa, today, can make huge technological leaps that would contribute to flattening the curves to net-zero emissions by pushing into policies, research and implementation of projects from renewable energy sources to meet each country’s electricity consumption.
The EU NDC commitment, done at a regional level [55], with noticeable progress even with the advent of the recent Russia – Ukraine war that kept the EU’s energy dependence on imports at a disadvantaged position, proves the resiliency of the EU towards the NDC emissions goal. The EU has had a joint effort to reduce GHG emissions, being evidenced in their NDC proposal. In the coming years, the bulk of the emission is envisaged to come from developing countries due to the anticipated increase in energy access by the population and the growing industrialisation agenda.
Therefore, it is pertinent to consider ways of both managing and mitigating this emission through a determined commitment at a centralised level. The current NDCs are done in a decentralised pattern, leaving the individual countries with a wavering will and dwindling decision over the implementation of announced strategies.
From the perspective of this study, it is believed that the most effective way of reducing emissions without impeding other developmental agendas could be best done through a just fair approach yet at a regional commitment level. Furthermore, most developing countries are energy poverty-driven yet full of one of the world’s largest renewable energy resources; therefore, in the commitment to reaching the 1.5°C scenario, this inequality in energy access should be accounted for in any further NDC commitment, proposed pathways in Table 7, and climate science models, as these are often overlooked in many existing frameworks. Hence, this study emphasises the unity in diversity towards reducing emissions burden and mitigating climate change.
There is a lot of technical and political depth to the current conversation on how to evaluate a country’s NDC progress towards the 1.5°C scenario. This complexity makes it challenging to have a central consensus on the ‘rightʼ or ‘objectiveʼ technique to follow. Many models and climate systems have been developed to provide platforms to determine the effects of the current practices on global warming and climate change. The challenges with the complexity of these existing tools have been supported by the introduction of feedback loops to allow for the simulation of the different actions that can either enhance or mitigate the impacts of climate change. In this study’s simulations, feedback processes are incorporated in the simulation tool used, which accounts for uncertainties already established by existing complex integrated assessment models. The process involves studying variables such as greenhouse gas emissions, energy consumption patterns, technological deployment, land use changes and policy adoption. Key components include implementing significant reductions in greenhouse gas emissions, transitioning to sustainable energy sources, implementing renewable energy infrastructure and implementing carbon reduction technologies. All these processes were assumed to have been accounted for in the NDC reduction percentages used in this study. The model considers data from historical emissions, current NDC commitments, technological advancements and socio-economic factors.
The findings from this study promote the initiatives of the intergovernmental panel on climate change (IPCC) reports to keep the global temperature level below 1.5°C and suggest that the comprehensive adoption and serious commitment towards NDCs of reducing emissions at about 2.5 and 6.0% can significantly mitigate global temperature rise to 2.0 and 1.5°C, respectively as against the current practices. The overall results produced projections of Earth’s climate responses to temperature changes based on the emissions values at the strategic periods, as shown in Figure 9 from each policy scenario could help governments, corporations and communities make informed decisions regarding mitigation techniques, adaptation measures and policies to limit global temperature rise to 1.5°C. The findings and perspectives presented in Section 6, with the proposed pathways in Table 7, provide valuable insights for policymakers, stakeholders and the broader scientific community, offering a strategic framework for improving NDCs, fostering international collaboration and bolstering global commitment to tackling climate change complexities.
The authors are grateful to the Durban University of Technology for funding the manuscript’s APC and the grant provided under the PG RFA-Energy research theme.
The first author conceptualised, investigated, analysed and developed the manuscript, while the second author supervised, reviewed and validated the manuscript.
Global CO2 emissions with announced policies type I.
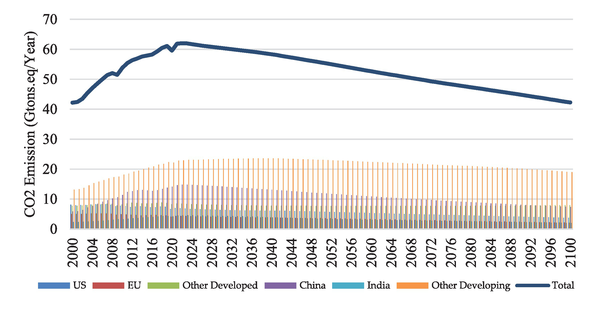
Figure A3.
Global CO2 emissions with announced NDC policies type 2.
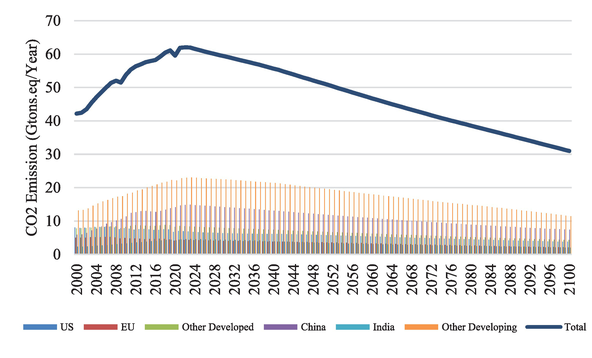
Figure A4.
Global CO2 emissions with 2.0°C scenario.
Figure A5.
Global CO2 emissions with 1.5°C scenario.
References
1.UNFCCC. Nationally Determined Contributions (NDCs). Available from: https://unfccc.int/NDCREG. [Accessed: May 24, 2023]
2.den Elzen MGJ et al. Updated nationally determined contributions collectively raise ambition levels but need strengthening further to keep Paris goals within reach. Mitigation and Adaptation Strategies for Global Change. 2022;27(6):33. DOI: 10.1007/s11027-022-10008-7
3.Koven CD, Sanderson BM, Swann ALS. Much of zero emissions commitment occurs before reaching net zero emissions. Environmental Research Letters. 2023;18(1):014017. DOI: 10.1088/1748-9326/acab1a
5.Grigoroudis E, Kanellos F, Kouikoglou V, Phillis YA. The challenge of the Paris agreement to contain climate change. Intelligent Automation and Soft Computing. 2018;24(2):319-330
6.Jung TY, Park C. Estimation of the cost of greenhouse gas reduction in Korea under the global scenario of 1.5°C temperature increase. Carbon Management. 2018;9(5):503-513. DOI: 10.1080/17583004.2018.1476587
7.Vakilifard N, Williams RG, Holden PB, Turner K, Edwards NR, Beerling DJ. Impact of negative and positive CO2 emissions on global warming metrics using an ensemble of earth system model simulations. Biogeosciences. 2022;19(17):4249-4265. DOI: 10.5194/bg-19-4249-2022
8.Dai H, Xie Y, Zhang H, Yu Z, Wang W. Effects of the US withdrawal from Paris agreement on the carbon emission space and cost of China and India. Frontiers in Energy. 2018;12(3):362-375. DOI: 10.1007/s11708-018-0574-y
9.IEA. Greenhouse Gas Emissions from Energy Highlights. Paris, France: IEA; 2022. Available from: https://www.iea.org/data-and-statistics/data-product/greenhouse-gas-emissions-from-energy-highlights. [Accessed: August 24, 2023]
10.Morfeldt J et al. Emission pathways and mitigation options for achieving consumption-based climate targets in Sweden. Communications Earth & Environment. 2023;4(1):342. DOI: 10.1038/s43247-023-01012-z
11.van den Berg NJ et al. Implications of various effort-sharing approaches for national carbon budgets and emission pathways. Climatic Change. 2020;162(4):1805-1822. DOI: 10.1007/s10584-019-02368-y
12.Patrick P et al. Greenhouse gas emission budgets and policies for zero-carbon road transport in Europe. Climate Policy. 2023;23:343-354. DOI: 10.1080/14693062.2023.2185585
13.UNFCCC. Nationally Determined Contributions (NDCs). New York, United States: UNFCCC; 2020. Available from: https://unfccc.int/NDCREG. [Accessed: July 7, 2023]
14.Gil-Alana LA, Monge M. Global emissions and global temperatures: Are they related. International Journal of Climatology. 2020;40(15):6603-6611. DOI: 10.1002/joc.6601
15.Wang X, Lo K. Just transition: A conceptual review. Energy Research and Social Science. 2021;82:102291. DOI: 10.1016/j.erss.2021.102291
16.Heffron RJ, McCauley D. What is the ‘just transition? Geoforum. 2018;88:74-77. DOI: 10.1016/j.geoforum.2017.11.016
17.Stevis D, Felli R. Planetary just transition? How inclusive and how just? Earth System Governance. 2020;6:100065. DOI: 10.1016/j.esg.2020.100065
18.Ritchie H, Rosado P, Roser M. Greenhouse Gas Emissions. Oxford, England: Our World Data; 2023. Available from: https://ourworldindata.org/greenhouse-gas-emissions
19.Jones MW, Peters GP, Gasser T, et al. National contributions to climate change due to historical emissions of carbon dioxide, methane, and nitrous oxide since 1850. Scientific Data. 2023;10:155. DOI: 10.1038/s41597-023-02041-1
20.Lindsey R, Dahlman L. Climate Change: Global Temperature [Online]. New York, United States: National Oceanic and Atmospheric Administration (NOAA); 2023. Available from: https://www.climate.gov/news-features/understanding-climate/climate-change-global-temperature. [Accessed: June 22, 2023]
21.UN. KYOTO Protocol to the United Nations Framework Convention on Climate Change [Online]. New York, United States: UN; 1998. Available from: https://unfccc.int/process-and-meetings/the-kyoto-protocol/history-of-the-kyoto-protocol/text-of-the-kyoto-protocol. [Accessed: October 24, 2023]
22.Kirschbaum MUF. Climate-change impact potentials as an alternative to global warming potentials. Environmental Research Letters. 2014;9(3):034014. DOI: 10.1088/1748-9326/9/3/034014
23.Ritchie H. Who has contributed most to global CO2 emissions? 2019. Available from: https://ourworldindata.org/contributed-most-global-co2. [Accessed: July 18, 2023]
25.Akpan J, Olanrewaju O. Sustainable energy development: History and recent advances. Energies (Basel). 2023;16(20):7049. DOI: 10.3390/en16207049
26.Akpan J, Olanrewaju O. Towards a common methodology and modelling tool for 100% renewable energy analysis: A review. Energies (Basel). 2023;16(18):6598. DOI: 10.3390/en16186598
27.Ritchie H, Roser M, Rosado P. Our World in Data. Renewable Energy. 2023. Available from: https://ourworldindata.org/renewable-energy. [Accessed: May 22, 2023]
28.IEA. World Energy Investment 2023 [Online]. Paris, France: IEA. Available from: https://iea.blob.core.windows.net/assets/8834d3af-af60-4df0-9643-72e2684f7221/WorldEnergyInvestment2023.pdf; 2023. [Accessed: September 25, 2023]
29.Daniel R, Yuqi Z, Richard GN, Brian CP, Aaron B. Global Energy Outlook 2023: Sowing the Seeds of an Energy Transition. Washington: Resources for the Future; 2023
30.Government of China. China Nationally Determined Contribution (Reducing Greenhouse Gases in China: A 2030 Emissions Target) [Online]. Beijing, China: Government of China; 2022. Available from: https://unfccc.int/NDCREG. [Accessed: August 28, 2023]
31.World Economic Forum. Green Hydrogen in China: A Roadmap for Progress. Cologny, Switzerland: World Economic Forum; 2023. Available from: https://www.weforum.org/whitepapers/green-hydrogen-in-china-a-roadmap-for-progress. [Accessed: July 31, 2023]
32.Government of USA. The USA Nationally Determined Contribution (Reducing Greenhouse Gases in the United States: A 2030 Emissions Target) [Online]. New York, United States: Government of USA; 2021. Available from: https://unfccc.int/NDCREG. [Accessed: August 28, 2023]
33.Government of India. India’s Updated First Nationally Determined Contribution under Paris Agreement (2021–2030) [Online]. New Delhi, India: Government of India; 2022. Available from: https://unfccc.int/NDCREG. [Accessed: August 28, 2023]
34.Germany (on behalf of Europe). Europe Nationally Determined Contribution (Reducing Greenhouse Gases in the Europe: A 2030 Emissions Target) [Online]. Berlin: Germany (on behalf of Europe); 2021. Available from: https://unfccc.int/NDCREG. [Accessed: August 28, 2023]
35.Climate Interactive. Climate Interactive [Online]. Available from: https://www.climateinteractive.org/. [Accessed: June 14, 2023]
37.IEA. Global Energy and Climate Model Documentation 2023 [Online]. Paris, France: IEA; 2023. Available from: https://www.iea.org/reports/global-energy-and-climate-model. [Accessed: October 28, 2023]
38.IEA. Global Energy and Climate Model-Techno-Economic Inputs [Online]. Paris, France: IEA; 2023. Available from: https://www.iea.org/reports/global-energy-and-climate-model. [Accessed: October 28, 2023]
39.Forrester JW. Industrial Dynamics. Cambridge, USA: Massachusetts Institute of Technology (MIT) Press; 1961
40.Sapiri H, Zulkepli Hew J, Ahmad N, Zainal Abidin N, Hawari NN. Introduction to System Dynamic Modelling and Vensim Software. Kedah, Malaysia: UUM Press; 2017. DOI: 10.32890/9789672064084
41.Mihailovs N, Cakula S. Dynamic system sustainability simulation modelling. Baltic Journal of Modern Computing. 2020;8(1):192-201. DOI: 10.22364/BJMC.2020.8.1.12
42.Cosenz F, Rodrigues VP, Rosati F. Dynamic business modeling for sustainability: Exploring a system dynamics perspective to develop sustainable business models. Business Strategy and the Environment. 2020;29(2):651-664. DOI: 10.1002/bse.2395
43.Pillay NS, Brent AC, Musango JK, van Geems F. Using a system dynamics modelling process to determine the impact of ECAR, EBUS and etruck market penetration on carbon emissions in South Africa. Energies (Basel). 2020;13(3):575. DOI: 10.3390/en13030575
44.Ahmad SA, Tahar RM. Strategic forecasting of electricity demand using system dynamics approach. International Journal of Environmental Science and Development. 2012;3(4):328-333. DOI: 10.7763/IJESD.2012.V3.241
45.Lori SS, Chris C, Tom F, Andrew PJ, Charles J, John S. C-ROADS Technical Reference [Online]. 2023. Available from: support.climateinteractive.org. [Accessed: August 19, 2023]
46.IPCC. AR5 Synthesis Report: Climate Change 2014The Synthesis Report (SYR) of the IPCC Fifth Assessment Report (AR5) [Online]. Geneva, Switzerland: IPCC; 2014. Available from: https://www.ipcc.ch/report/ar5/syr/. [Accessed: October 26, 2023]
47.Lan XKWT, Dlugokencky EJ. Trends in Globally-Averaged CH4, N2O, and SF6 Determined from NOAA Global Monitoring Laboratory Measurements, Version 2023–09. Boulder, Colorado, United States: National Oceanic and Atmospheric Administration; 2022
48.OECD. Real GDP Long-Term Forecast [Online]. Paris, France: OECD; 2023. Available from: https://data.oecd.org/gdp/real-gdp-long-term-forecast.htm. [Accessed: October 26, 2023]
49.Ritchie R, Mispy OO. SDG Tracker-Measuring Progress towards the Sustainable Development Goals [Online]. Oxford, England: Our World in Data; 2023. Available from: https://sdg-tracker.org/energy. [Accessed: June 15, 2023]
50.World Bank. Population [Online]. Washington, D.C., United States: World Bank; 2023. Available from: https://data.worldbank.org/indicator/SP.POP.TOTL?end=2022&locations=DZ&start=2002. [Accessed: October 26, 2023]
51.Mitra S, Buluswar S. Universal access to electricity: Closing the affordability gap. Annual Review of Environment and Resources. 2015;40:261-283. DOI: 10.1146/annurev-environ-102014-021057
52.Batinge B, Kaviti Musango J, Brent AC. Perpetuating energy poverty: Assessing roadmaps for universal energy access in unmet African electricity markets. Energy Research and Social Science. 2019;55:1-13. DOI: 10.1016/j.erss.2019.05.004
53.Tadasse D. The Impact of Climate Change in Africa. Pretoria, South Africa: Institute for Security Studies; 2010. Available from: https://api.semanticscholar.org/CorpusID:17135311 [Accessed: July 30, 2023]
54.Odimegwu F. “An Analysis of Climate Change in Africa”. The Effects of Climate Change in Developing Areas: Assessment of the African Situation [Online]. Mauritius: LAP LAMBERT Academic Publishing; 2020. Available from: https://www.researchgate.net/publication/344070153
55.Wolkinger B et al. Implementing Europe’s climate targets at the regional level. Climate Policy. 2012;12(6):667-689. DOI: 10.1080/14693062.2012.669096
Written By
Joseph Akpan and Oludolapo Olanrewaju
Submitted: 22 October 2023Reviewed: 23 October 2023Published: 22 December 2023