Open Access is an initiative that aims to make scientific research freely available to all. To date our community has made over 100 million downloads. It’s based on principles of collaboration, unobstructed discovery, and, most importantly, scientific progression. As PhD students, we found it difficult to access the research we needed, so we decided to create a new Open Access publisher that levels the playing field for scientists across the world. How? By making research easy to access, and puts the academic needs of the researchers before the business interests of publishers.
We are a community of more than 103,000 authors and editors from 3,291 institutions spanning 160 countries, including Nobel Prize winners and some of the world’s most-cited researchers. Publishing on IntechOpen allows authors to earn citations and find new collaborators, meaning more people see your work not only from your own field of study, but from other related fields too.
Cryptocurrencies have become an attractive asset class for all types of investors. A relevant question is whether their inclusion in portfolios improves their risk-return output. In this chapter, we conduct an empirical study of the effect of the inclusion of Bitcoin and Ethereum in the portfolio of a European investor. Additionally, we analyze the results of previous studies on this question under other assumptions. The empirical data are overwhelming regarding the attractiveness of Bitcoin and by extension other cryptocurrencies as an asset class. The important question is whether this appeal is temporary and will eventually disappear so investors do not have to worry about this new asset class. In the chapter we discuss this issue.
Department of Business Economics, Universidad Rey Juan Carlos, Madrid, Spain
Prosper Lamothe-Fernández
Department of Finance and Commercial Research, Universidad Autónoma de Madrid, Madrid, Spain
Leslie Rodríguez-Valencia
Department of Economy and Business, Universidad Europea de Madrid, Madrid, Spain
*Address all correspondence to: prosper.lamothe@uam.es
1. Introduction
One of the initial issues we must address when analyzing cryptocurrencies as an investment alternative is whether they represent a new asset class. Following Greer [1], asset classes can be classified as shown in Table 1.”
Categorization of traditional asset classes by their superclass
Capital assets
Consumable/transformable assets
Store of value assets
“Ongoing source of something of value…valued on the basis of net present value of its expected returns.”
“You can consume it. You can transform it into another asset. It has economic value. But it does not yield an ongoing stream of value.”
“Cannot be consumed; nor can it generate income. Nevertheless, it has value; it is a store of value asset.”
Equities
X
Bonds
X
Income-producing real estate
X
Physical commodities (e.g., grains or energy products)
X
Precious metals (e g., Gold)
X
X
Currency
X
Fine art
X
Table 1.
Categorization of traditional asset classes by their superclass.
In his analysis, Greer distinguishes three broad categories of asset classes: capital assets, consumable/transformable assets, and store-of-value assets. In Table 1, traditional asset classes are classified within these three categories.
Based on Greer’s work, Burniske and White [2] list the four factors that define the boundaries between different asset classes:
Investment possibilities.
Economic and financial characteristics.
Correlation of returns with other asset classes.
Risk-return trade-off.
Investment possibilities1 refer to the ease and costs involved in buying or selling a particular asset class. These possibilities depend on the liquidity of the instrument, the existence of multiple instruments in the market that allow you to acquire or expose yourself to the asset class, transaction costs in operations, etc.
The liquidity of transactions in Bitcoins and other cryptocurrencies has continually increased since their creation.
On the other hand, investing in cryptocurrencies and/or acquiring exposure to cryptocurrencies is very easy and inexpensive due to the availability of various instruments that allow direct or “virtual” purchase of these assets, such as:
Cryptocurrency-referenced ETFs.
Cryptocurrency-referenced CFDs.
Cryptocurrency investment funds, etc.
Futures and options with cryptocurrencies as underlying assets.
Regarding investment via ETFs, Table 2 shows the characteristics of the most popular ones in the market according to the Bitcoin Market Journal.
ETF name
Ticker
Exchange
Type
Fees (%)
The VanEck Vectors Bitcoin ETN
VBTC
Deutsche Böerse Xetra
Spot
2
The Bitcoin Investment Trust from Grayscale
GBTC (on the OTCQX ticker)
Off-exchange, via registered dealers
Spot
2
XBT Provider ETN
CXBTF
Nasdaq Stockholm Stock Exchange
Spot
2.5
WisdomTree Bitcoin ETP
BTCW
SIX Swiss Exchange
Spot
0.95
CI Galaxy Bitcoin ETF
BTCX
Toronto Stock Exchange
Spot
0.45
Table 2.
ETFS about Bitcoin.
Source: Bitcoin Market Journal
Investment via ETFs has several advantages over direct investment, as proposed by Kaushik [3]. As an illustration of these possibilities, Tables 3 and 4 present the main characteristics of futures contracts on Bitcoin and Ethereum listed on the Chicago Mercantile Exchange (CME).
Contract unit
5 bitcoin, as defined by the CMECF Bitcoin Reference Rate [BRR]
Minimum price fluctuation
Outright: $5.00 per bitcoin = $25.00 per contract Calendar Spread: $1.00 per bitcoin = $5.00 per contract
CME Globex: Sunday–Friday 6:00 p.m. – 5:00 p.m. ET (5:00 p.m. – 4:00 p.m. CT) with a 60-minute break each day beginning at 5:00 p.m. ET (4:00 p.m. CT)
Trading hours
CME ClearPort: 6:00 p.m. Sunday to 6:45 p.m. Friday ET (5:00 p.m. – 5:45 p.m. CT) with a 15-minute maintenance window between 6:45 p.m. – 7:00 p.m. ET (5:45 p.m. – 6:00 p.m. CT) Monday–Thursday.
Product code
Outright: BTC
Listing cycle
Six consecutive monthly contracts inclusive of the nearest two December contracts.
Table 3.
Characteristics of the Bitcoin futures contract. CME.
Contract unit
50 ether
Price quotation
US dollars and cents per ether
CME Globex: Sunday–Friday 6:00 p.m. – 5:00 p.m. ET (5:00 p.m. – 4:00 p.m. CT) with a 60-minute break each day beginning at 5:00 p.m. ET (4:00 p.m. CT)
Trading hours
CME ClearPort: 6:00 p.m. Sunday to 6:45 p.m. Friday ET (5:00 p.m. – 5:45 p.m. CT) with a 15-minute maintenance window between 6:45 p.m. – 7:00 p.m. ET (5:45 p.m. – 6:00 p.m. CT) Monday–Thursday.
Minimum price fluctuation
Outrights: $0.25 per ether = $12.50 per contract Calendar spreads: $0.05 per ether = $2.50 per contract
Product code
ETH
Listed contracts
Six consecutive monthly contracts inclusive of the nearest two December contracts.
Settlement method
Yes, five contracts minimum
Final settlement day
Last Day of Trading is the last Friday of contract month, Trading in expiring futures terminates at 4:00 p.m. London <?> Day of Trading.
Final settlement price
Delivery is by cash settlement by reference to the final settlement price, equal to the CMECF <?> Reference Rate on the last day of trading.
Table 4.
Characteristics of the futures contract on Ethereum.cme.
With regard to the liquidity of operations in Bitcoins, Figure 1 presents the trading volume and open interest data in futures contracts traded in Chicago.
Figure 1.
Open interest and volume of Bitcoin futures contracts.
Many cryptocurrency investors, however, prefer alternative access options to traditional futures, as depicted in Figure 2.
Figure 2.
Open positions on Bitcoin in different instruments. Source: Fireblocks and COINGLASS.
As for the correlation with other asset classes and the risk-return trade-off, in the next section, we will conduct a specific analysis of Bitcoin and its effects on its inclusion in investors’ portfolios.2
The emergence of Bitcoin and other cryptocurrencies and their rapid success as destinations for the investments of hundreds of thousands of investors raises the question of how the inclusion of positions in Bitcoins and other cryptocurrencies influences the risk-return trade-off of a portfolio.
Estimating the profitability of different financial assets in which one can invest is a key consideration in portfolio construction. There are many definitions of the profitability of financial assets, as well as different definitions for each type of asset (fixed income, equities, derivatives, etc.), each with its different valuation methods. Among the more generic and commonly used definitions of the “profitability of a financial asset or security,” we highlight the one that states that the profitability of an asset is “the income generated by an investment, expressed as a ratio or percentage.”
If we consider the time at which the asset is valued, we can distinguish between:
Ex-post or historical return: this is the return obtained once the transaction is liquidated. This return is known with certainty, as the investment has already been settled. It has no risk because the data is known with certainty. There are multiple academic studies that focus on the analysis of this concept of return for a particular class of assets. In this chapter, we will also analyze the historical returns that investors have obtained with their positions in different cryptocurrencies. Obviously, as stated in financial advertising, past returns do not guarantee future returns. In any case, financial doctrine and practice advise us to study these returns as what seems more stable are the performance differentials between asset classes.
Ex-ante or expected return: this is the estimated return before making the transaction and, therefore, the expected return. The expected return is a random variable that will take different values depending on different scenarios in the future. The statistical measure of the expected return is the mathematical expectation, while the variance and, particularly, the standard deviation will measure the risk borne by the investment.
To determine historical returns, we must set the review period, which we will call “t.” In general, the so-called simple return is used as a measure of ex-post return. In this sense, we must reiterate that investors know in advance the return obtained in the past for individual assets. Therefore, the historical return on assets is a magnitude known with certainty.
Generally, the return of asset “i” in the period “t” will be:
Ri=Pt+1−Pt+dtPtE1
Where:
Ri = return or yield of asset “i”.
Pt+1 = selling price of asset “i” at the end of the considered period.
Pt = purchase price of security “i”.
dt = intermediate cash flow received from holding the asset (dividends, coupons, etc.). In the case of cryptocurrency investment, this component is zero.
In our analysis of cryptocurrencies, the analysis period will be daily. From daily data, it is trivial to obtain monthly, annual, etc., return data. From these data, we will obtain annualized data for the different assets considered in our analysis to infer the effect of including cryptocurrencies in a portfolio of risky assets.
The other parameter to consider is the risk of assets and portfolios. The most widely used definition by financial markets is that “the risk of an asset is the degree of uncertainty about obtaining the expected return on its financial investments.” In this definition, it is considered that risk reflects any variation in this return, whether what we obtain is higher than expected or lower.
There are many ways to assess these potential variations in the return of an asset, with variance being the most commonly used statistical measure. Variance is a measure that expresses the sum of the squares of the deviations of the return of a security from its expected return or its historical return. In our analysis, we will estimate it based on historical data, so we will obtain an estimate of historical volatility.
The most used measure in finance as a risk measure is the standard deviation, which is the square root of the variance and is known in markets as volatility. It is a statistical measure expressed as a percentage and therefore comparable to the other measure we will use, such as return. We refer to this measure as “absolute volatility” because it indicates in absolute value the dispersion of the data that has led to historical returns.3 If we extend the calculation of these concepts to a portfolio, the return and risk of a combination of assets are obtained by the following formulas:
Rp=X1pR1+X2pR2+…+XnpRn=ΣXipRiE2
Where:
Rp = certain return or yield of Portfolio P.
X1p, X2p, …, Xnp = percentage distribution of Portfolio P.
R1, R2, …, Rn = certain returns obtained from each security in Portfolio P.
And for risk,
σp2=ΣXipXjpσij=ΣX1p2σi2+ΣXipXjpσijE3
(For all i different from j)
Where:
X1p, X2p, ..., Xnp = weight of each asset in Portfolio P.
σij = covariance between the returns of asset i and asset j. Therefore, σi2 is the variance of the returns of asset i.
It can be observed that the risk of a portfolio is the sum of the risks of individual assets weighted by their squared weight, plus the sum of the product of the weights of each pair of assets multiplied by their covariance. We know that covariance is equal to:
σij=σi.σj.ρijE4
Where:
σi is the standard deviation of security i
ρij is the correlation coefficient between i,j
In this breakdown of the covariance calculation, we see the importance of the correlation between the returns of assets in the diversification of portfolios. This idea already appears in the early works of the Modern Portfolio Theory, initiated by Markowitz [7].4 In the field of finance professionals, the importance of seeking uncorrelated profitable assets to build portfolios began in the 1970s when knowledge of the Modern Portfolio Theory began to spread. The quest for low correlation explains the trends of:
Internationally diversifying portfolios since the 1970s.
Investing in commodities-linked instruments since the 1990s.
The growing interest of professional investors in “absolute return” investments such as hedge funds since the late 1990s.
As we will explore and analyze, Bitcoin and cryptocurrencies have had a very low or even negative correlation in certain periods with traditional asset classes. This explains why, for many investors guided by quantitative asset management models, this new asset class is very interesting, and they begin to incorporate it into their portfolios.
On the other hand, we should note that most empirical analyses conducted on the effect of including Bitcoin in portfolios use the original version or modified versions of the so-called Markowitz model [7]. Therefore, we believe it is useful to conduct a brief analysis of this model, the cornerstone of Modern Portfolio Theory.
The main contribution of H. Markowitz is to have incorporated into his model the fundamental characteristics of the “rational behavior of the investor,” consisting of seeking a portfolio distribution that maximizes returns for a certain level of risk or minimizes risk for a specific return. This process is called the search for efficient portfolios.
The investor has to choose a specific return-risk combination, depending on whether they prefer to achieve more profits by taking on higher risk or by being exposed to lower risk with less profit. The return or yield of the portfolio that an investor expects to obtain in the future is measured, as explained earlier, by the mathematical expectation of the portfolio’s return. Risk is measured by the standard deviation or standard deviation of expected returns.
H. Markowitz’s model is also known as the Mean-Variance Decision model. In this context, H. Markowitz’s fundamental objective was to graphically and analytically demonstrate (linear programming) the relationship between investor expectations (their attitude toward risk) and the choice of an optimal portfolio, always taking into account the two parameters of expected return and risk existing in the market.
The Markowitz model is based on the following assumptions:
The return of any asset or portfolio is a subjective random variable, whose probability distribution for the reference period is known by investors. The expected return of the investment is accepted as the measure of the expected return of this random variable.
ERp=X1pER1+X2pER2+…+XnpERn=ΣXipERiE5
Where:
X1p, X2p, ... , Xnp = weight of each asset in Portfolio P.
E[Rp], E[R1] ............ E[Ri] = expected return of the portfolio, asset 1, asset i
The measure of risk is the dispersion of returns, measured by the variance or standard deviation, of the expected return, whether of an individual asset or a portfolio.
σp2=ΣX1p2σi2+ΣXipXjpσijE6
Where:
X1p, X2p, ... , Xnp = Weight of each asset in Portfolio P.
σij = Covariance between the returns of asset i and asset j. Therefore, σi2 is the variance of the returns of asset i.
The investor’s utility function is a function only of the expected return and risk, provided there is rationality in the investor’s economic decision-making:
U=ƒERpσp2E7
The investor’s behavior leads them to prefer portfolios with higher returns and lower risk. Investors prefer to maximize the return on their investment and minimize the risk they must bear. Moreover, as the expected return of the portfolio increases, the utility for the investor increases, and as the risk increases, the utility for the investor decreases.
These three hypotheses or basic assumptions are the basis of H. Markowitz’s theory, and they are fulfilled when the probability distribution law followed by the random variable Rp is completely defined by these assumptions or when the investor’s utility function is a quadratic function.5
Markowitz’s goal with his model was to define and obtain the best portfolio or optimal portfolio for each investor. The optimal portfolio is the best one among all that can be formed considering the expected returns of the market and their attitude or aversion to risk. Therefore, the optimal portfolio for one investor may not be optimal for another.
To solve the problem of obtaining efficient portfolios, Markowitz uses a parametric linear optimization model, which can be formulated in two different ways:
(a) For a given value of risk, maximize the expected return:
MaximizeERp=X1pER1+X2pER2+…+XnpERn=ΣXipERiE8
The constraints are:
Parametric constraint: the assumed risk
σp2=ΣX1p2σi2+ΣXipXjpσij=V∗E9
where V* is the value of risk the investor is willing to assume.
The result for each value of V* (assumed risk) is a portfolio composition (x1p, x2p, ... , xnp), which, when substituted into the objective function, provides the maximum expected return for that level of risk. Each assumed level of risk will provide a different portfolio composition (x1p, x2p, ... , xnp) that is efficient. Thus, the set of efficient portfolios will form the efficient portfolios frontier, commonly called the “efficient frontier.”
The optimization procedure can be done with a second approach:
(b) Given a certain expected return level, minimize the risk for that return:
Minimizeσp2=ΣX1p2σi2+ΣXipXjpσijE12
The constraints are:
Parametric Constraint: The expected return of the portfolio.
ERp=X1pER1+X2pER2+…+XnpERn=ΣXipERi=E∗E13
Where E* is the expected return the investor wants to achieve, and thus the optimization problem must be solved with it.
Investment budget constraint
X1p+X2p+…+Xnp=1E14
Non-negativity condition
X1p;X2p;…;Xnp≥0E15
The result for each value of E* is a portfolio composition (X1p+ X2p+ ... + Xnp), which, when substituted into the objective function, provides the minimum risk of the portfolio for that specific level of return. The set of efficient portfolios will form the efficient frontier.
A portfolio is said to be efficient if there is no other portfolio that provides a higher return for the same level of risk or that provides a lower risk for the same return. Such portfolios are graphically located at the upper end of the possible portfolio space so that the set of all efficient portfolios forms a curve commonly called the “efficient frontier.” The efficient frontier has a parabolic shape, as seen in Figure 3.
Figure 3.
Graphical representation of the efficient frontier in portfolio analysis.
The analysis of the positive effects that cryptocurrencies, such as Bitcoin, can have on investors’ portfolios must objectively determine, based on optimization models, whether this asset class should be present in the composition of efficient portfolios. As we will discuss, this has already been investigated by various authors who generally conclude that cryptocurrencies improve (shift upward and to the left) the efficient frontier for investors.
3. Analyses have been conducted on the diversification effects in Bitcoin and cryptocurrency portfolios
In Gangwal [11], one of the initial analyses of the positive effects of introducing Bitcoin into portfolios7 is found, conducted at a simple and introductory level. One of the most comprehensive pioneering studies on the effects of including Bitcoin in a portfolio of financial assets was conducted by Katjazi and Moro [13], using monthly data from January 31, 2012, to January 31, 2017. The asset classes used in the analysis are listed in Table 5. The selected asset classes include gold, equities, fixed income, money markets, commodities, real estate, and even alternative investments through a hedge fund index. These authors approach the analysis of the effect of including Bitcoin from the perspective of an investor based in the USA, the eurozone, or China.
Name
Mnemonic
Asset class
United States
BTC-USD-Index
billus
Cryptocurrency
S&P U.S. TREASURY BILL INDEX
billus
Money Market
S&P U.S. TREASURY BOND INDEX
condus
Fixed-income
DOW JONES EQUAL WEIGHTS U.S. ISSUED CORPORATE BONDS
corpus
Fixed-income
S&P WCI GOLD (ER)
gold
Gold ETF
S&P 100
sp100
Equity (large cap)
S&P 500
sp500
Equity (mid cap)
S&P 600
spsml
Equity (small cap)
S&P WCI
wcig
Commodities
DOW JONES U.S. REAL EASTATE INDEX
resus
Real Estate
Global hedge fund index
hfrx
Alternative
Dow Jones FXCM Dollar Index
usdollar
Currency
Europe
BTC
btceur
Cryptocurrency
S&P Pan-Europe Developed Sovereign Bond Index
condeu
Fixed-income
S&P Eurozone Investment Grade Corporate Bond Index
corpeu
Fixed-income
S&P WCI GOLD (ER)
gold
Gold ETF
S&P EUROPE 350
sp350eu
Equity
S&P WCI Europe
wcie
Commodities
Dow Jones Europe Select Real Estate Securities Index
reseu
Real Estate
Global hedge fund index
hfrx
Alternative
S&P EURO Futures Index Spot
speuf
Currency
China
BTC-CNY-Index
btccny
Cryptocurrency
S&P CHINA GOVERNMENT BILL INDEX
billcn
Money Market
S&P CHINA SOVEREIGN BOND INDEX
condcn
Fixed-income
S&P CHINA CORPORATE BOND INDEX
corpcn
Fixed-income
S&P WCI GOLD (ER)
gold
Gold ETF
S&P CHINA A 100 INDEX (RMB)
spc100
Equity (large cap)
S&P CHINA A 200 INDEX (RMB)
spc200
Equity (mid cap)
S&P CHINA A SMALLCAP INDEX (RMB)
spcsml
Equity (small cap)
S&P WCI ASIA
wcia
Commodities
Guggenheim China Real Estate ETF (TAO)
tao
Real Estate
Global hedge fund index
hfrx
Alternative
USDCNY Exchange rate (holding USD as investment)
usdcny
Currency
Table 5.
Asset classes used in the study by Katjazi and Moro.
Additionally, they propose four optimization scenarios using the Markowitz approach discussed earlier:
Equitably distributing the portfolio among the various possible asset classes. This alternative does not aim to identify an optimal investment portfolio but to verify whether, in the case of Bitcoin, what was stated by Demiguel et al. [14] holds true—that an equally weighted portfolio behaves similarly to an optimized portfolio in terms of mean-variance, using the well-known Sharpe performance ratio. This ratio, developed by Nobel laureate economist Sharpe [15], is defined by the expression:
S=R−RfσE16
Where:
S: is the Sharpe ratio.
R: is the portfolio/asset return to be analyzed.
Rf: is the risk-free asset return.
σ is the standard deviation of portfolio returns.
All weights in the portfolio are positive, meaning no short positions are allowed in any asset class.
Short positions are allowed without leverage, meaning all weights wi must be between −1 and 1, and the sum must equal unity. In this case, the possibility of leverage on assets is restricted.
Short positions are allowed with the rule of the previous alternative, except for Bitcoin, which cannot be included as a short position.
For the three economic areas considered in the analysis, Bitcoin appears as the most profitable asset class. Additionally, they propose an analysis where the portfolio is reviewed monthly to dynamically analyze the effect of Bitcoin on portfolios. In Table 6, we present, for simplicity, only the results for the European investor. It can be verified that, in an optimized portfolio, particularly in portfolios without leverage and without short positions, Bitcoin becomes a relevant asset for Eurozone investors.
Semi-annual BTC weights
Portfolio
Long-only (%)
Semi-C. (%)
btc > l (%)
Jun-13
35.46
11.52
11.52
Dec-13
17.53
6.82
6.82
Jun-14
16.25
1.39
1.39
Dec-14
0.28
0.01
0.01
Jun-15
0.00
−2.02
0.00
Dec-15
55.05
−2.37
0.00
Jun-16
26.15
1.26
1.26
Dec-16
56.31
1.71
1.71
Bitcoin mean
25.88
2.29
2.84
Table 6.
Dynamic inclusion of Bitcoin in the portfolio of a European Investor.
Although there are a couple of months where the optimized portfolio takes short positions in Bitcoins, in general, a positive exposure is always adopted. The conclusions of the analysis are as follows [13]:
The inclusion of Bitcoin improves the profitability of portfolios in most cases.
Only in some cases of optimization from the perspective of U.S. and Chinese investors does the inclusion of Bitcoin worsen the profitability of portfolios. According to these authors, this happens in 3 out of the 21 scenarios analyzed.
Subsequently, Bakry et al. [16] conducted a very interesting analysis from the perspective of an American investor, using variables similar to those in the study by Katjazi and Moro [13] and adding others such as the Baltic Exchange Dry Index (BDI), considered a good indicator of real economic activity, and an index linked to the energy sector, DJUBENS (Dow Jones-UBS Energy Spot Subindex). The time period used to build the database was from August 2011 to May 2021 with weekly observations, which means using 508 observations for each variable.
Their analysis approach starts with the typical mean-variance optimizer proposed by Markowitz [7], using the Sharpe ratio as the variable to maximize. The conclusion these authors reach is that Bitcoin represents an asset class with a positive diversification effect in portfolios. This is because the risk-return or performance8 combination of portfolios that include this cryptocurrency is better than that obtained with portfolios without the cryptocurrency.
Additionally, the study by Kim [17] also confirms the positive effects of including cryptocurrencies in investor portfolios.
Finally, we must refer to the study by Liu [18], which analyzes the characteristics for investors of portfolios composed only of cryptocurrencies. Obviously, it does not make sense for an investor to only invest in crypto-assets, but analyzing the diversification effects within this investment universe is useful. The data used in the study includes daily prices from August 7, 2015, to August 8, 2018.
In Figure 4, we present the correlation matrix between the returns of the cryptocurrencies included in the analysis. Interestingly, the correlations are not very high, so if this characteristic holds over time, the diversification benefits among cryptocurrencies will be notable.
Figure 4.
Correlations between cryptocurrency returns. Source: Liu [18], p. 202.
Based on these data and those related to the performance and volatility of the different cryptocurrencies analyzed, Liu [18] constructs an efficient frontier for this asset class, which we reproduce for its interest in Figure 5.
Figure 5.
Efficient cryptocurrency frontier. Source: Liu [18], p. 203.
As observed in Figure 5, neither Bitcoin nor Ethereum is on the efficient frontier, implying that there are theoretical potential benefits for investors who explore the possibilities of other cryptocurrencies present in the market.
It is also true that expanding the range of investment assets to lesser-known cryptocurrencies dramatically increases the risk of fraud, operational risks, liquidity risk, etc., issues that cannot be adequately captured by quantitative portfolio optimization models.
On the other hand, Lotho et al. [19] analyze the effects of including crypto assets in a portfolio of a South African investor, an example of an investor based in an emerging market. The results are spectacular, as shown in Figure 6.
Figure 6.
Effects of including crypto assets for a South African investor. Source: Lotho et al. [19].
The blue line represents the efficient frontier using traditional asset classes and alternative investments except for cryptocurrencies. The red line shows the efficient frontier when considering the possibility of investing in cryptocurrencies through the CRIX index. This index is calculated in real-time by the Chair of Statistics Ladislaus von Bortkiewicz at Humboldt University, Berlin, Germany, supported for this purpose by professors from Singapore Management University. The index is composed of the 10 most relevant cryptocurrencies.
There is no doubt that the positive results in terms of risk-return performance from including crypto assets in portfolios are remarkable in all analyzed studies. An important question that we will later examine is whether these results can be sustained over time.
4. Empirical analysis from the perspective of a European investor
To test the hypothesis that Bitcoin, Ethereum, and, by extension, other cryptocurrencies have positive effects on the risk-return profile of financial asset portfolios for European investors, we conducted an empirical study based on the following methodology and databases.
Regarding the data, we considered daily observations of the following indices and prices from July 18, 2010, to December 31, 2021, for Bitcoin and from January 18, 2018, to December 31, 2021, for Ethereum.
To represent other risky asset classes, we selected the following indices:
Future price of gold on CME expressed in dollars.
Bitcoin price expressed in dollars according to the COINBASE platform.
Ethereum price expressed in dollars according to the BIBOX platform.
Standard & Poor’s 500 index from the U.S. stock market.
EUROSTOXX 50 index from the European stock market.
EONIA interest rate index for day-to-day money market operations in euros. It is a proxy for the risk-free interest rate for European investors.
Day-to-day interest rate index for the U.S. dollar.
Dollar/euro exchange rate.
We obtained data for stock market indices, gold futures, and cryptocurrency prices from the INVESTING.COM portal. The interest rate and exchange rate data come from the BLOOMBERG database.
The performance data of the two cryptocurrencies against other risky assets provide a profile of much more profitable assets, although, as we will see later, with very high risk (Table 7).
Fecha
Gold (%)
S&P (%)
EuroStoxx50 (%)
Bitcoin (%)
ETH (%)
Eonia Index (%)
USD 1D Index (%)
USDEUR (%)
1 YEAR
−4,471
25,054
20,992
55,577
372,418
−0,007
−0,001
−6,837
2 YEARS
16,803
48,236
14,773
550,385
2787,572
−0,060
−1,504
1,499
5 YEARS
48,319
122,140
30,630
5106,415
-.-
−0,178
−0,640
8,197
Table 7.
Performance in Euros of the analyzed assets.
The level of risk is measured through the standard deviation of the daily returns of different assets, subsequently annualized. The data obtained for this variable for the last two years are presented in Table 8.
Volatility 2021 (%)
Volatility 2020–2021 (%)
Gold
15,038
19,017
S&P
13,067
26,115
EuroStoxx50
15,076
25,206
Bitcoin
77,098
73,477
ETH
97,587
92,881
Eonia Index
0,061
0,056
USD 1D Index
0,511
1,054
USDEUR
5,831
6,759
Table 8.
Volatility data of analyzed assets.
It is evident that the high returns of cryptocurrencies were achieved at the cost of assuming high volatility. To complete this descriptive analysis, we have estimated the Sharpe ratio of the risky assets considered in our analysis, taking the EONIA return as the risk-free return. To avoid favoring cryptocurrencies, we exclusively used data from 2021. The data is presented in Table 9.
Sharpe Ratio 2021
Historical profitability (%)
Historical Vol (%)
Historical sharpe Ratio
Gold
−0,24
4,20
24,00
0,17
S&P
0,96
12,72
17,16
0,74
EuroStoxx50
0,83
2,99
20,50
0,15
Bitcoin
0,76
196,53
131,96
1,49
ETH
4,01
38,66
83,42
0,46
Table 9.
Sharpe ratio for the European investor of different asset classes.
To complete the analysis, we also estimated for each asset class from the beginning of Bitcoin on July 18, 2010, until December 31, 2021, except for Ethereum, whose data starts on January 18, 2018. Based on this widely used ratio in the markets, it is clear that cryptocurrencies present a great appeal in terms of the risk-return trade-off they offer for any European investor. It is noteworthy that, among the chosen asset portfolio, Bitcoin is the most attractive from its appearance date.
Moreover, it is crucial to understand the correlations between the returns of risky assets and cryptocurrencies to decide on the portfolio composition.
In Table 10, we present these correlations for the year 2021 and the period 2021–2022.
Correlations 1 Year
Gold (%)
S&P (%)
EuroStoxx50 (%)
Bitcoin (%)
ETH (%)
Eonia Index (%)
USD 1D Index (%)
USDEUR (%)
Gold
100,000
5,335
4,335
−6,120
3,611
3,474
12,241
36,688
S&P
5,335
100,000
52,503
30,177
27,641
2,693
4,636
17,489
EuroStoxx50
4,335
52,503
100,000
24,356
26,394
10,707
4,693
2,886
Bitcoin
−6,120
30,177
24,356
100,000
78,579
2,925
−3,996
8,184
ETH
3,611
27,641
26,394
78,579
100,000
10,419
−6,284
15,808
Eonia Index
3,474
2,693
10,707
2,925
10,419
100,000
6,154
9,272
USD 1D Index
12,241
4,636
4,693
−3,996
−6,284
6,154
100,000
−0,355
USDEUR
36,688
17,489
2,886
8,184
15,808
9,272
−0,355
100,000
Correlations 2 Years
Gold (%)
S&P (%)
EuroStoxx50 (%)
Bitcoin (%)
ETH (%)
Eonia Index (%)
USD 1D Index (%)
USDEUR (%)
Gold
100,000
14,625
11,731
12,775
14,199
−2,489
13,160
27,749
S&P
14,625
100,000
65,693
33,584
34,576
−4,024
13,294
1,889
EuroStoxx50
11,731
65,693
100,000
29,534
27,923
3,708
10,298
2,616
Bitcoin
12,775
33,584
29,534
100,000
81,966
0,042
−2,638
5,713
ETH
14,199
34,576
27,923
81,966
100,000
4,510
−2,138
8,638
Eonia Index
−2,489
−4,024
3,708
0,042
4,510
100,000
0,680
5,201
USD 1D Index
13,160
13,294
10,298
−2,638
−2,138
0,680
100,000
7,066
USDEUR
27,749
1,889
2,616
5,713
8,638
5,201
7,066
100,000
Table 10.
Correlations between analyzed asset classes.
A relevant question is the timeperiod to consider for estimating correlations. In this case, the furthest initial date should be taken as July 2015, as Ethereum was introduced in that month. Additionally, in the early years of cryptocurrency operation, factors could bias their correlation downward and obviously alter their return and risk parameters. These factors include:
Investors’ lack of awareness of the investment attractiveness of cryptocurrencies.
Lack of liquidity in cryptocurrencies.
The initial segmentation of the cryptocurrency market to investors and economic agents seeking fiscal and financial “opacity,” etc.
These factors likely alter the distribution of returns of these assets. From 2020 onwards, we can consider that well-known cryptocurrencies such as Bitcoin and Ethereum are integrated into the universe of potential investment assets for millions of investors worldwide, and their returns should be more representative of possible future behavior than returns from previous years.
In any case, we have studied the evolution of the correlation between Bitcoin and stock market assets based on different analyzed studies. In Figure 7, we represent the evolution of the correlation between the price of Bitcoin in US dollars and the SP500 index.
Figure 7.
Evolution of the correlation between Bitcoin and the SP 500 Index.
Regarding the relationship between Euro-denominated Bitcoin returns and European equities, the correlation increases from the value obtained of 0,145 in the study by Katjazi and Moro [13] to the value of 0,295 in Table 10. A significant increase in Bitcoin correlation over the last two years can be observed compared to the analysis of a more extended period. This is logical as Bitcoin becomes more integrated with the rest of the financial asset markets. Regardless of the comments we will make later on the future of cryptocurrencies as an asset class, investors should assume the hypothesis of an increase in future Bitcoin correlation with equities as crypto assets become more integrated with publicly traded stocks.
With the mentioned data, we conducted different portfolio optimization exercises. Specifically, we constructed the following portfolios:
A portfolio with “naive” diversification, equally weighting different asset classes.
Minimum variance portfolios for different levels of return without short positions.
The portfolio that allows obtaining the maximum Sharpe ratio.
We did not consider portfolios with short positions as they are not the usual strategy for common investors.
The results in terms of returns and risks for the optimized portfolios are shown in Table 11. The return is expressed in updated terms, and the risk is the updated standard deviation of that return.
PROFITABILITY (%)
RISK (%)
DIVERSIFICATION NAIF
31,65
23,17
OPTIMA RATIO SHARPE
47,46
17,74
MIN VARIANCE
−0,10
0,58
MIN VARIANCE 5%
5,00
1,87
MIN VARIANCE 10%
10,00
3,74
MIN VARIANCE 20%
20,00
7,48
MIN VARIANCE 30%
30,00
11,21
MIN VARIANCE 40%
40,00
14,95
Table 11.
Performance and risk of optimized portfolios.
What is very interesting is the analysis of the portfolio composition. These portfolios always consist of positions in low-risk assets (money markets in euros and dollars) with positions in Bitcoin, as shown in Table 12.
ASSET
NAIF (%)
MIN VAR (%)
MIN VAR 10% (%)
MIN VAR 20% (%)
MIN VAR 30% (%)
MIN VAR 40% (%)
SHARPE (%)
Gold
12,50
0,00
0,00
0,00
0,00
0,00
0,00
S&P
12,50
0,00
0,00
0,00
0,00
0,00
0,00
EuroStoxx50
12,50
0,00
0,00
0,00
0,00
0,00
0,00
Bitcoin
12,50
0,03
5,09
10,18
15,26
20,35
24,15
ETH
12,50
0,00
0,00
0,00
0,00
0,00
0,00
Eonia Index
12,50
39,22
85,31
70,86
56,41
41,96
31,05
USD 1D Index
12,50
52,76
9,61
18,97
28,33
37,68
44,80
USDEUR
12,50
7,99
0,00
0,00
0,00
0,00
0,00
100,00
100,00
100,00
100,00
100,00
100,00
100,00
Table 12.
Composition of optimized portfolios.
Even the minimum variance portfolio has a slight position in Bitcoins. In other words, given the excellent performance of Bitcoin in the two years analyzed, investors would use it as the risky asset to include in their portfolios. Conventional risky assets, such as equity assets, would not be of interest to investors.
Our results align with those obtained in other empirical analyses. For example, in the study by Katjazi and Moro [13] for European investors with portfolios without short positions, the average Bitcoin investment is 25.88% for the period June 2013 to December 2016. Interestingly, this position is less relevant for investors with the dollar as the base currency, as the average weight of Bitcoin in portfolios only reaches 5.47% for the same period.9
Empirical data are decisive regarding the appeal of Bitcoin and, by extension, other cryptocurrencies as an asset class. The significant question is whether this appeal is merely circumstantial and will eventually fade, making investors less concerned about this new asset class. In the next section, we will try to address, at least partially, these questions.
5. Can the appeal of cryptocurrencies be considered structural?
Doubts arise regarding the excellent performance of Bitcoin and other cryptocurrencies as an asset class based on two analytical approaches.
The first assumes that Bitcoin and crypto assets are nothing more than another episode of speculative bubbles in the market, akin to the tulip bulb mania in the seventeenth century.
The second approach links Bitcoin and cryptocurrency return to the outstanding performance of so-called technology stocks. This perspective suggests that investing in Bitcoins is a variant of investing in technology.
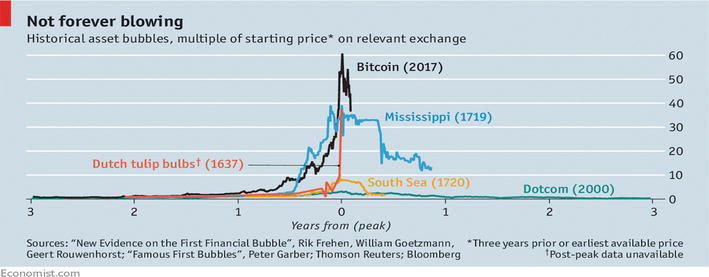
6. Is Bitcoin a new episode of speculative bubble?
As observed in Figure 8, some authors compare what happened with Bitcoin in recent years with the historical evolution of other assets that generated “price bubbles.” Figure 8, taken from The Economist magazine, is a good example of the hypothesis that Bitcoin was experiencing the formation and subsequent bursting of a new speculative bubble in 2017. The truth is that the bubble burst predicted by the chart for 2017 did not occur at all. Four years later, Bitcoin multiplied its price several times compared to the 2017 level.
Figure 8.
Bitcoin vs. other speculative bubbles. Source: The Economist, Abril 2017.
Indeed, there are several academic works that insist on the idea that Bitcoin and other cryptocurrencies are just another variant of speculative bubbles in market history.
Chea and Fry [20], in one of the earliest academic analyses of Bitcoin,10 concluded that:
Bitcoin and other cryptocurrencies are assets prone to experiencing price bubbles.
The “bubble” content within the price of Bitcoin is very high.
The fundamental value of Bitcoin is zero.
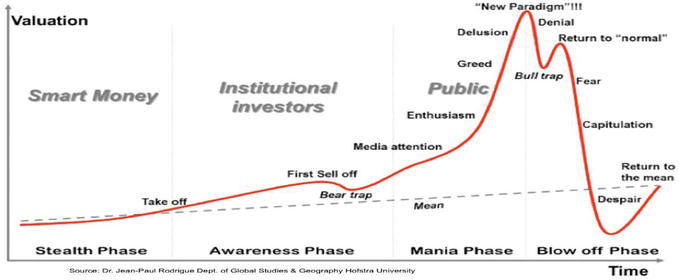
Professional cryptocurrency specialists such as Parker [22] modeled the phases of a bubble burst, as shown in Figure 9, following the model by Rodrigue et al. [23], which has become the paradigm for explaining the evolution of bubbles.11
Figure 9.
Evolution model of a price bubble by Rodrigue et al. [23]. Source: Rodrigue et al. [23].
It is challenging to fit the evolution of Bitcoin into the bubble model proposed by Rodrigue et al. [23] for any speculative asset. For example, in Rodrigue’s model, institutional investment begins acquiring the speculative asset before the general public does. As mentioned earlier, institutional investors in developed markets have started showing interest in Bitcoin after hundreds of thousands of individual investors have already invested in crypto assets. Cryptocurrencies have experienced a significant price adjustment this year due to solvency issues with “stablecoins” like TERRA LUNA, but as of the time of writing, they are in a recovery phase.
It is true that the cryptocurrency market is susceptible to various scams, pyramid schemes, and other fraudulent activities targeting investors. However, this is not the case for “serious” cryptocurrencies like Bitcoin and Ethereum.
Regarding the fundamental value of Bitcoin, Podhorsky [24] developed a microeconomic model of Bitcoin production to estimate it.
The model established that the fundamental value of a Bitcoin is equal to the equipment and electricity costs of miners in relation to their expected block reward. This idea of the fundamental value of Bitcoin associated with its mining cost is also presented in Hayes [25].
The association between the fundamental value of Bitcoin and its production cost is also behind the popular ratio or coefficient MVRV used by cryptocurrency specialists. This ratio was proposed by Mahmudov and Puell [26] and is widely used in the fundamental analysis of cryptocurrencies.
The MVRV ratio is the quotient between the capitalization of a cryptocurrency and the cost incurred for the “mining” or obtaining of its current volume. In other words, the ratio is equal to MV/RV, where:
MV = market value. Unit price multiplied by the number of circulating cryptocurrencies. For example, for Bitcoin, it’s the circulating Bitcoins multiplied by their price.
RV = realized value. Cost of extraction, mining, and/or obtaining of all existing cryptocurrencies at the time of calculation. For Bitcoin, it would be the amount paid for all circulating Bitcoins. This can be calculated by analyzing data on the Bitcoin blockchain. It involves tracking when Bitcoins were last moved from one wallet to another and calculating the price at that moment. Then, all these obtaining costs are added up to reach the total realized value.12
Obviously, this ratio is calculated for a particular cryptocurrency, and its value gives an idea of whether the price deviates from its production cost. In Figure 10, the evolution of this ratio is shown according to the financial services company AK INVESTMENT MANAGEMENT LLC (2021).
Figure 10.
MVRV ratio evolution. Source: ARK INVESTMENT MANAGEMENT LLC [27].
According to Elmandjra and Puell [28],13 “historically, the price of Bitcoin has had a ‘ceiling’ when the ratio has exceeded a value of 10.” It seems as if there is a mean-reversion process for the ratio, which, according to their analysis, would settle at a value of 3.
In this line of analysis, it is also interesting to explore whether “herding behavior” occurs in Bitcoin or not. Herding behaviors occur when, generally in times of high market volatility, investors follow the decisions of the majority of the market without adequately analyzing what is most suitable for their objectives and needs. In the financial markets, these behaviors translate into buying when the majority of investors buy or selling when the majority sells, without relying on specific analysis or relevant evidence.
Obviously, these herd effects fuel the creation of speculative bubbles, and when investors adopt a pessimistic view, they accelerate the “bursting” of bubbles.14 This has happened in other speculative markets, as shown, for example, in Thoma [30].
Bouri et al. [31] conducted an interesting study on this issue for 14 cryptocurrencies, representing 68.36% of the market, in the period from April 28, 2013, to May 2, 2018. Their analysis followed the methodology of Chang et al. [32], using the Cross Section Standard Absolute Deviation (CSAD) or Cross Section Standard Absolute Deviation as a proxy for the dispersion of asset returns and the asset return as a test for herding behaviors.
Herding behaviors generally occur in periods of market stress and strong price movements. In that context, the relationship between returns and their dispersion is non-linear. Bouri et al. [31] show that the cryptocurrency market is subject to herding behaviors that seem to vary over time. The high degree of correlation in the returns of different cryptocurrencies implies that cryptocurrency investors imitate the investment decisions of others. According to these authors, evidence of herding behavior suggests insufficient portfolio diversification, exposing investors who only hold cryptocurrencies to additional risk.
Poyser-Calderon [33] conducted a similar study for the top 100 cryptocurrencies in the COINMARKET database for the same period as the previous authors. The results are similar to the earlier analysis, with the author concluding that investors often deviated from the rational asset price analysis model and chose to follow consensus in market stress situations.
On the other hand, Jalan et al. [34] verify the generation of bubbles in different stocks in recent years, including those issued by listed companies linked to the world of cryptocurrencies.
7. Are cryptocurrencies an investment alternative to tech stocks?
In Figure 11, we present an interesting graph compiled by the investment bank Credit Suisse in 2021, showing the apparent high correlation between the price of Bitcoin in US dollars and the so-called FANG index or FAANG, composed of the stocks of the five major American technology companies: Facebook, Amazon, Netflix, Google, and the latest addition, Apple. This index was created by the New York Stock Exchange and includes the five major technology companies listed on the Nasdaq. What started as a term coined to encompass the most important American technology companies has ultimately become a valid reference index to verify what happens with major technology companies in the stock markets.15
Figure 11.
Correlation between Bitcoin price and FAANG Index. Source: Credit Suisse (2021).
Although the evolution until 2021 has been very similar for Bitcoin and major tech stocks, there are nuances worth highlighting that do not allow including cryptocurrencies in a generic tech asset class. For example, Vidal [36] conducted an interesting study for the triennium 2017–2019 on the risk-adjusted profitability of major cryptocurrencies compared to the stocks of the most important American tech companies, components of the FAANG index. As seen in Figures 12 and 13, the three analyzed cryptocurrencies—Bitcoin, Ether, and Ripple (XRP)—have a risk-adjusted return worse than tech stocks. The Sharpe ratios are 0.84 for Ether, 0.81 for Bitcoin, and 0.75 for Ripple. For tech stocks, they presented Sharpe ratios of 1.59 (APPLE), 1.33 (AMAZON), 1.04 (NETFLIX), 0.95 (GOOGLE), and 0.76 (FACEBOOK). Except for the last stock, the risk-adjusted performance of tech stocks was better than that of cryptocurrencies, despite the high returns of cryptocurrencies during the analyzed period.
Figure 12.
Sharpe ratio for cryptocurrency investment 2017–2019. Source: Vidal [36].
Figure 13.
Sharpe ratio for FAANG Investment 2017–2019. Source: Vidal [36].
To study this question, we conducted a comparative analysis between Bitcoin and the FAANG index for the period from September 30, 2017, to August 20, 2022, i.e., the last four years based on INVESTING data. The evolution of both assets, with their quotation set at 100 on September 30, 2017, is shown in Figure 14.
Figure 14.
Bitcoin vs. FAANG evolution 2017 (Sep)–2022 (Aug).
We can observe how Bitcoin experiences an explosive bullish trend starting from November 2020, which does not occur with the same intensity in the FAANG index. In contrast, from November 2021, Bitcoin undergoes a significant correction until August 2022, amounting to 64.81% from its peak, while the FAANG index only corrects by 27.87% from its highs. Regarding the correlation between both assets, it is only 0.257 based on monthly return data, making it difficult to assume that they belong to the same asset class.
Finally, concerning the Sharpe ratio, during the period, Bitcoin provided a ratio of 0.235 based on monthly data, while the FAANG index provided a ratio of 0.264 also based on monthly data. In other words, technological stocks continue to provide a higher risk-adjusted return than Bitcoin.
Therefore, empirical evidence allows us to make two conclusions:
Investment in cryptocurrencies, especially Bitcoin, has improved the risk-return trade-off for investors in recent years. However, it cannot be asserted that this positive effect will persist in the future as the correlation between Bitcoin and other similar assets increases with conventional investments, and their returns “normalize.” In fact, Nguyen [37] demonstrates that during periods of higher uncertainty, such as during COVID-19, the correlation between Bitcoin’s performance and the performance of the S&P 500 index increased significantly.
Bitcoin and cryptocurrencies are not components of the “Tech Stocks” asset class. While they have had similar behavior in some periods, the volatility of cryptocurrencies is much higher than that of tech stocks.
Another interesting aspect of Bitcoin investment, according to Kim [38], is that it is more beneficial to invest in spot positions in Bitcoin than through futures contracts. In their analysis based on Bitcoin futures market quotes from CME between December 2017 and December 2019, spot positions had an average performance premium of 5.4% compared to futures positions. This differential is explained by the difficulty of taking “short” positions in the Bitcoin spot market, preventing arbitrage.
Clearly, the emergence of new empirical evidence on Bitcoin and cryptocurrencies will allow us to confirm these ideas and more precisely assess the effect of their introduction into investors’ portfolios.
References
1.Greer RJ. What is an asset class, anyway? Journal of Portfolio Management. 1997;23:86-91
2.Burniske C, White A. Bitcoin: Ringing the Bell to a New Asset Class. New York: ARK INVEST Research; 2016. pp. 1-25. Available from: https://research.ark-invest.com/hubfs/1_Download_Files_ARK-Invest/White_Papers/Bitcoin-Ringing-The-Bell-For-A-New-Asset-Class.pdf
3.Kaushik P. Bitcoin ETFs: What they are and how to invest (in 2022). Bitcoin Market Journal. 2021. Available from: https://www.bitcoinmarketjournal.com/bitcoin-etf/
4.Krückeberg S, Scholz P. Cryptocurrencies as an asset class? In: Gouette S, Khaled G, Saadi S, editors. Cryptofinance and Mechanisms of Exchange – The Making of Virtual Currency. Springer International Publishing; 2019. pp. 1-28. DOI: 10.1007/978-3-030-30738-7
5.Chaim P, Laurini MP. Volatility and return jumps in Bitcoin. Economics Letters. 2018;173:158-163
6.Chan S, Chu J, Nadarajah S, Osterrieder J. A statistical analysis of cryptocurrencies. Journal of Risk and Financial Management. 2017;10:12. DOI: 10.3390/jrfm10020012
7.Markowitz H. Portfolio selection. The Journal of Finance. 1952;7(1):77-91
8.Elton EJ, Gruber MJ. Modern Portfolio Theory and Investment Analysis. 4ª ed. Nueva York: John Wiley & Sons; 1991
9.Bodie Z, Kane A, Marcus AJ. Principios de Inversiones. 5ª ed. Madrid: McGraw-Hill; 2004
10.Francis JC, Kim D. Modern Portfolio Theory: Foundations, Analysis, and New Developments. Nueva York: John Wiley and Sons; 2013
11.Gangwal S. Analyzing the effects of adding Bitcoin to portfolio. International Journal of Economics and Management Engineering. 2016;10(10):3519-3532
12.Gasser S, Eisl S, Weinmayer K. Does Bitcoin Improve Portfolio Diversification? Working Paper. Vienna: WU Vienna University of Economics and Business; 2015
13.Kajtazi A, Moro A. The role of Bitcoin in well diversified portfolios: A comparative global study. International Review of Financial Analysis. 2019;61:143-157
14.Demiguel V, Garlappi I, Uppal R. Optimal versus Naive diversification. How inefficient is the 1/N strategy? Review of Financial Studies. 2007;22(5):1915-1953
15.Sharpe W. A simplified model for portfolio analysis. Management Science. 1963;9:277-293
16.Bakry W, Rashid A, Al-Mohamad S, El-Kanj N. Bitcoin and portfolio diversification: A portfolio optimization approach. Journal of Risk and Financial Management. 2021;14(282):1-24
17.Ho Kim J. Analyzing diversification benefits of cryptocurrencies through backfill simulation. Finance Research Letters. 2022;50. DOI: 10.1016/j.frl.2022.103238
18.Liu W. Portfolio diversification across cryptocurrencies. Finance Research Letters. 2019;29:200-205
19.Letho L, Chelwa G, Alhassan AL. Cryptocurrencies and portfolio diversification in an emerging market. China Finance Review International. 2022:20-50
20.Chea E-T, Fry J. Speculative bubbles in Bitcoin markets? An empirical investigation into the fundamental value of Bitcoin. Economic Letters. 2015;130:32-36
21.Dowd K. New Private Monies. A Bit-Part Player? Howart Papers 174. Londres: Institute of Economic Affairs; 2014
22.Parker L. The Bitcoin Bubble; Pinpointing Where Bitcoin is Among the Four Phases. New Zeland: Brave New Coin; 2017. Available from: https://bravenewcoin.com/news/the-bitcoin-bubble-pinpointing-where-bitcoin-is-among-the-four-phases/
23.Rodrigue J-P, Comtois C, Slack B. The Geography of Transport Systems. 2nd ed. London: Routledge; 2008. ISBN 978-0-415-48324-7
24.Podhorsky. Bursting the Bitcoin Bubble: Assessing the Fundamental Value and Social Costs of Bitcoin. ADBI Working Papers Series, n° 934. Marzo: ADB Institute; 2019
25.Hayes A. Bitcoin price and its marginal cost of production: support for a fundamental value. Applied Economic Letters. 2019;26(7):554-560
26.Mahmudov M, Puell D. Bitcoin Market-Value-to-Realized-Value (MVRV) Ratio. US: Se puede obtener; 2018. Available from: https://medium.com/adaptivecapital/bitcoin-market-value-torealized-value-mvrv-ratio-3ebc914dbaee
27.Elmandjra Y. A Framework for Valuing Bitcoin. ARK Investment Management LLC; 2021. Available from: https://ark-invest.com/articles/analyst-research/valuing-bitcoin/
28.Elmandjra Y, Puell D. On-Chain Data: A Framework to Evaluate Bitcoin. Diciembre, 123021 Whitepaper. St. Petersburg, FL: ARK INVEST; 2021
29.Brunnermeier MK. Asset Pricing Under Asymmetric Information: Bubbles, Crashes, Technical Analysis and Herding. Oxford: Oxford University Press; 2001
30.Thoma M. Bad advice, herding and bubles. Journal of Economic Methodology. 2013;20(1):45-55. DOI: 10.1080/1350178X.2013.774850
31.Bouri E, Gupta G, Roubaud D. Herding behaviour in cryptocurrencies. Finance Research Letters. 2019;29(Junio):216-221
32.Chang EC, Cheng JW, Khorana A. An examination of herd behaviour in equity markets: an international perspective. Journal of Banking and Finance. 2000;24(10):1651-1699
33.Poyser Calderon O. Herding Behaviour in Cryptocurrency Markets. Working Paper, Noviembre. Universidad Autónoma de Barcelona, Departamento de Economía Aplicada; 2018. Available from: https://arxiv.org/pdf/1806.11348v2.pdf
34.Jalan A, Matkovskyy R, Poti V. Shall the winning last? A study of recent bubbles and persistence. Finance Research Letters. 2022;45:102162
35.Özduraka C, Karataş C. Covid-19 and the technology bubble 2.0: Evidence from DCC-MGARCH and wavelet approaches. Journal of Applied Finance & Banking. 2021;11(2):109-127
36.Vidal T. FAANG Stocks Provide a Better Risk-adjusted Performance than Bitcoin. New York, USA: Cointelegraph; 2020. Available from: https://cointelegraph.com/news/faang-stocks-provide-a-better-risk-adjusted-performance-than-bitcoin
37.Nguyen KQ. The correlation between the stock market and Bitcoin during COVID-19 and other uncertainty periods. Finance Research Letters. 2022;46(Parte A):102284
38.Kim ST. Is it worth to hold bitcoin? Finance Research Letters. 2022;44:102090
Notes
Investability as termed by Burniske and White.
In Krückeberg and Scholz [4], a thorough analysis of cryptocurrencies as an asset class is conducted.
Regarding the risk-return characteristics of Bitcoin, the work of Chaim and Laurini [5] provides valuable insights. Additionally, Chan et al. [6] analyze stochastic distributions that best fit the return series of various cryptocurrencies.
The pioneering work of Markowitz is complemented in his 1958 publication.
This theoretical approach is explained in any finance and/or investment management textbook. In my opinion, the analyses conducted in Elton and Gruber [8] chapters 2–4, Bodie et al. [9] chapters 5 and 6, and Francis and Kim [10] chapters 5 and 6 are very illustrative.
In modern applications of the Markowitz model, the budget constraint and the non-negativity constraint on weights are sometimes not considered due to the possibilities of taking "short" positions in assets and the leverage that can be achieved using derivatives, for example.
In Gasser et al. [12], one can find one of the first analyses of this issue. The problem is that at the time of conducting the analysis, there were few data available, and the first months of Bitcoin's operation are included, which may distort the results.
In the language of portfolio management, performance is the measure of risk-adjusted return that allows us to compare portfolios exposed to different levels of volatility. See Bodie et al. [9], chap. 20.
For Chinese investors, the weight would also be lower by 7.17%.
The idea that there was a speculative bubble in Bitcoin is already present in Dowd [21].
Jean Paul Rodrigue, a professor of economic geography, provided a graphical explanation that went "viral." It was published around February 2008 in a non-conventional format. See https://commons.wikimedia.org/wiki/File:Stages_of_a_bubble.png
The value of this ratio can be easily obtained on various websites specializing in cryptocurrencies.
Elmandjra and Puell [28], p. 20.
The relationship between bubbles and herd behavior can be found in the already classic work by Brunnermeier [29].
Some authors have suggested the existence of a bubble also in technology stocks. See Özduraka and Karataş [35].
Written By
Prosper Lamothe-López, Prosper Lamothe-Fernández and Leslie Rodríguez-Valencia
Submitted: 04 December 2023Reviewed: 05 December 2023Published: 04 April 2024