Open Access is an initiative that aims to make scientific research freely available to all. To date our community has made over 100 million downloads. It’s based on principles of collaboration, unobstructed discovery, and, most importantly, scientific progression. As PhD students, we found it difficult to access the research we needed, so we decided to create a new Open Access publisher that levels the playing field for scientists across the world. How? By making research easy to access, and puts the academic needs of the researchers before the business interests of publishers.
We are a community of more than 103,000 authors and editors from 3,291 institutions spanning 160 countries, including Nobel Prize winners and some of the world’s most-cited researchers. Publishing on IntechOpen allows authors to earn citations and find new collaborators, meaning more people see your work not only from your own field of study, but from other related fields too.
To purchase hard copies of this book, please contact the representative in India:
CBS Publishers & Distributors Pvt. Ltd.
www.cbspd.com
|
customercare@cbspd.com
Pressure depletion, temperature changes, and injection of CO2 or solvents into reservoirs can induce asphaltene precipitation and deposition in porous media. The dynamic displacement efficiency of a water alternating gas (WAG) process is controlled by relative permeability. Asphaltene deposition may alter the original characteristics of relative permeability curves. In this study, the effects of asphaltene deposition on the three-phase relative permeability using dynamic displacement experiments are investigated. A synthetic experimental approach is used to simulate the effect of in situ asphaltene deposition on the three-phase relative permeability of a water-wet system. Independent core flooding experiments are conducted on the different core-plug samples. The experimental results show that the asphaltene deposition changes the system from water-wet to mixed-wet. However, the results for the gas-oil system indicate it does not have a significant effect on gas-oil relative permeability. The oil relative permeability in a three-phase system shows different trajectories for oil iso-perm with different levels of asphaltene deposition until a certain gas saturation is achieved. Beyond this saturation point, all oil iso-perm trajectories merge, indicating no significant effect of asphaltene deposition. Understanding the impact of asphaltene precipitation and deposition in WAG application can provide valuable insights for optimizing enhanced oil recovery strategies.
PETRONAS Research Sdn. Bhd. (PRSB), Selangor, Malaysia
Mansoor Zoveidavianpoor*
Faculty of Chemical and Energy Engineering, Department of Petroleum Engineering, Universiti Teknologi Malaysia, Malaysia
Malaysia Petroleum Resources Corporation (UTM-MPRC), Institute for Oil and Gas, Universiti Teknologi Malaysia, Johor, Malaysia
*Address all correspondence to: mansoor353@yahoo.com
1. Introduction
Asphaltene deposition is a severe problem that some oil reservoirs may face during their production life. It may occur during natural depletion, displacement of reservoir oil by CO2 or hydrocarbon gas, or during WAG application. There are several studies in the literature that have addressed asphaltene problems during the primary recovery or CO2 injection as a secondary recovery stage [1, 2, 3]. Despite all research and studies conducted in the past, the definition of asphaltene itself is not yet very well understood, and it has been defined based on its solution properties. Asphaltene is arbitrarily defined as a soluble class of petroleum that is insoluble in light alkanes such as n-heptane or n-pentane but soluble in toluene or dichloromethane [4].
An evaluation of the asphaltene stability is the first step toward predicting and avoiding any asphaltene issues at reservoir conditions. The asphaltene equilibrium conditions can be disrupted due to pressure depletion, temperature change, change in crude oil composition, and the addition of miscible gases and liquids to the oil as applied in various enhanced oil recovery (EOR) techniques [5]. The effect of the composition and pressure change on asphaltene precipitation is generally believed to be higher than the temperature [6]. The onset point of asphaltene is the point at which asphaltene loses its stability from thermodynamic equilibrium in solution and forms a separate and visible phase that starts the point of precipitation step [7]. During this step, asphaltenes that have tendencies to aggregate may reach the flocculation and then deposition steps. Indeed, after asphaltene precipitates from the oil, they may flocculate to form much larger-sized molecules; however, they are still suspended in the solution. The flocculated asphaltenes which can be suspended with oil flow may be deposited on the rock surface because they become so large and cannot be carried by the liquid [8]. Therefore, asphaltene deposition means the settling of asphaltenes’ flocculated particles onto the rock surfaces. The flocculated asphaltenes can be adsorbed onto the rock surface by adsorption or may be trapped within the porous media because of their size, thereby blocking the pore throats of the formation by plugging. Moreover, the deposited flocculated asphaltenes can be flushed away by oil due to the shearing effect if the local oil velocity is high because of entrainment [9].
1.1 The impact of asphaltene on reservoir performance
Heavy organic components such as asphaltenes, resins, and waxes exist in crude oils in various quantities and forms. Such compounds could separate out of the crude oil solution because of various mechanisms and deposits. The reasons for the asphaltene deposition can be many factors including variations in temperature, pressure, pH, composition, flow regime, wall effect, and electrokinetic phenomena [10]. Many papers have addressed asphaltene problems during primary recovery or CO2 injection as a secondary recovery stage [1, 2, 3, 9, 11].
Formation damage because of asphaltene deposition in the oil industry is an issue for many fields that causes a reduction in production and shutting off of some of the wells and a severe detrimental effect on the economics of oil recovery. Once the asphaltene deposition occurs, it may cause severe permeability and porosity reduction and wettability alteration, changing relative permeability in the reservoir and, in severe cases, plugging the wellbore and surface facilities [12, 13, 14]. The approach taken by most operators is a remedial solution rather than preventive one. The remedial measures such as chemical treatment and workover operations are disruptive and expensive [1]. Thus, the probability of asphaltene precipitation and deposition occurring during any EOR techniques, its effects on reservoir performance, and preventive measures should be anticipated at the earliest stages of each project. This anticipation can be reached through a better understanding of the mechanisms up front that initiate such problems [15].
1.2 Analyzing asphaltene effects in EOR WAG: numerical and experimental approaches
EOR processes can modify the flow and phase behavior of reservoir fluids and rock properties. These modifications could lead to asphaltene precipitation and deposition and cause formation damage problems [16, 17]. Asphaltene-deposited particles caused by impairing the permeability by plugging the pore throat and altering wettability by adsorbing on the rock surface may lead to formation damage [1]. Deposition of solid asphaltenes causes porosity and absolute permeability reduction. This can also result in the alteration of rock wettability from water-wet to mixed- or oil-wet and the plugging of the wellbore and piping in production facilities [16, 18]. Asphaltene deposition may induce favorable changes in relative permeability and end-point saturations; hence, it can affect the displacement efficiency [19]. The main mechanisms behind this alteration are still a research topic. However, it has been reported that some of its effects can be captured by wettability change and relative permeability shift from a water-wet to a mixed- or oil-wet system. Few technical published papers related to various EOR/IOR case studies including CO2 gas injection, immiscible water alternating gas (IWAG), gravity-assisted simultaneous water alternating gas (GASWAG), chemical EOR (CEOR), chemical water alternating gas (CWAG), and recent carbon capture and storage (CCS) related papers from the authors of this paper are given for reference [1, 20, 21, 22, 23, 24]. To investigate the effect of asphaltene deposition on relative permeability during WAG application, dynamic experiments were designed and conducted in the core flooding system under reservoir conditions. Because of the experimental difficulty of three-phase relative permeability measurements, first, the effect of asphaltene on relative permeability is investigated in the water-oil system as well as the gas-oil system separately, and then they are combined obtaining a three-phase relative permeability system [7].
1.3 Pioneering researchers and outcomes in EOR WAG core flooding studies
Recent studies have shown that formation damage prevention, assessment, control, and removal are among the important issues dealing with the oil and gas production from petroleum reservoirs [25]. Any EOR process can modify the flow and phase behavior of the reservoir fluid and rock properties, and these modifications could lead to asphaltene precipitation and deposition and cause formation damage problems [16]. In cases of deposition, the damage area is normally restricted to the wellbore zone; but in the case of precipitation, damage extends over large distances from the wellbore.
Asphaltene precipitated particles by impairing the permeability through plugging pore throat and altering wettability through adsorbing on negatively charged mineral sites may lead to formation damage [1]. The deposition of solid asphaltenes causes a reduction of the pore space available for fluids, that is, porosity reduction, absolute permeability reduction, alteration of rock wettability from water-wet to mixed-wet (or oil-wet), and plugging of the wellbore and piping in production facilities [16]. The deposition may induce favorable changes in relative permeability, end-point saturations, and effects on the displacement efficiency [19]. For instance, wettability controls the flow and distribution of immiscible fluids in an oil reservoir, which plays a key role in any oil recovery process. One way that oil components are thought to alter wettability is by coating pore surfaces with precipitated asphaltenes. The deposited asphaltene may cause the alteration of rock wettability from water-wet to oil-wet. Wettability has been shown to affect relative permeability, irreducible water saturation, residual oil saturation, capillary pressures, dispersion, and electrical properties. The alteration of relative permeability and end-point saturations has the strongest influence on displacement processes.
It should be emphasized that alteration of wettability from water-wet to oil-wet is not necessary to cause formation damage for all reservoirs. This wettability change may improve displacement performance and efficiency and may be favorable for oil recovery depending on the nature of wettability [26]. In fact, the relation between recovery and wettability is very complex, and it is still a controversial subject. Kamath et al. [27, 28] studied the effect of asphaltene deposition on permeability, pressure drop, and displacement performance of oil by water using one core of consolidated Berea sandstone and two unconsolidated sand packs. The results showed that asphaltene deposition caused permeability reduction but also caused improvement of oil displacement by water because of the improvement in oil relative permeability. In conclusion, wettability alteration is itself a complex topic and is a subject of active research. In this study, the experimental results emphasize that the wettability alteration from water-wet to more oil-wet or mix-wet because of asphaltene deposition occurred.
Relative permeability is a complicated function of fluids and rock properties. It is believed to be affected by the following factors: pore geometry, wettability, fluid distribution, saturation, saturation history, flow rate, viscosity ratio, temperature, overburden pressure, interfacial tension, density, initial wetting phase, and immobile phase saturation [29, 30, 31]. All these factors are reviewed in the relative permeability of petroleum reservoirs book written by [29]. They pointed out that all factors that influence flow in systems containing two mobile phases can apply to three-phase systems as well. Furthermore, they mentioned that the wettability of reservoir rock has a major impact on relative permeability curves and subsequent reservoir performance. They emphasize that wettability is the main factor responsible for the microscopic fluid distribution in porous media, and it largely determines the amount of residual oil saturation and the ability of a particular phase to flow. Moreover, many researchers have reported the effects of hysteresis and spreading coefficient on three-phase relative permeability. The problem of hysteresis increases significantly when moving from a two-phase to a three-phase flow system. The three-phase hysteresis problem is significantly more advanced than that in the two-phase flow for two reasons. First, the number of saturation directions increases and, second, the definition of hysteresis becomes ambiguous. On a macroscopic scale, the number of process paths increases from a two-phase flow to a three-phase flow. In addition, the saturation path within the ternary diagram is not predefined in three-phase systems. For the two-phase case, the only unknown part of the saturation trajectory is its endpoints, as compared with the three-phase flow for which the whole saturation trajectory is initially unknown. On a microscopic scale displacement, sequences that can occur in three-phase systems are not seen in two-phase systems. These include double displacement mechanisms and spreading behavior of the intermediate wetting phase. Depending on the equilibrium spreading coefficient, one or two phases can be distributed as films in the porous medium.
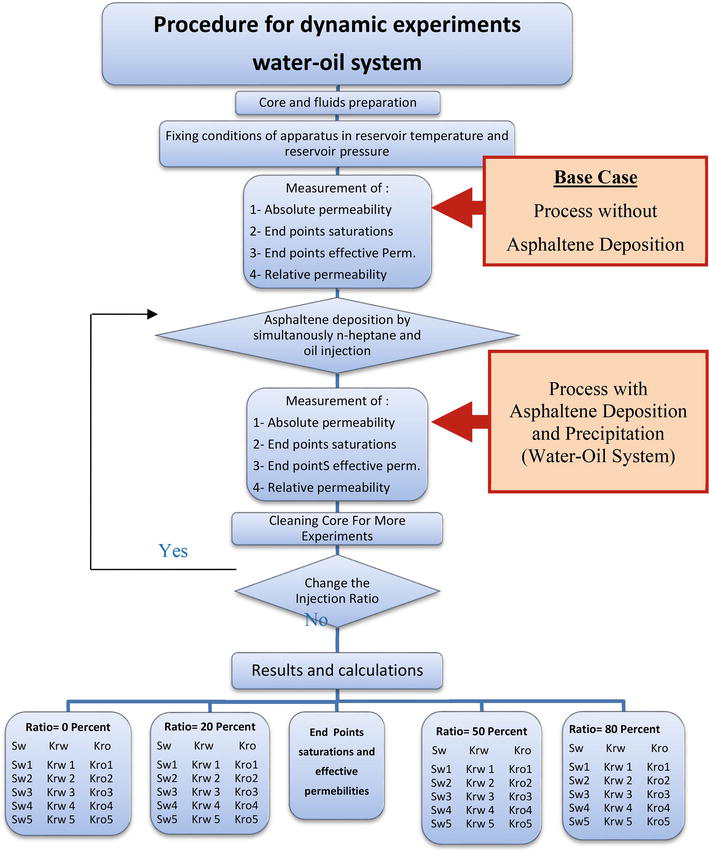
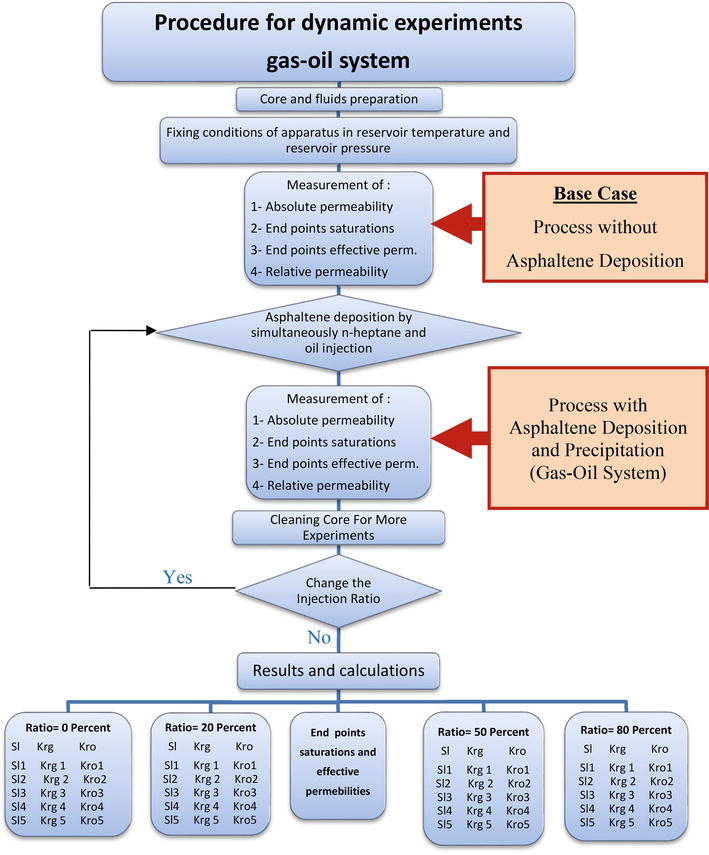
In this section, we describe the core flooding set ups, experiment procedure, and materials used to conduct the experiments. The procedure of these core flooding experiments in water-oil system and gas-oil system are presented in Figures 1 and 2, respectively. For each system, first, the relative permeability was measured without asphaltene deposition as a baseline, and then the relative permeability under different asphaltene percentages was measured using a synthetic approach. The preparation of a proper oil sample is a crucial step in conducting any asphaltene study. In this study, because of the difficulty in the preparation of the down-hole sample, the surface oil sample is used. For the investigation of the asphaltene effect on relative permeability by this type of sampling, a synthetic dynamic procedure is used to simulate asphaltene deposition and study asphaltene problems associated with it. In this procedure, n-heptane solvent as an asphaltene precipitating agent is used to create in situ asphaltene precipitation in porous media during core flooding experiments. As reported in the literature, n-alkanes are common solvents to precipitate asphaltene from dead oil [4, 7].
Figure 1.
General flowchart of core flooding experiments, water–oil system.
Figure 2.
General flowchart of core flooding experiments, gas-oil system.
In this synthetic experimental approach, n-heptane and oil are injected simultaneously through different injection ports into a core sample. These fluids can be completely miscible inside porous media. The miscibility of these fluids may lead to asphaltene precipitation and then deposition depending on the core pore geometry and core pore-size distribution. During core flooding experiments, some oil samples are collected to determine their asphaltene weight presents. The reduction in asphaltene weight presents can be an indication of asphaltene deposition inside the porous media. On the other hand, different amounts of n-heptane to oil ratio injection could lead to the creation of different amounts of asphaltene deposition. Therefore, the different ratios of simultaneously n-heptane to oil injection are chosen to obtain different degree of asphaltene deposition inside the core. This synthetic experimental setup and procedure are explained in detail for the water-oil system and gas-oil system, separately.
2.1 Core flooding experiment setup and materials
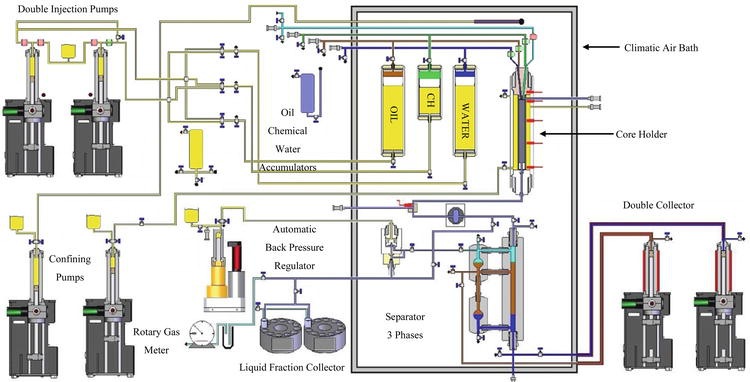
The schematic of the experimental setup used in this study to investigate the effect of asphaltene deposition on relative permeability in water-oil and gas-oil systems is presented in Figure 3. The experimental setup from Sanchez Technologies consists of two injection pumps, three fluid stainless steel accumulators, a radial core holder, a three-phase separator and collecting pumps, an automatic fraction collector, pressure transducers, a back pressure regulator, and electronic valves. The system is equipped with a powerful and user-friendly data acquisition system. A radial core holder manufactured by Sanchez Technologies can accommodate cores with variable lengths up to 12 in and a constant diameter of 1.5 in. The core holder can be placed horizontally, vertically, or tilted depending on the experiment objective. In this study, it is placed horizontally during all experiments, and injection is carried out from the left- to right-hand side. There are two pressure taps in the inlet and outlet of the core and four temperature taps placed at the inlet, across two sections of the core and at the outlet. In addition, the core holder has three inlet ports: two for the liquid and one for the gas injection and one outlet port for fluid production. The inlet and outlet ports of the core holder are connected to pressure and temperature transducers that can control the pressure and temperature around the core sample. The inlet ports are also connected to the three accumulators and then to injection pumps.
Figure 3.
Schematic of experimental setup used for displacement experiments.
A rubber sleeve is placed inside the core holder to apply confining pressure around the core sample. The confining pressure is applied around the core sleeve to prevent any fluid leakage or bypass around the core sample; during the displacement experiments, the confining pressure on the core is provided by injecting distilled water in the annular space between the core holder and rubber sleeve. The three accumulators are used to store oil, chemicals, and water for delivery under high pressure up to 15,000 psi. The oil and water columns are from stainless steel that can hold a volume of 3000 cc. The chemical accumulator can hold a volume of 1000 cc from Hastelloy materials that are resistant to corrosion. Three accumulators can work in a range of temperatures from ambient to 200°C. The outlet port can connect to an automatic fractional collector or three-phase separator through a back pressure regulator for the collection of produced fluid from the core sample. A back pressure regulator (BPR) can maintain a constant pressure in the system by blocking flow until the system pressure reaches the set pressure. The automatic fraction collector is used to collect the different fractions at the output of the differential valve continuously. It is composed of two heated trays, and each tray can accommodate three different sizes of collecting tubes with a capacity of 20, 15, and 10 cc. Each tray can hold twelve collecting tubes or collection liquid fractions. The temperature of the fraction collector can be increased from ambient to 80°C. It is worthwhile to mention that in a single experiment, it is not possible to use both separator and fraction collector simultaneously.
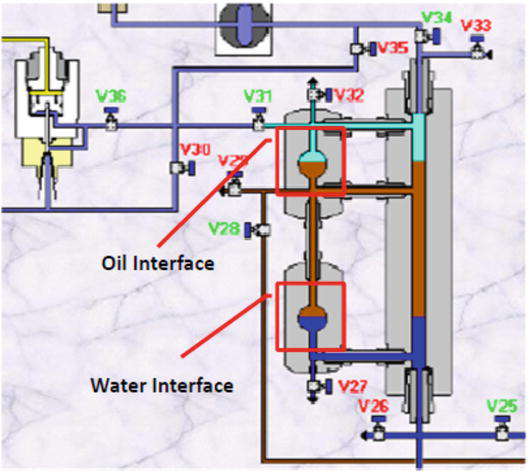
A three-phase separator is used to measure produced oil, gas, and water from core flooding experiments. The separator works based on an infrared detection system that varies with the physical properties of the phases. An infrared phase detection system includes a light source for emitting into a fluid. A detector can detect the attenuation of the infrared wavelength band as the infrared radiation passes through a fluid. Different fluids have a different but specific output signal that is used to determine the phase type. There are two infrared detection systems to determine the water-oil contact and gas-oil contact. At the beginning of experiments, both contacts should exactly be adjusted in front of the infrared system, as shown in Figure 4. Any changes in fluid level can be detected by signal changes. There are two collecting pumps and a wet rotary gas meter that can collect and measure the produced liquids and gases. A rotary gas meter that works upon the principle of positive displacement measures the cumulative volume of gas released. The sample gas stream rotates a measuring drum within a packing fluid, usually water or low viscous “white” (clear) oil. A needle dial and a counting mechanism, coupled to the rotating drum, record the volume of gas flow as it sequentially fills and empties from the drum’s rigid, fixed volume-measuring chambers. The complete core flooding system is placed inside the digital oven system; therefore, the system temperature can be controlled and kept at a certain temperature. For this study, the temperature of all core flooding experiments is kept around 60°C. In addition, the back pressure regulator is always used to keep the core flooding system pressure around 1500 psi.
Figure 4.
Schematic of three-phase separator in core flooding system.
The following sections (i.e., 2.2. and 2.3.) describe the core flooding experiments conducted for oil-water and gas-water systems.
2.2 Core flooding experiment in water-oil system
The unsteady-state or dynamic displacement method is the most frequently applied method in reservoir analysis of strong wetting preference and with homogeneous samples. Therefore, in this study, the unsteady-state method based on [32] is used for the determination of relative permeability data. In each of the following core sample, the subsequent experimental procedure is separately applied to investigate the effect of asphaltene precipitation and deposition on relative permeability and reservoir performance in the water-oil system.
Determination of basic core properties: The bulk volume of the core is computed from the measurements of dimensions of the uniformly shaped core sample. After weighing the dry core sample, a brine of 10,000 ppm sodium chloride concentration is used for the saturation of the core sample. The saturation is done by using a vacuum pump and extracting out the initial fluid inside the sample and replacing the void pore spaces of the sample with prepared brine. The core sample is weighed again to determine the wet weight of the core sample. The value of pore volume is computed from the difference between the dry and the wet weight of the rock sample and brine density.
Preparation and setting-up system: The saturated core sample is inserted into rubber sleeve and carefully tightened in the core holder to ensure direct contact between the core sample and core holder end pieces. The three accumulators are filled with crude oil sample, brine water, and n-heptane. The core flooding system temperature is increased to 60°C, and the overburden pressure is applied on the rubber sleeve that is always 500 psi over the injection pressure. The back pressure regulator is used to control the core flooding system pressure around 1500 psi.
Absolute permeability, irreducible water, and initial oil saturation measurements: The brine is injected into the core at a constant flow rate of 1.0 cc/min until the pressure drop across the core is stabilized and a steady-state condition is attained. The absolute core permeability is calculated using Darcy’s law and the stabilized pressure drop. Then, the oil is injected into the core at the same system injection pressure condition to displace brine water at a rate of 0.5 cc/min, until the pressure drop is again stabilized, and no more water can be displaced from the core. The total amount of brine production is recorded during the oil injection process. Again, the stabilized pressure drop is used to calculate effective oil permeability at irreducible water saturation by using Darcy’s law. This is the original effective oil permeability without asphaltene effects at irreducible water saturation. The irreducible water saturation and initial oil saturation are then determined from the volumetric material balance.
In situ asphaltene precipitation and deposition: As stated previously, the ratio of n-heptane to oil injection can control the amount of asphaltene precipitation and deposition. The three ratios 20, 50, and 80% are selected to create different asphaltene precipitation and deposition. The first core plug sample is used for the case without asphaltene precipitation with a 0% ratio n-heptane to oil injection. The three other core plug samples that are cut from the long core sample and with the mostly same properties are used for the ratios of 20, 50, and 80%, respectively. All steps from (a) to (f) are separately done for all core plug samples except for the first core plug sample, but Step (d) is excluded. The n-heptane is injected simultaneously along with the oil injection but in separate port injection with preselected ratio. During this process, the injection pressure and pressure drop are recorded and monitored. An increase in the injection pressure is an indication of asphaltene deposition. Some oil samples are collected for asphaltene weight percent determination during the simultaneous injection. This simultaneous injection is stopped after several hours and continued by only oil injection until the pressure drop once again stabilized and the core is saturated fully with oil. The material balance for asphaltene weight percent between the collected oil samples and injected oil is done to determine the amount of asphaltene deposited inside the core for this simultaneous ratio injection.
Relative permeability measurements: The oil injection is stopped after the core is fully saturated with oil at irreducible water saturation. The brine injection has again started to displace oil out at a rate of 0.5 cc/min and at the same system injection pressure condition. Time, pore volume injection, pressure drop across the core, and oil and water production are measured continuously until the pressure drop is again stabilized and no more oil can be displaced from the core. Effective water permeability at irreducible oil saturation is again calculated based on the stabilized pressure drop and using Darcy’s law. Irreducible oil saturation and final water saturation are then determined from the volumetric material balance, which is later explained in detail. The commercial core flow simulator [33], a black-oil simulation model, is used to determine the oil and water’s relative permeability. This simulator performs history matching of the experimental data (e.g., differential pressure, oil production, and water production) obtained in the lab to estimate the relative permeability data.
Cleaning: After measurements of relative permeability by dynamic displacement of oil by water, the core and core flooding system are flashed again with n-heptane, and the core is cleaned with toluene to extract the residual crude oil with asphaltene and water. Then, the core is dried.
2.3 Core flooding experiment in gas-oil system
The unsteady-state or dynamic displacement method is again used to investigate the effect of asphaltene on the relative permeability in the gas-oil system. In each of the following core sample, similar subsequent experimental procedures have been explained for the water-oil system except for step one. Indeed, Step (e) is separately applied to investigate the effect of asphaltene precipitation and deposition on relative permeability and reservoir performance in the gas-oil system.
During dynamic experiments in the gas-oil system, instead of using brine injection in Step (e), the gas injection should be used. Nitrogen is used for the gas injection process. For this purpose, after draining out all brine from the brine accumulator, the nitrogen is transferred carefully from the high-pressure cylinder into the accumulator at a pressure less than 1500 psi. After heating the nitrogen to the system temperature, indeed 60°C, the accumulator pressure reached 1500 psi exactly. Therefore, in these experiments, the gas injection pressure is adjusted around 1500 psi such as the oil injection pressure during the oil-water system. The gas is injected by setting a rate of 0.5 cc/min for the injection pump. The injection pump can inject water at a rate of 0.5 cc/min, and this injection can move the piston in the bottom of the accumulator and, as a result, the gas can be injected into the core sample. Because of gas compressibility, the pressure inside this accumulator should be constant and around 1500 psi until it can be assumed that this is the same as the gas injection rate. The gas rate during gas injection should represent the typical reservoir gas velocities and pressure drops of 1–5 psi/ft. For this purpose, after stopping oil injection and when the core is fully saturated with oil at irreducible water saturation, gas injection is started to displace oil out at a rate of 0.5 cc/min and at the same system injection pressure condition. Here, the time, the pore volume injection, the pressure drop across the core, and the oil and gas production are measured continuously until the pressure drop is again stabilized, and no more oil can be displaced from the core. Effective gas permeability at irreducible liquid saturation is again calculated based on the stabilized pressure drop and using Darcy’s law. Irreducible liquid saturation and final gas saturation are then determined from volumetric material balance.
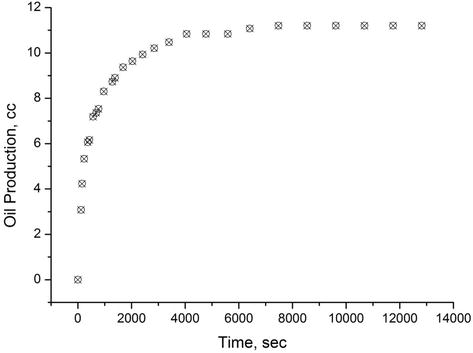
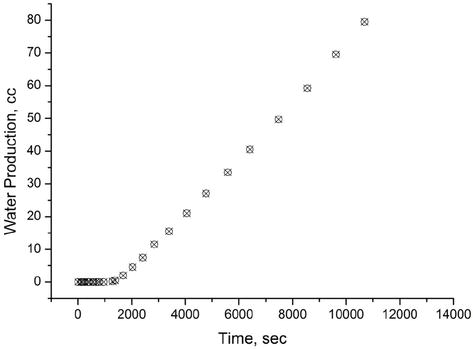
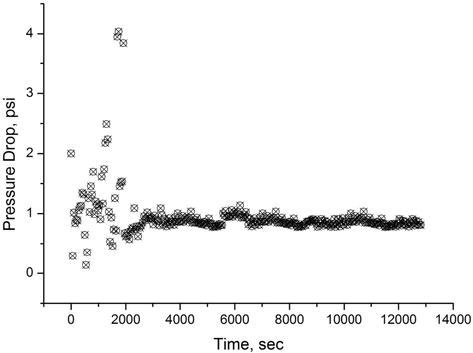
The experimental results that are directly measured during core flooding experiments in water-oil and gas-oil system mostly include pressure drop across the core, oil production, and water production versus time. An example of these results using 20% ratio of n-heptane–crude oil injection in water-oil system is shown in Figures 5–7 [34].
Figure 5.
Oil production (20% ratio of n-heptane–crude oil injection, water–oil system).
Figure 6.
Water production (20% ratio of n-heptane–crude oil injection, water–oil system).
Figure 7.
Pressure drop (20% ratio of n-heptane–crude oil injection, water–oil system).
The end-point saturations during core flooding experiments for water, oil, and gas are computed based on the material balance calculation. The endpoints’ effective and relative permeability for water, oil, and gas are computed based on the amount of pressure drop data during steady-state conditions, rock and fluid properties, and using Darcy’s law. Table 1 shows these results for the water-oil system [34].
Ratio of n-heptane to oil injection, %
Length, cm
Diameter, cm
Oil viscosity, cp
Oil rate, cc/min
Pressure drop, psi
keoSwi, md
kroSwi, fraction
0
7.62
3.81
4.70
0.50
1.50
256.67
0.9589
20
7.65
3.81
4.70
0.50
2.00
192.67
0.7198
50
7.62
3.81
4.70
0.50
2.25
171.11
0.6393
80
7.60
3.81
4.70
0.50
2.51
153.39
0.5731
Table 1.
Effective and relative oil permeability (water–oil system).
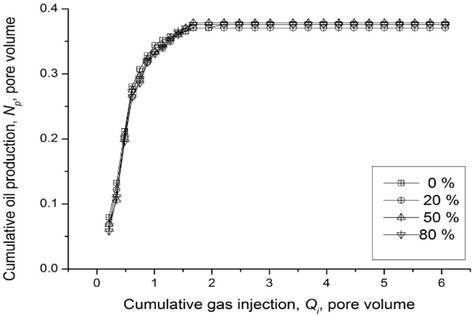
The entire curves of relative permeability for water-oil and gas-oil systems are estimated during history matching processes of experimental data and using a one-dimensional, two-phase black-oil simulation model. Stone’s II model is used to compute the three-phase relative permeability for the oil phase. The nonlinear multiregression analysis based on matching process results is used to develop the appropriate correlations for irreducible water saturation, residual oil saturation, water relative permeability, gas relative permeability, and oil relative permeability as a function of asphaltene deposition. Based on these observed experimental data, the cumulative pore volumes of oil production versus the cumulative pore volume of the gas injection at various ratios of n-heptane to crude oil injections are computed and can be shown in Figure 8. As shown, asphaltene deposition does not have significant effects on the oil production curve during gas injection. This may relate to the behavior of gas in sweeping up the oil. Indeed, in most systems, gas can play a non-wetting phase rule compared to oil and water. Whereas gas can enter the large pore spaces and can sweep up the oil better than water [34].
Figure 8.
Oil production versus gas injection (gas-oil system).
3.2 Modeling of relative permeability
A commercial core flow simulator is used to determine oil and gas relative permeability in the presence of irreducible water saturation [33]. The simulator performs history matching of the experimental data (e.g., differential pressure, oil production, water production) obtained in the lab to estimate the relative permeability data in the gas-oil system.
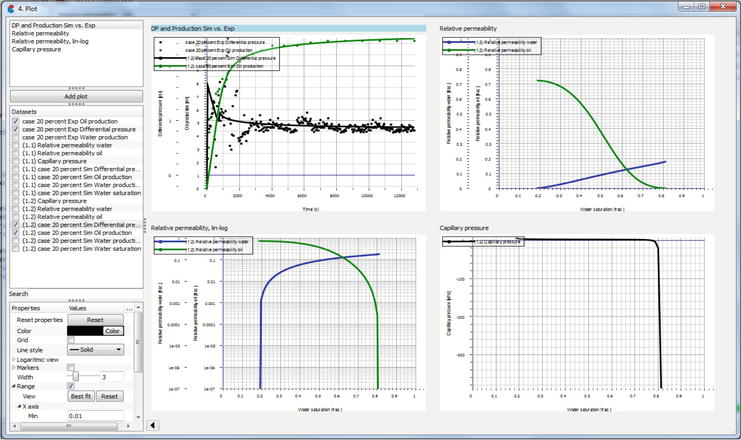
It is used as a one-dimensional, two-phase simulation model for analyzing special core analysis experimental data. This simulator is useful for the analysis of experimental data in the water-oil system as well as in gas-oil system; in addition, the two processes drainage and imbibition can be considered. It is worth noting that the simulator is equipped with well-known correlations of relative permeability such as Corey, LET, Burdine, Chierici, and Sigmund & McCaffery for estimation purposes [35, 36]. Experimental data versus time are introduced into software such as differential pressure across the core, oil and water production for the water-oil system and differential pressure across the core, oil production, and gas production for the gas-oil system obtained in the lab during the experimental performance. Then, one correlation such as the Corey correlation is chosen, and four endpoints of the relative permeability curves are introduced. Typically, an estimation step should preferably be initiated with one correlation and then proceed with other more correlations until an adequate history match of the experimental data is obtained. Figure 9 shows a plot window with several plots after the matching process in this software.
Figure 9.
Plot window with several plots after matching process.
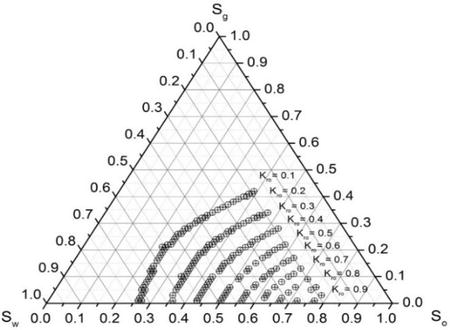
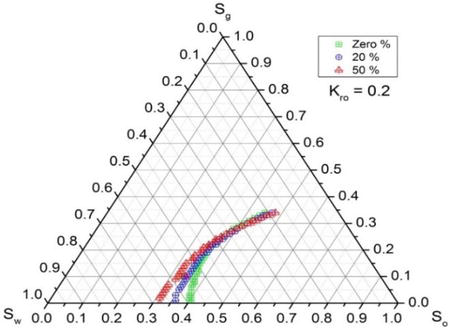
Stone’s II model is used to compute the oil relative permeability in a three-phase system based on two sets of two-phase relative permeability data. The relative permeability data in water-oil system and gas-oil system are obtained using the core flow simulator. The ternary diagram with fluid saturation points and iso-perm curves are commonly used to illustrate changes in the oil relative permeability values in the three-phase system. The computed values for the oil relative permeability for 20% n-heptane–crude oil ratios injection experiments based on Stone’s II model are shown by oil iso-perm curves in Figure 10. The effect of asphaltene deposition on oil relative permeability is related to the amount of gas saturation. The oil’s iso-perm in a three-phase system shows different trajectories with different levels of asphaltene deposition until a certain gas saturation. For gas saturations above this saturation, all oil iso-perm trajectories merge, indicating no significant effect of asphaltene deposition. Figure 11 illustrates a gas saturation level near 0.25 for an oil iso-perm of 0.2. Notably, two distinct behaviors are observed for oil iso-perm trajectories around this gas saturation. Above 0.25 gas saturation, all oil iso-perm trajectories merge, indicating no substantial impact from asphaltene deposition. However, below this gas saturation level, various oil iso-perm trajectories can occur, signifying a significant effect of asphaltene deposition.
Figure 10.
Oil relative permeability at 20% ratio of n-heptane–crude oil injection.
Figure 11.
Comparison of oil relative permeability of 0.2 for all cases.
3.3 Asphaltene modeling and numerical simulation
In this section, we model asphaltene deposition in porous media using numerical simulation with the experimental data obtained from the experiments described in the previous section. We use an eclipse commercial simulator.
3.3.1 Grid model & simulation inputs
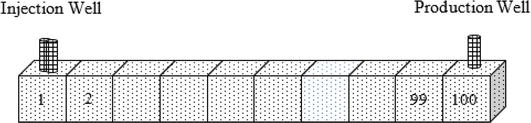
Reservoir simulation has become a standard predictive tool in the oil industry. It can be used to obtain accurate performance predictions for a hydrocarbon reservoir under different operating conditions. There are several asphaltene models currently in use by simulators, but there is still no consensus about the characterization of asphaltene behavior. Basically, asphaltene modeling and simulation processes are decomposed into different stages in each simulator. Precipitation triggers a sequence of flocculation, deposition, and formation damage, including porosity and absolute permeability reduction, viscosity changes, and relative permeability alteration. A one-dimensional model with a grid dimension of 100 × 1 × 1 is chosen. The uniform widths of each grid block in the x and y directions are 80 ft. with a uniform vertical grid block thickness of 20 ft. The porosity is 22.4% and the same for all grid blocks. The absolute permeability in the × direction is 260 md. The porosity and absolute permeability values are considered the same as those of the core sample properties. The water and CO2 injector wells are located at Block 1 that is at the left edge of the reservoir, and the producer well is located at Block 100 that is at the right edge of the reservoir. Figure 12 shows a schematic of the simulation model for this reservoir. The injection and production plan include 500-day natural depletion, 500-day water injection, and 2000-day cycle of WAG injection. The total recovery period is more than 8 years. The producer operates under a constant bottomhole pressure (BHP) of 500 psi. The water injection and gas injection wells commenced at a constant surface rate of 100 STB/day and 500 MSCF/day, respectively [34].
Figure 12.
Grid model for numerical simulation.
In the lack of using the live oil sample for this study, the fluid properties and the experimental asphaltene precipitation data required for building the fluid model are taken from [37]. The composition of this oil is given in Table 2. The oil contains 16.08% (weight) asphaltene in stock tank condition, a reported bubble point pressure of 2950 psi, and a stock tank oil API gravity of 19.0. Moreover, the experimental data of asphaltene precipitation have been reported for the oil sample at 212°F as a function of pressure and are shown in Table 3 [34].
Component
Mole Fraction
Nitrogen
0.57
Carbon Dioxide
2.46
Methane
36.37
Ethane
3.47
Propane
4.05
i-Butane
0.59
n-Butane
1.34
i-Pentane
0.74
n-Pentane
0.83
Hexanes
1.62
Heptane plus
47.96
Total
100.00
C7+ molecular weight
329
C7+ specific gravity
0.9594
Live oil molecular weight
171.4
Stock tank oil API gravity
19.0
Asphaltene content in stock tank oil
16.8 wt%
Reservoir temperature
212°F
Saturation pressure
2950 psi
Table 2.
Experimental fluid properties.
Test pressure, psi
Precipitates live oil, wt%
Precipitates residual STO, wt%
1014.7
0.403
15.73
2014.7
1.037
14.98
3034.7
0.742
15.06
4014.7
0.402
14.86
Table 3.
Experimental asphaltene precipitation at 212°F.
3.3.2 Asphaltene control parameters
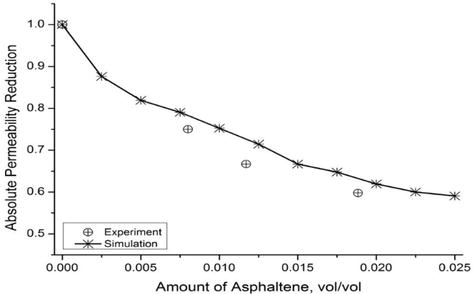
One of the important steps for building a simulation model with asphaltene option is the introduction values for asphaltene control parameters. Typically, they should be adjusted based on core flooding experiment data. The sensitivity studies on the asphaltene control parameters by using the numerical study in two conventional simulators have been done [7]. They have shown that all asphaltene control parameters have affected the reservoir performance during natural depletion, water injection, and WAG application. Moreover, in the literature, there are only a few published core flooding experimental data related to asphaltene deposition and a few studies presented procedures for adjusting the asphaltene control parameters [9, 14]. In this study, the asphaltene control parameters are adjusted based on the evaluation of values of absolute permeability reduction as a function of asphaltene deposition data from core flooding experiments and simulation. The equivalent values for asphaltene deposition during core flooding experiments are computed based on injection rate, total time of simultaneous injection, and average asphaltene weight present in collected oil samples. These values are shown in Figure 13 by scatter points as denoted from the experiment. Typically, the absolute permeability can be correlated to porosity. Therefore, the reduction in absolute permeability because of asphaltene deposition can also be considered using a parameterized power law relationship given the ratio of the instantaneous permeability at time t with respect to the initial porosity and permeability and the volume fraction of asphaltene deposit [25, 34].
Figure 13.
Absolute permeability reduction matching between experiments and simulation.
Therefore, the asphaltene control parameters have been adjusted during a history matching process of the experimental data with those predicted from the numerical simulation. During this attempt, the related values for asphaltene control parameters are changed until an acceptable match between experimental and simulation results are obtained. The comparison between the predicted values from simulation and experimental results of permeability reduction because of asphaltene deposition are shown in Figure 13. Moreover, the obtained values for the asphaltene control parameters by this attempt are shown in Table 4 and used for further asphaltene simulations [34].
Asphaltene Control Parameters
Value
Flocculation Rate Coefficient (day-1)
0.150
Dissociation Rate Coefficient (day-1)
0.001
Adsorption Coefficient (day-1)
0.100
Plugging Coefficient (ft-1)
0.100
Critical Deposition Fraction
0.0
Critical Flocs Concentration
0.0
Permeability Reduction Exponential Index
3
Entrainment Coefficient (ft-1)
0.0
Critical Velocity for Entrainment (ft/day)
2500
Constant of Generalized Einstein Model for Viscosity(Schlumberger, 2011)
2.5
Table 4.
Adjusted asphaltene control parameters.
3.3.3 Relative permeability alteration
The relative permeability alteration during simulation can be considered by using the approach of weight factor F as a function of asphaltene deposit. To use this approach, a table of weight factor F as a function of asphaltene deposition (α∗) and a set of oil-wet relative permeability data should be introduced into simulation file data. The simulator computes the amount of asphaltene deposition in each time step, and it uses Eqs. (1)–(4) to obtain the corresponding relative permeability data for the obtained amount of asphaltene deposition [34]:
Soraα∗=F×Sorooil−wet+1−Fwater−wetE1
Swiaα∗=F×Swiooil−wet+1−F×Swiwwater−wetE2
krwaα∗=F×krwooil−wet+1−F×krwwwater−wetE3
kroaα∗=F×kroooil−wet+1−F×krowwater−wetE4
In this study, to find suitable data for this approach based on the available experimental results, some assumptions must be considered. It is assumed that the relative permeability data obtained during 0% n-heptane-oil injection core flooding experiment are considered as water-wet relative permeability data. Therefore, the corresponding value for the weight factor F for this case is considered equal to zero (F1=0.0). Furthermore, the relative permeability data obtained during 80% n-heptane-oil injection core flooding experiment are considered as oil-wet relative permeability data; consequently, the corresponding values for the weight factor F are considered to be equal to one (F4=1.0).
As a result, the values of the weight factor F for the other two core flooding experiments (20 and 50% n-heptane-oil injection) that amount to their asphaltene deposition are expected between these two cases and should be between zero and one. By using the nonlinear, multiregression analysis for the values of the weight factor F as functions of the amount of asphaltene deposition, the following correlation can be provided to predict the other values for F.
Fα∗=α∗A+Bα∗+Cα∗E5
where the coefficients in Eq. (5) are as follows: A = 0.00582525930049594, B = −0.0914083050003412, C = 0.0910209660724414, and α∗ is the amount of asphaltene deposition [34].
3.3.4 Numerical simulation results
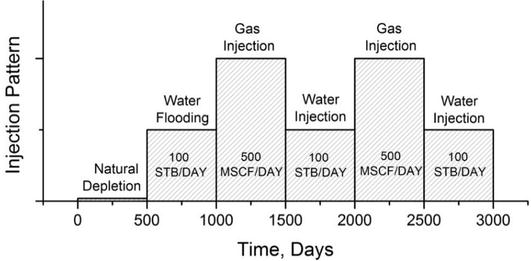
The injection pattern that has been conducted during this simulation is shown in Figure 14. The waterflooding started after 500 days of natural depletion. The two cycles of WAG implementation with 500 days of slugs as the EOR method are considered after the waterflooding process. In this simulation study, two different simulation cases are run to investigate the effect of asphaltene on reservoir performance during WAG implementation. The first case is without considering the asphaltene option, and the second case is with activating the asphaltene option [34].
Figure 14.
Injection pattern during this study simulation.
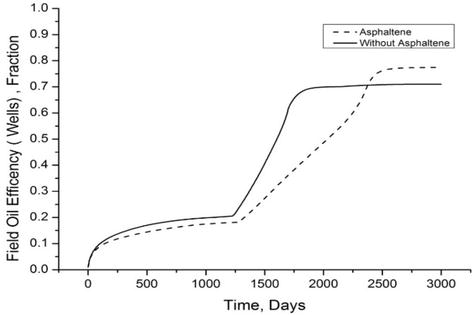
Figure 15 shows the effect of the alteration of relative permeability data from a water-wet to more oil-wet system because of asphaltene deposition on the field oil efficiency based on the production well. As expected, and as can be seen in this figure, the field oil recovery factor for the asphaltene case is almost lower than the case without asphaltene. However, the ultimate oil recovery factor for the asphaltene case is higher than the case without asphaltene. It should be noted that this amount of the ultimate oil recovery factor is achieved by more than three pore volume injections. Furthermore, the core flooding results for oil recovery follow these simulation results. However, the question of how practical it is to inject fluid volumes of more than two pore volumes to achieve improvement in oil recovery in the presence of asphaltene deposition remains an important question to answer.
Figure 15.
Field oil efficiency factors.
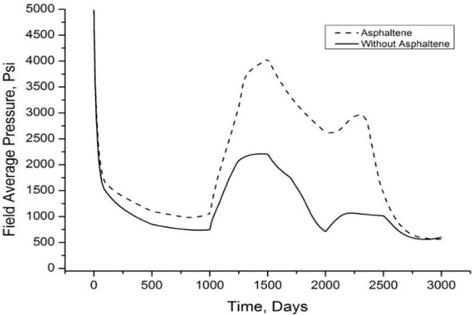
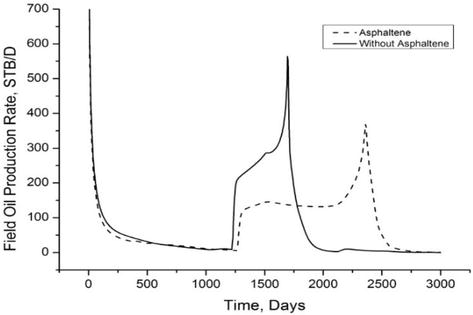
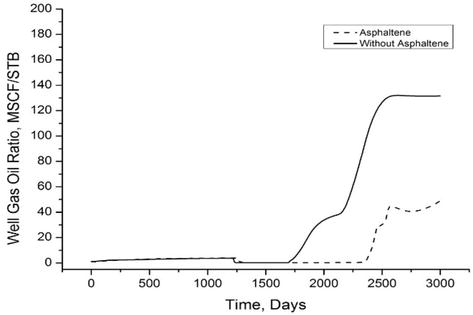
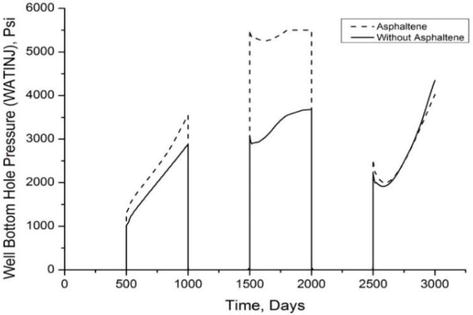
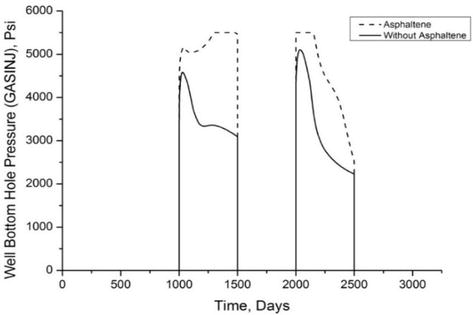
The field oil efficiency based on the production well, the field average pressure, the field oil production rate, and the well gas oil ratio (GOR) for these two cases are investigated (see Figures 16–20). It is shown asphaltene deposition in a porous medium has affected the reservoir performance significantly. For example, Figure 16 shows that the field average pressure values for the asphaltene case are higher than the case without asphaltene. It can be noted that the asphaltene deposition by a reduction in porosity and absolute permeability can cause an increase in average oil reservoir pressure. Moreover, as can be seen, the most increases in the average reservoir pressure values are obtained during CO2 gas injection slugs during WAG implementation periods. These can be related to an increase in the amount of asphaltene deposition because of CO2 gas injection periods. Figure 17 demonstrates that the maximum field oil production rate is obtained for the case without asphaltene. However, as can be seen, the asphaltene case can produce at lower rates compared to that case without asphaltene but in a longer production period, which has improved the ultimate oil recovery. Moreover, as can be seen in this figure, there are two pick points in field oil production curves for both cases. In each case, the field oil production increases during the gas injection but sharply decreases at the pick point. This can be explained in terms of early gas breakthrough time in the case without asphaltene and increasing gas-oil ratio in the production well, see Figure 18. The well bottomhole pressure values for water injection and gas injection wells are given in Figures 19 and 20, respectively. However, it should be mentioned that the production well in both cases is controlled with a bottomhole pressure mode of 500 psi. As shown in these figures, the asphaltene deposition has increased the well bottomhole pressure values. This can be caused by flow issues because of asphaltene deposition that caused some difficulty in terms of injectivity of these wells and in terms of porosity and absolute permeability reduction [34].
Figure 16.
Field average pressure.
Figure 17.
Field oil production rate.
Figure 18.
Well gas oil ratio (GOR) for production well.
Figure 19.
Well bottomhole pressure history during water injection at the injector.
Figure 20.
Well bottomhole pressure history during CO2 injection at the injection well.
From the outcomes of this investigation, we can infer the following conclusions:
Asphaltene deposition alters rock wettability, increases water relative permeability at residual oil saturation, decreases oil relative permeability at irreducible water saturation, and changes the oil-water relative permeability curve cross-point. This suggests a shift from water-wet to more oil-wet or mixed-wet systems.
In water-oil experiments, cumulative oil production decreases within two pore volumes due to the increased asphaltene deposition but ultimately increases over six pore volumes. Multiple mechanisms, including wettability alteration, surface film oil drainage, and interfacial tension changes, may contribute to improved oil recovery.
Asphaltene deposition does not significantly affect gas-oil relative permeability and cumulative oil production in gas-oil systems.
In three-phase systems, oil relative permeability values vary with asphaltene deposition until a certain gas saturation is reached, beyond which they converge, indicating minimal impact.
Corey and LET correlations are the most suitable for history-matching relative permeability curves in water-oil and gas-oil systems.
Nonlinear, multiregression analysis is used to establish correlations from the water and oil relative permeability experimental data based on asphaltene deposition. These correlations can be used in a numerical simulation study.
The modeling and simulation of asphaltene processes during the WAG process in conventional simulators are explored. The field oil recovery factor with asphaltene deposition exceeds that without, though practicality remains uncertain.
Asphaltene deposition increases well bottomhole pressure, potentially affecting flow assurance around wellbores.
Experimental results suggest that varying weight factors for specific asphaltene deposition levels is necessary for accurate modeling, in contrast to the uniform weight factor currently used in conventional simulators.
Suggestions for future research:
Subsequent research should focus on identifying the dominant mechanism, whether wettability alteration, surface film oil drainage, or changes in endpoints, contributing to enhanced oil recovery resulting from asphaltene deposition. Understanding these mechanisms in detail can provide valuable insights for optimizing EOR strategies.
Evaluate the practicality and viability of injecting fluid volumes exceeding two pore volumes to achieve improved oil recovery in the presence of asphaltene precipitation and deposition. This exploration can guide decision-making in field operations and reservoir management.
Enhance the accuracy of conventional compositional simulators by incorporating varying weight factors for specific levels of asphaltene deposition. This can lead to more realistic reservoir simulations and assist in predicting the impact of asphaltene on field production rates and reservoir performance.
The authors express their appreciation to the Carbon Capture & Utilization Department (CCUS) at PETRONAS Company, Malaysia, for generously allowing the publication of this work. Grateful acknowledgments are extended to Universiti Teknologi PETRONAS (UTP) for their indispensable support during this research. Sincere thanks go to Professor Mustafa Onur, McMan Endowed Chair Professor and Director of TU Petroleum Reservoir Exploitation Projects (TUPREP), for his invaluable assistance during my PhD as supervisor and thorough review of this book chapter. Special gratitude is also extended to Universiti Teknologi Malaysia (UTM) for providing the opportunity to collaborate on this publication. Parts of this chapter were previously published in the doctoral thesis by the same author [34].
References
1.Kokal SL, Sayegh SG. Asphaltenes: The cholesterol of petroleum. In: Middle East Oil Show, Bahrain. 1995
2.Nghiem LX, Coombe DA. Modelling asphaltene precipitation during primary depletion. SPE Journal. 1997
3.Wang S, Civan F. Preventing asphaltene deposition in oil reservoirs by early water injection. In: SPE Production Operations Symposium, Oklahoma City, Oklahoma. 2005
4.Mullins OC, Sheu EY, Hammami A, Marshall AG. Asphaltene, Heavy Oils, and Petroleomics. Springer; 2007
5.Jamaluddin AKM, Creek J, Kabir CS, Mcfadden JD, D'Cruz D, Manakalathil J, et al. Laboratory techniques to measure thermodynamic asphaltene instability. Journal of Canadian Petroleum Technology. 2002
6.Mullins OC. Review of the molecular structure and aggregation of asphaltenes and petroleomics. SPE Journal. 2008
7.Khanifar A, Demiral B, Darman N. Study of asphaltene precipitation and deposition phenomenon during WAG application. In: Paper Presented at the 2011 SPE Enhanced Oil Recovery Conference, Kuala Lumpur, Malaysia. 2011. SPE-143488
8.Sanchez NL. A general approach for asphaltene modeling. In: Latin American & Caribbean Petroleum Engineering Conference, Buenos Aires, Argentina. 2007
9.Yi T, Fadili A, Ibrahim MN, Al-Matar BS. Modeling the effect of asphaltene on the development of the Marrat field. In: 8th European Formation Damage Conference, Scheveningen, the Netherlands. 2009
10.Mansoori GA. Remediation of Asphaltene and Heavy Organic Deposits in Oil Wells and in Pipelines. USA: University of Illinois; 2010
11.Negahban S, Joshi N, Jamaluddin AKM, Nighswander J. A systematic approach for experimental study of asphaltene deposition for an Abu Dhabi reservoir under WAG development plan. In: International Symposium on Oilfield Chemistry, Houston, Texas. 2003
12.Rezaian A, Kordestany A, Jamialahmadi M, Moghadasi J, Khoshdaregi MY, Alipanah M, et al. Experimental and theoretical studies of flocculated asphaltene deposition from oil in porous media. In: Trinidad and Tobago Energy Resources Conference, Port of Spain, Trinidad. 2010
13.Shedid SA. Influences of asphaltene deposition on rock/fluid properties of low permeability carbonate reservoirs. In: SPE Middle East Oil Show, Bahrain. 2001
14.Wang S, Civan F. Productivity decline of vertical and horizontal Wells by asphaltene deposition in petroleum reservoirs. In: SPE International Symposium on Oilfield Chemistry, Houston, Texas. 2001
15.Oskui G-RP, Jumaa MA, Abuhained W. Laboratory investigation of asphaltene precipitation problems during CO2/hydrocarbon injection project for EOR application in Kuwaiti reservoirs. In: Kuwait International Petroleum Conference and Exhibition, Kuwait City, Kuwait. 2009
16.Kalantari G, Moghadasi, Abdi R. Formation damage through asphaltene precipitation resulting from CO2 gas injection in Iranian carbonate reservoirs. SPE Production & Operations. 2008
17.Minssieux L. Core damage from crude asphaltene deposition. In: International Symposium on Oilfield Chemistry, Houston, Texas. 1997
18.Alizadeh N, Manshad AK, Fadili A, Leung E, Ashoori S. Simulating the permeability reduction due to asphaltene deposition in porous media. In: International Petroleum Technology Conference, Doha, Qatar. 2009
19.Al-Maamari RSH, Buckley JS. Asphaltene precipitation and alteration of wetting: Can wettability change during oil production? In: SPE/DOE Improved Oil Recovery Symposium, Tulsa, Oklahoma. 2000
20.Khanifar A, Abd Raub MR, Tewari RD, Zain ZM, Sedaralit MF. Experiment aided optimization of IWAG recovery process in a complex field with complex fluid: A case study. In: Paper Presented at the SPE Enhanced Oil Recovery Conference, Kuala Lumpur, Malaysia. 2015. SPE-154152-MS
21.Khanifar A, Abd Raub MR, Tewari RD, Zain ZM, Sedaralit MF. Designing of successful immiscible water alternating gas (IWAG) coreflood experiment. In: Paper Presented at the International Petroleum Technology Conference, Doha, Qatar. 2015. IPTC-154152-MS
22.Khanifar A, Abdul Manap AA. Maximizing oil recovery using a chemical application in offshore environment-case study. In: Paper Presented at the SPE Reservoir Characterization and Simulation Conference and Exhibition, Abu Dhabi, UAE. 2023. SPE-212618-MS
23.Khanifar A, Subari IB, Raub MRA, Tewari RD, Sedaralit MF. The world’s first offshore GASWAG EOR full field implementation. In: Paper Presented at the Abu Dhabi International Petroleum Exhibition & Conference, Abu Dhabi, UAE. 2021. SPE-208127-MS
24.Majidaie S, Khanifar A, Onur M, Tan I. A simulation study of chemically enhanced water alternating gas (CWAG) injection. In: Paper Presented at the SPE EOR Conference at Oil and Gas West Asia, Muscat, Oman. 2012. SPE 154152
25.Civan F. Formation damage mechanisms and their phenomenological modeling—an overview. In: European Formation Damage Conference, Scheveningen, the Netherlands. 2007
26.Agbalaka CC, Dandekar AY, Patil SL, Khataniar S, Hemsath J. The effect of wettability on oil recovery: A review. In: SPE Asia Pacific Oil and Gas Conference and Exhibition, Perth, Australia. 2008
27.Civan F. Reservoir Formation Damage. Houston, Texas: University of Oklahoma; 2000
28.Kamath VA, Yang J, Sharma GD. Effect of asphaltene deposition on dynamic displacements of oil by water. In: SPE Western Regional Meeting, Anchorage, Alaska. 1993
29.Honarpour M, Koederitz L, Harvey AH. Relative Permeability of Petroleum Reservoirs. Boca Raton, Florida: CRC Press; 1988
30.Tarek A. Reservoir Engineering Handbook. 2nd ed. Gulf Professional Publishing; 2001
31.Watt UH. Reservoir Simulation Handnotes. Scotland: Institute of Petroleum Engineering, Heriot-Watt University; 2008
32.Johnson EF, Bossler DP, Naumann VO. Calculation of Relative Permeability from Displacement Experiments. Society of Petroleum Engineers of AIME; 1959
33.Sendra. Sendra User Guide. Norway: Weatherford Petroleum Consultants; 2011
34.Khanifar A. Investigation of the Effect of Asphaltene Presence on Relative Permeability Characteristics during Wag Process [Thesis]. Malaysia: University Technology Petronas; 2013
35.Corey AT. The Interrelation between Gas and Oil Relative Permeabilities. Scinapse; 1954
36.Lomeland F, Ebeltoft E, Thomas WH. A new versatile relative permeability correlation. In: International Symposium of the SCA, Abu Dhabi, UAE. 2008
37.Burke NE, Hobbs RE, Kashou SF. Measurement and modelling of asphaltene precipitation (includes associated paper 23831). SPE Journal of Petroleum Technology. 1990
Written By
Ahmad Khanifar and Mansoor Zoveidavianpoor
Submitted: 20 September 2023Reviewed: 08 November 2023Published: 20 February 2024
 Open access peer-reviewed chapter