Open Access is an initiative that aims to make scientific research freely available to all. To date our community has made over 100 million downloads. It’s based on principles of collaboration, unobstructed discovery, and, most importantly, scientific progression. As PhD students, we found it difficult to access the research we needed, so we decided to create a new Open Access publisher that levels the playing field for scientists across the world. How? By making research easy to access, and puts the academic needs of the researchers before the business interests of publishers.
We are a community of more than 103,000 authors and editors from 3,291 institutions spanning 160 countries, including Nobel Prize winners and some of the world’s most-cited researchers. Publishing on IntechOpen allows authors to earn citations and find new collaborators, meaning more people see your work not only from your own field of study, but from other related fields too.
Understanding sediment transport during sand nourishment and storm events is crucial for coastal management and environmental preservation. This chapter provides key insights for policymakers, coastal engineers, and researchers working to balance coastal protection and ecosystem sustainability. It offers an analysis of suspended particle behavior in the water column post-sand nourishment, a coastal protection measure, in comparison to a natural storm event. This allows estimating spatial and temporal effects of coastal protection measures on turbidity and sedimentation in neighboring areas. Pronounced differences in increased turbidity longevity were observed, with sand nourishment-induced turbidity persisting for at least 3 months, spanning a minimum of 4 km along the coast. Additionally, this study reveals elevated nutrient concentrations in the pore water of nourished sediment and the water column during the sand nourishment, along with an increase in fine sediment particles in the nourished sediment due to the use of sand from sedimentation sinks.
University of Rostock, Biosciences, Aquatic Ecology, Rostock, Germany
Hendrik Schubert
University of Rostock, Biosciences, Aquatic Ecology, Rostock, Germany
*Address all correspondence to: daniela.glueck@uni-rostock.de
1. Introduction
Coastal protection measures are crucial for safeguarding vulnerable coastal areas, but they pose challenges to environments like sandy beaches and dunes, already threatened by issues such as coastal squeeze [1]. The introduction of foreshore structures, especially hard ones, can impact sediment dynamics, hydrodynamics, and depositional processes [2, 3, 4] and influencing the distribution of non-native species [1, 5]. Moreover, protecting cliffs with engineered solutions deactivates them, disrupting sediment supply to beaches and increasing the risk of dune breaches. In areas where dunes serve as the primary coastal protection, preventing breaches is crucial to mitigate the threat of storm surges and floods in the coastal hinterland.
Hence, enhancement of natural coastal protection is increasingly explored, particularly coastal protection through dunes. Strategies involve mitigating sediment transport, stabilizing the coast addressing negative sediment balances. Sand nourishments, regarded as such nature-based coastal protection measures [6, 7], counter sediment deficits caused by the absence of cliff breaks or sediment traps, ensuring coast-parallel sediment transport preventing shoreline retreat. Well-managed dunes play a crucial role in this protection, although wear and erosion are anticipated and the problem of the sediment deficit, which is erosion, is not solved but only the consequences are covered, necessitating regular nourishments for maintenance [8].
There are three primary methods for nourishing sandy beaches, but all involve using dredged marine sands. The first method uses the sand to replenish the entire intertidal zone’s sand budget, while the second and third method aim for installing a sediment budget as reinforcement on the beach and dune, backshore, or in the foreshore area [9, 10]. After deposition of the sand, it is expected that the sediment is redistributed naturally by wave actions and wind [10, 11]. During foreshore nourishments, the sand is mostly dumped or sprayed directly from the ship into the target area while for intertidal or backshore nourishments, the sand needs to be transported onto the beach, for example, with pipelines [10]. However, these marine sediments, characteristic of a marine sea bottom, differ from the nutrient-poor beach and dune ecosystem. Therefore, beach nourishments pose risks by introducing non-native sediments, disturbing natural habitats and dune succession. This includes biota burial and habitat loss [2, 3], along with changes in plant diversity and coverage attributed to significant anthropogenic activity [12, 13], resulting in reduced essential ecosystem functions [14].
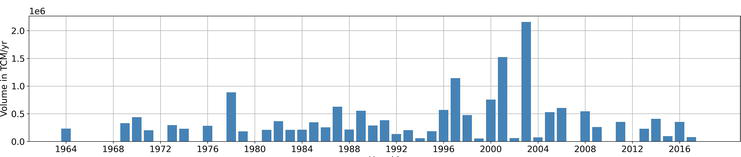
But the more fundamental problem is the availability of suitable sand deposits whose sediment properties match the desired backwash sites. The growing demand for larger sand volumes in nourishments poses a potential future challenge: sediment availability. In Mecklenburg-Western Pomerania, the sand volume used for nourishment has steadily increased over the decades (1964–2016), reaching a peak in 2004 with over 2,000,000 thousand cubic meters of sand [15]. As coastal erosion intensifies with rising sea levels, surpassing this volume becomes a plausible scenario (Figure 1).
Figure 1.
Volume of sand in thousand cubic meters (TCM) used for sand nourishment in Mecklenburg-Western Pomerania between 1964 and 2016 [15].
On the other hand, this could be overcome by generating closed cycles, meaning that the material used for sand nourishment is gathered from the areas where eroded material got deposited.
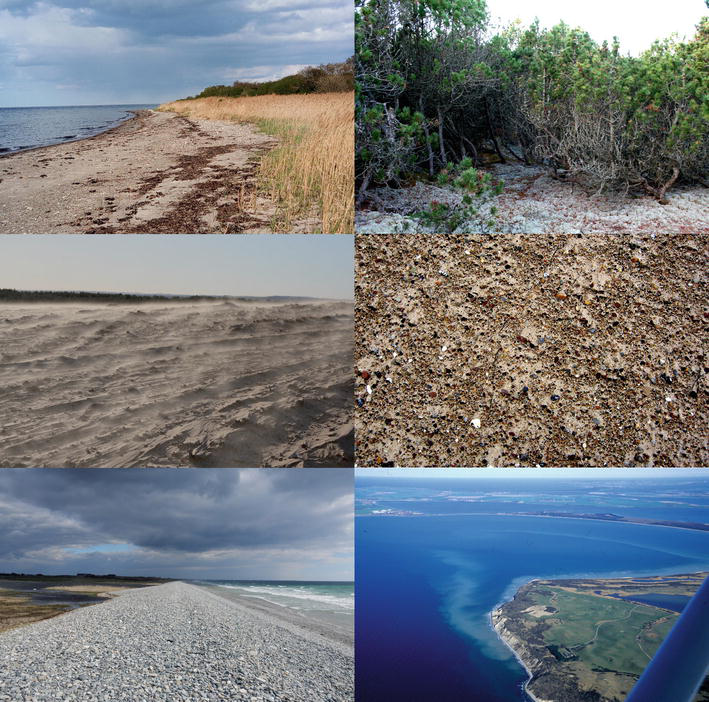
But even doing so, another problem still remains – the disturbance of both, the sand nourishment, as well as the sand extraction ecosystems. Sand nourishment is a massive impact, covering the respective habitat with meters of sand, burying fauna and flora. Especially plants are sensitive because in contrast to fauna, plant diaspores and vegetative parts are restricted in their ability to reach back to the surface by elongation in darkness. However, beach vegetation in most of the cases is rather scarce and ephemeral because of trampling by beach visitors [12] and mechanical disturbance during autumn/winter storms with high water levels. Dune vegetation is in a process of succession, which gets interrupted by the nourishment [16]. This loss of plant cover after sand nourishment provokes increased eolian transport, as depicted in Figure 2, and resets the succession to the white dune stage [17]. Planting suitable species soon after nourishment is consequently part of such coastal protection measures, but still, the system remains in a white dune stage. But given repeated nourishment events, the succession to brown dune with full coverage or even coastal forest with high resistance to flooding and eolian transport erosion is impossible. Sand nourishment therefore must be seen as a massive impact which restores a desired coastal profile on the cost of biodiversity and erosion resistance provided by vegetation cover.
Figure 2.
Examples of erosion effects and protective measures. Upper left: Undisturbed beach stretch at the Danish coast, fully covered by vegetation; upper right: (planted) dune forest, allowing for complete vegetation cover beneath the trees, at north Jylland; middle left: Eolian sand transport at an unvegetated dune; middle right: Surface of a beach treated by sand nourishment after a storm event (Warnemuende) composed of gravel and coarse sand on fine sand; lower left: Gravel dune at the Atlantic coast; fine material has been blown and washed away irrespective of the availability of fine material at the neighbored beach; lower right: Plumes of fine material eroding from the Dornbusch cliff at Hiddensee.
Moreover, extracting sediments from the donor site during nourishment results in habitat loss. Numerous studies have shown that it takes months to years for conditions at the donor site to return to their pre-extraction state [18, 19, 20, 21]. The regeneration timeline is influenced by the extraction method; large-scale dredging creates less deep sediment funnels that replenish more quickly than dredging a limited number of very deep funnels [22, 23].
It must be taken into account that such a reset in dune vegetation succession after a sand nourishment also occurs after storm surges, removing at least part of the dunes [24]. The obvious consequences of sand nourishments for coastal ecosystems, especially increased turbidity and sedimentation in the water column, but also nutrient translocation from the terrestrial part of the beach ecosystem into the aquatic one will occur during such an event too. The same applies for changes in grain size distribution [24] and biodiversity.
So, the question to what extent sand nourishment is comparable to a storm event with respect to duration and strength of mechanical disturbance should be analyzed carefully in order to estimate its overall effect on coastal ecosystems. This applies especially for the Baltic Sea, a microtidal system with pronounced seasonality of storm events [25], where data about the effects of storm surges on nutrient concentration and sedimentation characteristics are scarce.
Our study aims to sort out several key research questions focusing on the dynamics after sediment deposition in coastal areas following sand nourishments in comparison with sediment erosion by storm events:
By investigating sediment composition at the nourishment site, we seek to understand the behavior of the nourished sediment and sediment sorting processes both in the shallow water as well as on the terrestrial part of the coast after sand nourishment.
As the nourished sediment was sourced from deeper deposition sites, it may maintain high nutrient concentrations. Nutrient concentrations in both sediment pores and the water column were measured as we intend to estimate the quantity of released nutrients and the temporal and spatial extent of their impact.
Additionally, we aim to assess the turbidity plume generated by the nourishment, both composition by organic and inorganic particles and its persistence and spatial spread.
For a meaningful comparison of these findings with natural disturbances, specifically storms, we measured identical parameters there.
This comprehensive approach allows us to gain insights into the short-term and long-term effects of sand nourishments on sediment composition, nutrient release, and turbidity, in order to get a basis for evaluation of the ecological impact of this kind of coastal protection by stakeholders as, for example, environmental agencies, policy makers, and governmental bodies responsible for coastal protection.
The following chapter also follows this order of content after an introduction to the study sites and the selected methods. The results are first discussed at regional level before being placed in a wider context. We conclude with a summary of the results and point out further topics that must be taken into consideration when analyzing sediments in the coastal area of the Baltic Sea.
The German Baltic Sea Coast is characterized by extensive flat coasts, presenting sandy beaches and shallow water bodies [26]. The originally highly indented coastline was smoothed by shore parallel sediment transport with capacities up to 200,000 m3 each year [27]. Accumulation of predominantly sandy sedimentary material in calm zones lead to the formation of shallow landforms. Elevated moraine hilltops, remnants of the last ice age, are now connected by narrow land bridges. These land bridges were formed through the erosion of material from the island cores by currents and are now known as the “bodden compensation coast.” Moreover, a formation of shallow and sandy landforms with increasing sealing off of former sea bays (= inland Bodden coast) with partly strongly reduced coastal dynamics and sedimentation processes developed [27].
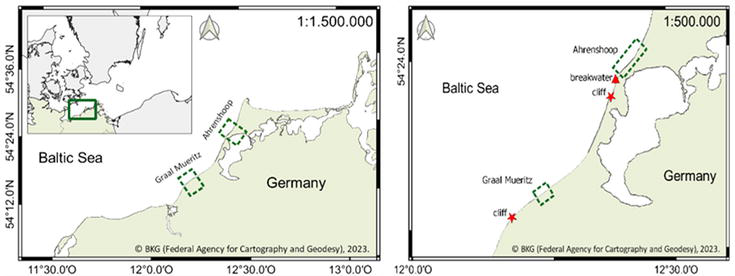
The formation and reshaping of this coastal region is therefore dependent on the sediment supply by erosion of cliffs transported by strong lateral currents. Both sites subject to latest scientific research are located in this area and show this kind of sediment transport but differ regarding their sediment availability (Figure 3). Graal Mueritz receives sediment from sand transported from the more western coast sections, while Ahrenshoop originally also depended on more western cliff breaks for sediment supply. But breakwaters now protect some of these cliffs in the 15 km coastal stretch between the cities. A breakwater just before Ahrenshoop serves as an additional sediment trap to stabilize the shore but hinders lateral sediment transport, impacting the adjacent beach. Due to the absence of sediment supply from cliff breaks, the still high lateral sand transport rates weaken the protective function of the dunes in Ahrenshoop, exposing the city to storm surges. The coastal retreat is up to 50 cm per 100 years decreasing the sand budget of the dune and beach. To counteract this, beach nourishments are carried out every few years [8].
Figure 3.
Map of the nourishment site (Ahrenshoop) and storm site (Graal Mueritz) located at the German Baltic Sea coast in Mecklenburg Western Pomerania in the north-east of Germany. The overview of the Baltic Sea coast with adjacent countries is on the left side. On the right side is the map of the two sites with important landmarks, such as nearby cliffs and breakwater.
Systematic coastal and flood protection at the German Baltic Sea Coast started in the first half of the ninteenth century including dunes stabilized by wooden piles. After more severe storm surges in the second half of the ninteenth and the first half of the twentieth century, these measures were enforced by dikes, followed by groynes, sand nourishments, revetments, and more [27]. The dike in Ahrenshoop was built in 1959, the breakwater in 1986, and the groynes in 2006 all support the national coastal protection dune which was already nourished six times in this century [28].
During the most recent nourishment in winter 2021/22, approximately 600 thousand cubic meters of sand were deposited along a 4 km stretch of beach and dune. A duker connected the dredging vessel to the beach, allowing sediment to be flushed through to the beach. Heavy machinery on the beach then distributed the sediment, shaping the new contours and slope of the dune and beach. The desired dune crest height was 5 m with a seaward dune foot height of additional 2 m. The inclination of the seaward slope was 1.3, the beach slope 1.25, and the underwater slope 1.3. A surface protection by planting of more than 50.000 m2 of marram grass Ammophila arenaria ended the measure [28].
In Graal Mueritz, the changes in dune and beach profile are not changing as much as in Ahrenshoop. The natural coastal protection by the coastal dunes in combination with groynes is enough to ensure the safety of the population protected by coastal measures. There are no additional sand nourishments necessary to support the sediment transport toward the beach and dune.
As already mentioned, the distance between the two sites representing exemplary sediment transport conditions is very small with only 15 km. Both sites are located in the southeastern part of the Baltic Sea which is described as a coastal sand accumulation zone consisting of sand bottom based on sand and small gravel [26]. Both sites are subjected to the same wind and wave regime [29], and the hydrological and oceanographical (salinity, temperature) conditions are identical [26]. The sediment characteristics before the nourishment were similar for both mean grain size, 0.3291 ± 0.0883 mm in Ahrenshoop and 0.2778 ± 0.0582 mm in Graal Mueritz, and sorting grade, 1.2589 ± 0.3662 in Ahrenhoop and 1.3011 ± 0.3156 in Graal Mueritz.
For the comparison of the two events at the sampling site, sediment cores and water samples were taken. The upper 20 cm sediment was analyzed for grain size distribution [30] and water content [31], sorting grade [30], and organic and carbonate content [32].
The mean grain size (MGS) of each sediment sample was determined according to the following equation (Eq. (1)) [30]:
MGS=A∗bB∗cE1
with A = difference between the two sieve sizes between which the average grain size lies, b = 50 minus the sum of percentages of all fractions below 50%, B = percentage value of the fraction that exceeds 50% when adding up the percentages, starting with the smallest fraction, and c = size of the sieve of B.
The sorting grade(s) of each sediment sample was determined according to the following equation (Eq. (2)) [30]:
s=3∗H+N−100100E2
with H = percentage of main sediment fraction and N = sum of the main fraction’s neighboring fractions.
Suspended particles in the water samples were filtered through a glass fiber filter (pore size = 0.4 μm). The filters were burned at 550°C for 4 h for ignition loss to determine the organic portion. Nutrient concentration was analyzed using the spectrophotometric method by an UV/VIS Spectrometer (Lambda 2, Perkin Elmer) [33]. A pre-experiment showed that surface water samples are sufficient for comparison [29]. The water depth was 4 m at both sites. The water samples in Ahrenshoop were collected from a drifting research vessel. The water samples in Graal Mueritz were taken from a sea bridge that extended about 100 m into the Baltic Sea.
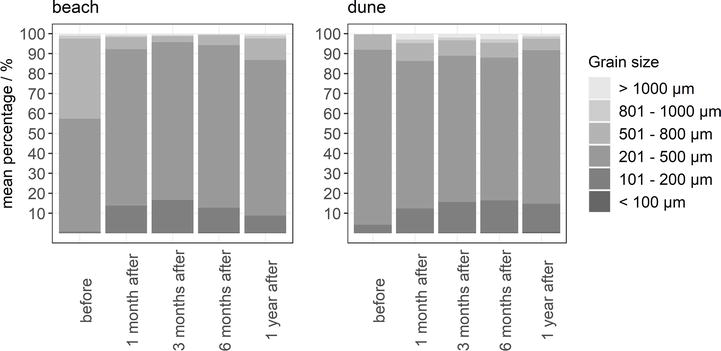
During the nourishment campaign, 600.000 m3 of sand were deposited along a 4 km long beach stretch at Ahrenshoop. Related to the area (0.4 km2), this means a cover of about 1.5 m thickness of allochthonous material. As can be seen from Figure 4, the nourished beach differs largely from the previous state with respect to grain size distribution. In general, the excavated material had higher proportions of fine material with large differences between the samples taken a feature which could still be observed after 1 year. A distinct difference between beach and dune was the relatively high proportion of fractions >500 μm at the beach compared to the dune before nourishment. This can be explained by preferential erosion of fine material during flooding events at the beach. Consequently, a slight increase in the percentage of coarse material within a year after nourishment can be observed at the beach, but not at the dune.
Figure 4.
Grain size composition at the nourishment site. Shown is the percentage of the different grain size classes at the beach (left panel) and dune (right panel) before and after the sand nourishment.
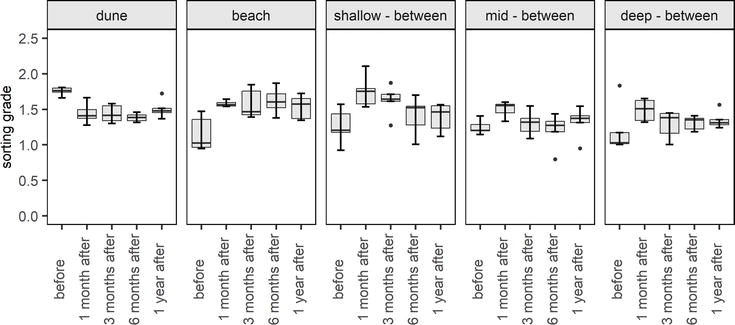
This assumption is supported by the results of calculation of sorting grade, shown in Figure 5. The highest sorting grade was observed at the dune prior to nourishment. Dune systems are built by eolian transport, accumulating mainly highly mobile fine material [34]. Coarse material, as introduced by nourishment, will not be blown away and remains at the surface until being covered by fine material again, a process which seems to take more than the year covered by our observation. Consequently, sorting grade dropped after nourishment and remained low. In this case, one can speculate that such a nourishment with coarser fractions may contribute to the resistance of dune systems against eolian erosion [35]. Such reduction of transversal transport may negatively impact leeward areas in a dynamic system similar to the effects described after protection measures against cliff erosion [36].
Figure 5.
Sorting grade kinetics at different sections after nourishment. Shown are temporal changes in sorting grade before and after sand nourishment at Ahrenshoop at the dune, the beach, and the midsections between groyne lines in front of the beach (“shallow”), halfway the groyne line (“mid”), and at the end of the groyne line (“deep”).
In contrast to this, sorting grade at the beach and shallow water between the groyne lines increased sharply by the nourishment. All these sections are prone to wave action, washing away fine material and leaving coarse fractions. At the beach, eolian transport may similarly contribute to this with a net loss of fine fractions to the dunes which, at least when being vegetated, act as sinks.
As can be seen from Figure 5, the excavated material, taken from sedimentation areas, is more sorted than the material left at the exposed erosion areas. However, onset of erosion takes place immediately and within 1 year sorting grade of the wave-action exposed sites fall back to the initial value. A similar trend can be observed at the beach, but readjustment is not finished within a year probably because eolian transport being a less efficient erosion process compared to continuous wave action.
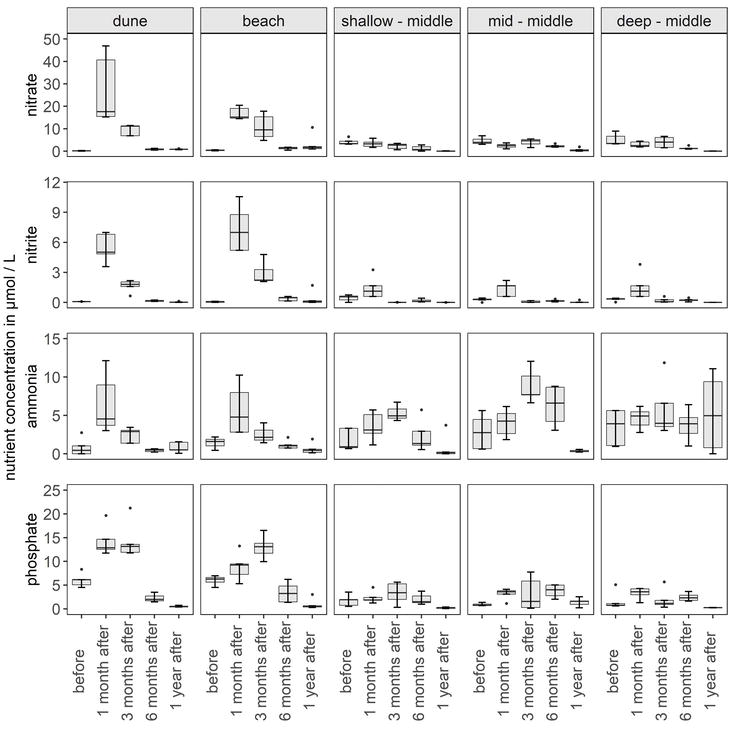
All data presented so far indicate fast erosion of fine material at the beach and the offshore water sections. Originating from sedimentation sinks, the excavated material is rich in organic material (see Table 1) and, consequently, nutrients. This can be seen by the high concentrations of dissolved nitrogen species and phosphate in the pore water of the fresh material shown in Figure 6. Exposed to erosion, these nutrients are released into the water column, resulting in a fast drop of pore water concentrations which fell back to the original levels within half a year.
Grain size/mm
Sorting grade
Water content/% of wet weight
Organic content/% of dry weight
Carbonate content/% of dry weight
0,270 ± 0,005
1388 ± 0,460
8658 ± 1248
10,090 ± 1450
0,501 ± 0,060
Table 1.
Sediment characteristics of the nourished sediment taken from sediment cores at the sand depot site.
Grain size in mm, sorting grade, water content in % of total wet weight, organic and carbonate content in % of total dry weight are shown, both mean and standard deviation.
Figure 6.
Temporal development of the nutrient concentrations (nitrate, nitrite, ammonia, and phosphate) in μmol per L in the pore water of the sediment cores taken at the nourishment site (Ahrenshoop): Ahrenshoop at the dune, the beach, and the midsections between groyne lines in front of the beach (“shallow”), halfway the groyne line (“mid”), and at the end of the groyne line (“deep”). At the nourishment site, samples were taken before and during the nourishment as well as after the nourishment: 1 month, 3 months, 6 months, and 1 year after.
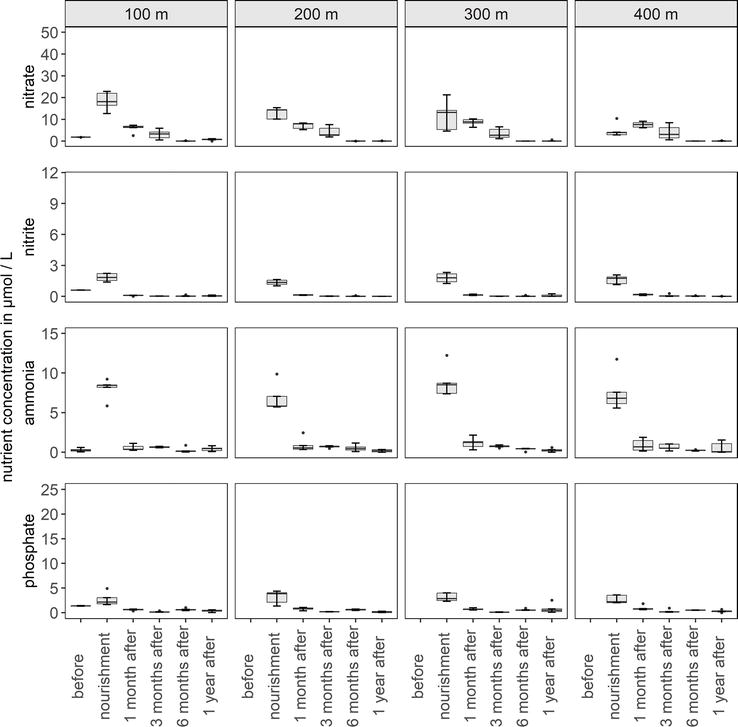
In the water column, the effect is even less pronounced. Phosphate and reduced nitrogen species exhibited elevated levels only during nourishment, when being washed out directly (Figure 7). After nourishment, the remaining release from pore water (compare Figure 6) seems to be converted immediately by plankton organisms which have been shown to be incredibly fast in nutrient uptake, for example, incorporating pulses of DIP into BM within 30 minutes [37]. This does not apply for nitrate, where elevated levels could be observed for about half a year. In this case, seasonality of the nutrient limitation regime must be taken into account. As shown by several authors [38, 39], autotrophs of the coastal systems of this part of the Baltic are N-limited during summer only, whereas in winter, energy limitation is dominating. Decrease of DIN therefore occurs at late spring, when N-limitation becomes effective and priming cyanobacterial development [40]. Nitrite and ammonia are not only N-sources for autotrophs but also used by prokaryotes as a source for energy as long as oxygen is available [41]. Therefore, the sharp drop of these oxygenation-sensitive N-species reflects bacterial activity, converting them to nitrate and/or N2 [41]. However, bacterial growth requires phosphate, and the increased bacterial activity by organic material and reduced N-species provided by the nourishment here contributes to the fast decline in DIP observed.
Figure 7.
Temporal development of the nutrient concentrations (nitrate, nitrite, ammonia, and phosphate) in μmol per L in the surface water samples taken at the nourishment site (Ahrenshoop) at different distances to the shore: 100, 200, 300, and 400 m. At the nourishment site, samples were taken before and during the nourishment as well as after the nourishment: 1 month, 3 months, 6 months, and 1 year after.
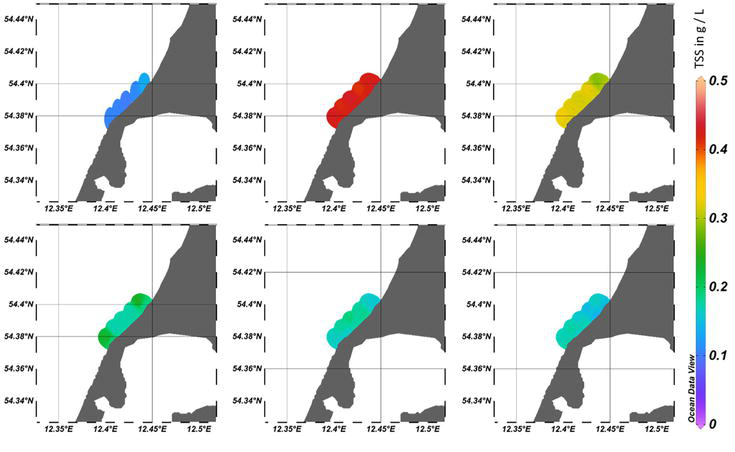
The concentration of suspended solids (TSS) in the water column increased within a range of minimum 100 to 400 m from the nourished shore during the nourishment process. The resulting turbidity plume, as illustrated in Figure 8, extended along the coast for a minimum of 4 km. It is noteworthy that the sand nourishment occurred sequentially in specific locations, estimated to span approximately 50 to 100 m in length, with no simultaneous actions taking place. As soon as one of those locations was finished, the nourishment moved to the next section. Despite this, the turbidity originating from where the sand was nourished, was carried by waves and currents throughout the surrounding water column, dispersing along the coast. The precise dimensions of this turbidity plume were not determined due to unexpected extension and limitations in the sampling plan, which allowed for sampling within a 4 km radius along the coast of Ahrenshoop. But in this radius of 4 km, elevated turbidity was measured during the sand nourishment. The extension of the turbidity plume into the Baltic Sea cannot be precisely determined, but we assume it to exceed 400 m, as we measured still elevated turbidity at this distance. The turbidity plume caused by sand nourishments are therefore not spatially limited to the exact nourishment site but can spread a long distance along the coast and into the open sea. This is especially important for coasts with a strong lateral current, such as the Baltic Sea.
Figure 8.
Mean total suspended solids (TSS) in g per L in the surface water samples at the nourishment site (Ahrenshoop), from left to right: Upper row – Before, during, and 1 month after the sand nourishment; lower row – 3 months, 6 months, and 1 year after the nourishment. Red colors indicate high TSS concentrations, while blue colors indicate a lower concentration. The samples were taken along a 4 km long coastal section and up to 400 m away from the beach.
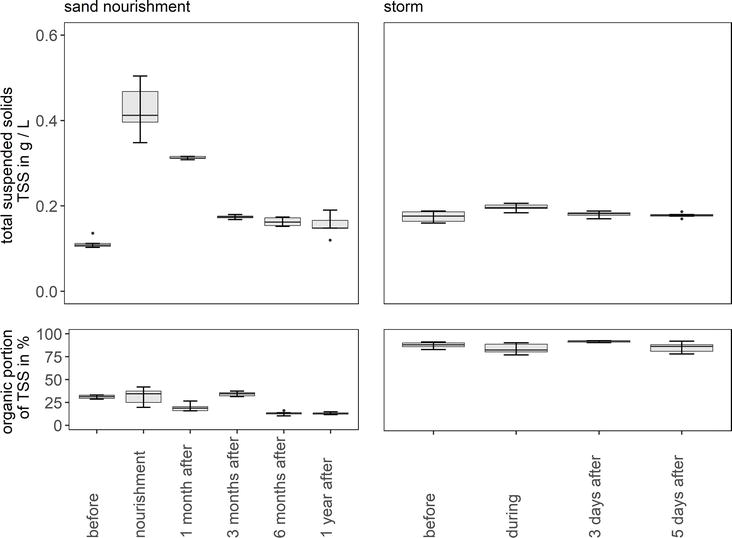
Although elevated turbidity persisted 1 month post-nourishment, it gradually diminished and was no longer detectable by 6 months after the nourishment, see Figure 9. The organic content of these suspended solids was generally low and even lower post-nourishment, constituting only about 25% of the TSS. Homogeneity of TSS concentration throughout the water column during sand nourishments was demonstrated in Ahrenshoop [26] and by similar studies elsewhere [42].
Figure 9.
Total suspended solids (TSS) in g per L and organic portion of TSS in % in the surface water samples at 100 m distance to shore at the nourishment site (Ahrenshoop, on the left side) in comparison with the TSS during a storm (Graal Mueritz, on the right side). At the nourishment site, samples were taken before and during the nourishment as well as after the nourishment: 1 month, 3 months, 6 months, and 1 year after. The storm samples were taken before and during the storm, as well as three and 5 days after the storm.
In contrast to nourishments in other coastal areas, TSS levels were notably higher during the Ahrenshoop nourishment [42, 43]. This difference could be attributed to either a generally higher basal TSS in the Baltic Sea or seasonal variations. However, seasonal influence was ruled out as measurements taken 1 year post-nourishment occurred during the same season as the nourishment itself. One year after the coastal intervention, during the same seasons as the nourishment was performed, TSS levels returned to a low state, resembling pre-nourishment conditions. This suggests that the baseline turbidity of the Baltic Sea might be inherently higher than that of other oceans.
The sedimentation process was not quantified due to the low particle concentration, averaging around 0.4 g/L during the nourishment. Consequently, the heightened turbidity did not impact the submerged vegetation, primarily composed of macroalgae attached to hard substrates. Despite sediment conditions indicating a potential habitat based on mean grain size, seagrass was not identified in the area. The macroalgae predominantly attached to wooden groynes near the shore, representing the sole hard substrate in that area.
To assess and classify such an artificial event and its repercussions, it was essential to compare it with a natural event, such as a storm event (Figure 9). During the sand nourishment, a significant amount of suspended material was observed in the water column, but the organic component was relatively low. Conversely, during the storm, the situation was reversed. Although the total suspended solids (TSS) concentration was lower than during the nourishment, the organic fraction increased. This pattern persisted in measurements taken before and after the storm. Overall, the turbidity caused by the storm diminished within a few days, showing pronounced differences with respect to longevity in comparison to the turbidity plume caused by sand nourishment.
The explanation for the different extension, both spatially and temporarily of those turbidity plumes, lies in the organic content of the sediment. At the extraction site, where sediment was sourced for nourishment, the organic content remained around 10% of the wet weight (Table 1). However, due to the extraction technique, these organic particles were washed out before reaching the nourishment site. After extracting the sediment, the drain of excess water takes place before the vessel moves to the nourishment site [42], creating another turbidity plume. This plume consists of very fine sediment fractions indicating that most of the organic content is left at the dredging site [44]. As a result, the sediment arriving at the nourishment site had low organic material, causing the turbidity plume to consist mainly of inorganic material like very fine sands and silts. The organic content at coastal sites where sand nourishments take place is usually decreased averaging below 2% [45]. Even months after the nourishment, the organic content in the suspended solids in the water column remained very low. In contrast, at the storm site, the sediment is richer in organic content as no organic-poor sediment is nourished there, leading to suspended solids composed mostly of organic material.
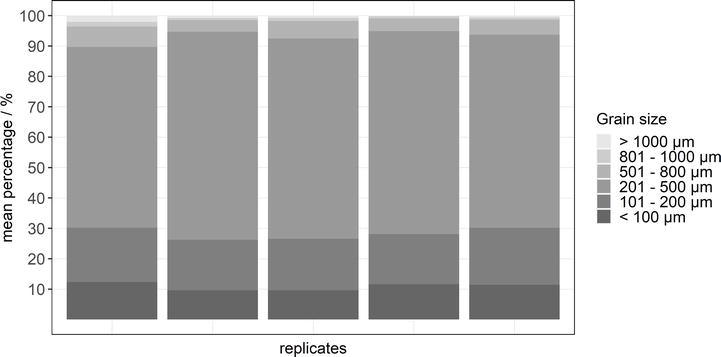
A substantial portion of the nourished sediment comprised very fine grain sizes (Figure 10). Approximately 10% of the sample fell below 63 μm, and nearly 20% ranged around 100 μm. The predominant fraction, constituting over 60% of the sediment, fell between 200 and 500 μm, categorized as middle sand. Coarser fractions collectively accounted for less than 10%. These findings align with the composition of the turbidity plume at the nourishment site, mainly consisting of inorganic but very fine material. This material was rinsed from the beach during the nourishment, accumulating in the water column and becoming suspended from the sea floor by waves and currents.
Figure 10.
Percentage of the different grain size classes at the sand depot site. This sediment was used for the sand nourishment in Ahrenshoop.
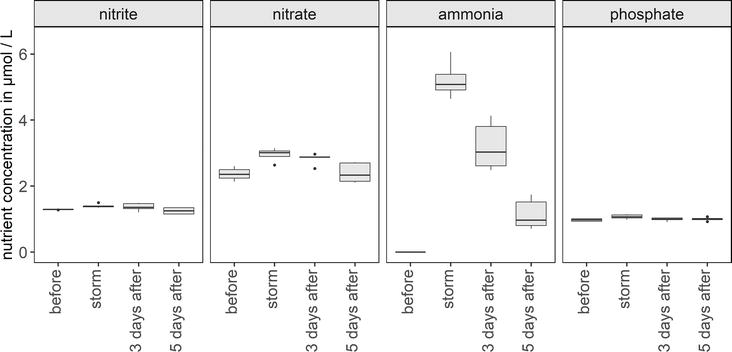
In addition to an elevated concentration of total suspended solids (TSS) during storm events, there was also an increase in nutrient concentrations (Figure 11). However, this increase was relatively small compared to the impact of the sand nourishment. Nitrite and phosphate, in particular, exhibited minimal changes, while nitrate and ammonia concentrations mostly increased, returning to pre-storm levels after 5 days. The nutrient concentrations during the storm were lower than during the nourishment because no additional sediment from deeper layers of the sea bottom, enriched with nutrients, was deposited at the storm site. Consequently, there were no heightened nutrient concentrations within the sediment that could be washed out by increased waves and currents during the storm event.
Figure 11.
Temporal development of the nutrient concentrations (nitrate, nitrite, ammonia, and phosphate) in μmol per L in the surface water samples taken at the storm site (Graal Mueritz) before, during, and after the storm.
Regrettably, all samples collected during the storm event were taken from the water surface due to the impossibility of sampling from deeper layers. The paramount concern for human safety during the samplings led to challenging conditions, hindering sampling from multiple water depths. The waves and currents posed risks, making secure sampling unfeasible. As a result, it is plausible that TSS and nutrient concentrations during storms may differ between surface samples and samples from the sea bottom, with the latter potentially exceeding concentrations measured before.
Increased turbidity is a common observation during and after sand nourishments in various studies [9, 46, 47, 48]. But as the baseline turbidity in the Baltic Sea, ranging usually between 0.1 and 0.3 g/L, already surpasses that of other oceans by the factor 50 [29], and this results in significantly higher turbidity levels during and post-sand nourishments. This regional irregularity underscores the unique environmental dynamics influencing the impact of coastal activities on turbidity in the Baltic Sea.
The results of this research indicate that the effects of sand nourishments disappear within an acceptable period of about 6 months at the deposition site, but also indicate strong effects on the decomposition site. Only limited studies focus on the sediment deposition site, the source of sediment for sand nourishment. The existing research highlights that habitat restoration may require decades once sediment is extracted and depending on the extraction method, large holes in the seafloor can form, filling with organic material and leading to anoxic conditions. Consistent with these findings and shown here, a substantial part of organic material and fine grain size classes are lost already during the extraction process. This means that buried organic material is resuspended in the water column and subsequently forms a fluffy layer, which alters the oxygen balance of the upper sediment layers and has a negative effect on the infauna at the extraction site [49]. Consequently, the turbidity plume and nutrient concentrations at the extraction site should be investigated and taken into account as well.
Most of these effects are not in the focus of the local stakeholders responsible for coastal protection, but should be assessed in more detail to allow for optimization of the whole coastal process.
It is also important to note that this study, comparing the impact of nourishments and storms on sandy shores in the Baltic Sea, warrants careful consideration. Variations in TSS concentrations between surface and sea bottom samples are possible, but collection of the latter was not possible while prioritizing human safety during sampling. Therefore, further research should include turbidity measurements at multiple water depths during storm events to rule out the possibility of stratification of turbidity even at low water depths, as is the case in the Baltic Sea. A comparison at calm weather conditions was already performed [29]. Ongoing advancements in measuring devices will help to enhance data accuracy, as new devices are currently in development and construction.
The study assessed the effects of beach nourishment with respect to the impact on grain size distribution and nutrient concentration changes at the aquatic and terrestrial part. It must be taken into account that the studied sites are located in the microtidal Baltic Sea, differing largely from tidal coasts with respect to wave action along the littoral coastal gradient.
The results showed that the sand nourishment resulted in a long-lasting shift of grain size distribution and sorting grade of dune systems and beaches due to the increase of finer sediments, whereas in the aquatic part, the impact vanished within about 6 months. For nutrients, pore water concentrations of dissolved inorganic nitrogen as well as phosphate fell back to the original values within 6 months; in the open water, the effect of the nourishment campaign vanished even faster except for nitrate. Elevated nitrate concentrations were still detectable 3 months after the sand nourishment. This difference between nutrient kinetics can be explained by the seasonal limitation regime of the study area with an onset of nitrogen limitation in early summer.
For turbidity, the same applies. After 1 year, TSS returned from 0.4231 ± 0.0110 g/L during the nourishment to levels similar to previous to the nourishment with 0.1634 ± 0.0211 g/L, which is in good agreement with the loss of fine material in the shallow water regions of the nourishment area. Summarizing sand nourishment can be characterized as a heavy, but surprisingly short-term impact for the aquatic part of the coastal ecosystem as most effects can no longer be detected after 6 months. For the terrestrial part, mid-term effects at least must be taken into account lasting for at least 6 months, most prominent changes in grain size distribution of the dune influencing its eolian erosion resistance and consequently also alongshore sand transport.
Comparing sand nourishment with a storm event, striking differences were found especially with respect to nutrients. In general, the nutrient concentration was lower with around 5.9419 ± 1.5221 μmol/L during storm events than during the nourishment, where concentrations reached 7.8270 ± 1.8676 μmol/L. Ammonia exhibited the most pronounced kinetics after a storm, which can be explained by the high organic content of the resuspended material. For quantification of the global effects, it should be taken into account that a storm event impacts large areas, whereas sand nourishment concentrates on small spots. However, in both cases, the nutrient pulses were taken up by the biota within short time.
While concluding that the nourishment effects are vanishing within an acceptable time frame of about 6 months at the deposition site, the results also point to heavy impact on the extraction site. But another problem still to be investigated is toxic substances. During extraction, continuous control for explosives and military debris takes place. But other toxic substances have polluted the coastal seas as well, part of them accumulating in sedimentation sinks [50]. Routine assessment for such substances should be performed to prevent the pollution of recreation areas via sand nourishment.
The study presented here must be taken as a site-specific example where the pre-nourishment situation should not be mistaken as a “natural state.” At Ahrenshoop, the neighboring cliff, which under natural conditions would be the source of material to keep the beach’s matter balance, has been protected by a wall. Consequently, natural beach erosion is not balanced anymore by cliff erosion with consequences also for the factors (pore water nutrient content and grain size distribution) studied here. The pre-nourishment data therefore do not reflect a natural situation, but the equilibrium state of an altered system is kept by repeated sand nourishments. For assessing a natural state, more research on nutrient and sediment dynamics on unaltered cliff erosion-beach deposition systems are required.
This work was supported by a BMBF-funded project (ECAS-Baltic, FKZ 03F0860F) which is gratefully acknowledged. Special thanks go to the crew of the LIMANDA, the StALU MM, and all scientific divers supporting the samplings.
References
1.Firth LB, Knights AM, Bridger D, Evans AJ, Mieszkowska N, Moore P, et al. Ocean sprawl: Challenges and opportunities for biodiversity management in a changing world. In: Hughes RN, Hughes DJ, Smith IP, Dale AC, editors. Oceanography and Marine Biology: An Annual Review. Vol. 54. Boca Raton: Taylor & Francis; 2016. pp. 189-262
2.Dugan JE, Airoldi L, Chapman MG, Walker SJ, Schlacher T. Estuarine and Coastal Structures. In: Treatise on Estuarine and Coastal Science. Amsterdam: Elsevier; 2011. pp. 17-41
3.Schoonees T, Gijón Mancheño A, Scheres B, Bouma TJ, Silva R, Schlurmann T, et al. Hard structures for coastal protection, towards greener designs. Estuaries and Coasts. 2019;42(7):1709-1729
4.van Rijn LC. Design of hard coastal structures against erosion; Available from: www.leovanrijn-sediment.com [Accessed: October 17, 2023]
5.Beck M, Airoldi L. Loss, status and trends for coastal marine habitats of Europe. In: Gibson R, Atkinson R, Gordon J, editors. Oceanography and Marine Biology: An Annual Review. Vol. 45. Boca Raton: Taylor & Francis; 2007. pp. 345-405
6.Pontee N, Narayan S, Beck MW, Hosking AH. Nature-based solutions: Lessons from around the world. Proceedings of the Institution of Civil Engineers - Maritime Engineering. 2016;169(1):29-36
7.Silva R, Martínez ML, Hesp PA, Catalan P, Osorio AF, Martell R, et al. Present and future challenges of coastal erosion in Latin America. Journal of Coastal Research. 2014;71:1-16
8.Kortekaas S, Bagdanaviciute I, Gyssels P, Huerta JMA, Héquette A. Assessment of the effects of marine aggregate extraction on the coastline: An example from the German Baltic Sea Coast. Journal of Coastal Research. 2010;51:205-214
9.Nordstrom KF, Jackson NL, Pranzini E. Beach sediment alteration by natural processes and human actions: Elba Island, Italy. Annals of the Association of American Geographers. 2004;94(4):794-806
10.Speybroeck J, Bonte D, Courtens W, Gheskiere T, Grootaert P, Maelfait J-P, et al. Beach nourishment: An ecologically sound coastal defence alternative? A review. Aquatic Conservation: Marine and Freshwater Ecosystems. 2006;16(4):419-435
11.Nordstrom KF. Beach nourishment and coastal habitats: Research needs to improve compatibility. Restoration Ecology. 2005;13(1):215-222
12.Grunewald R. Assessment of damages from recreational activities on coastal dunes of the southern Baltic Sea. Journal of Coastal Research. 2006;225:1145-1157
13.Grunewald R, Schubert H. The definition of a new plant diversity index H′dune for assessing human damage on coastal dunes - derived from the Shannon index of entropy H′. Ecological Indicators. 2007;7(1):1-21
14.Jordan P, Fröhle P. Bridging the gap between coastal engineering and nature conservation? Journal of Coastal Conservation. 2022;26(2):4
15.Tiede J, Jordan C, Moghimi A, Schlurmann T. Long-term shoreline changes at large spatial scales at the Baltic Sea: Remote-sensing based assessment and potential drivers. Frontiers in Marine Science. 2023;10:1207524
16.Miyanishi K, Johnson EA. Coastal dune succession and the reality of dune processes. In: Plant Disturbance Ecology. Amsterdam: Elsevier; 2021. pp. 253-290
17.Arens SM. Patterns of sand transport on vegetated foredunes. Geomorphology. 1996;17(4):339-350
18.Krause JC, Diesing M, Arlt G. The physical and biological impact of sand extraction: A case study of the Western Baltic Sea. Journal of Coastal Research. 2010;51:215-226
19.Mielck F, Hass HC, Michaelis R, Sander L, Papenmeier S, Wiltshire KH. Morphological changes due to marine aggregate extraction for beach nourishment in the German bight (SE North Sea). Geo-Marine Letters. 2019;39(1):47-58
20.Szymelfenig M, Kotwicki L, Graca B. Benthic re-colonization in post-dredging pits in the Puck Bay (Southern Baltic Sea). Estuarine, Coastal and Shelf Science. 2006;68(3-4):489-498
21.Uścinowicz S, Jegliński W, Miotk-Szpiganowicz G, Nowak J, Pączek U, Przezdziecki P, et al. Impact of sand extraction from the bottom of the southern Baltic Sea on the relief and sediments of the seabed. Oceanologia. 2014;56(4):857-880
22.Staudt F. Sandaufspülungen für den Küstenschutz. Hamburg: Das Vorhaben STENCIL; 2019
23.Staudt F, Gijsman R, Ganal C, Mielck F, Wolbring J, Hass HC, et al. The sustainability of beach nourishments: A review of nourishment and environmental monitoring practice. Journal of Coastal Conservation. 2021;25(2):34
24.Jarmalavičius D, Šmatas V, Stankūnavičius G, Pupienis D, Žilinskas G. Factors controlling coastal erosion during storm events. Journal of Coastal Research. 2016;75(sp1):1112-1116
25.Kullenberg G. Chapter 3: Physical oceanography. In: Voipio A, editor. The Baltic Sea. Amsterdam: Elsevier Scientific Publishing Company; 1981. pp. 135-181
26.Winterhalter B, Flodén T, Ignatius H, Axberg S, Niemisto L. Chapter 1: Geology of the Baltic Sea. In: Voipio A, editor. The Baltic Sea. Amsterdam: Elsevier Scientific Publishing Company; 1981. pp. 27-121
27.Staatliches Amt für Landwirtschaft und Umwelt Mittleres Mecklenburg. Regelwerk Küstenschutz Mecklenburg-Vorpommern; Available from: https://www.stalu-mv.de/mm/Themen/K%C3%BCstenschutz/Regelwerk-K%C3%BCstenschutz-Mecklenburg%E2%80%93Vorpommern/ [Accessed: November 30, 2023]
28.Tiepolt L, Pöhlmann B, Behl H. Ausführungsplanung zum Vorhaben Dünenverstärkung Ahrenshoop - Vordarß. Rostock; 2021
29.Glueck D. Comparison of high turbidity events: Sand nourishments and storm events on sandy beaches at the Baltic Sea, Germany. Marine Pollution Bulletin. 2023;194(Pt A):115389
30.Sindowski K-H. Sedimentpetrographische Methoden zur Untersuchung sandiger Sedimente 1938;29(3-5):196-200
31.Schlungbaum G. Untersuchungen über die Sedimentqualität in den Gewässern der Darß-Zingster-Boddenkette unter Berücksichtigung der Stoffaustauschprozesse zwischen Wasser und Sediment. Habilitation thesis, University of Rostock; 1979
32.Czensny R. Wasser-, Abwasser- und Fischereichemie. Leipzig: Deutscher Verlag für Grundstoffindustrie; 1961
33.Grasshoff K, Kremling K, Ehrhardt M. Methods of Seawater Analysis. 3rd ed. Weinheim, Germany: Wiley VCH Verlag GmbH; 1999
34.Eichmanns C, Schüttrumpf H. Investigating changes in Aeolian sediment transport at coastal dunes and sand trapping fences: A field study on the German coast. JMSE. 2020;8(12):1012
35.Anderson RS. Erosion profiles due to particles entrained by wind: Application of an eolian sediment-transport model. Geological Society of America Bulletin. 1986;97(10):1270
37.Schumann R, Berthold M, Eggert A, Blindow I, Forster S, Schubert H. Short-term variability, long-term trends and seasonal aspects in the Darß-Zingst Bodden chain. In: Schubert H, Müller F, editors. Southern Baltic Coastal Systems Analysis. Vol. 246. Cham: Springer International Publishing; 2023. pp. 117-128
38.Schiewer U. Darß-Zingst Boddens, northern Rügener Boddens and Schlei. Ecological Studies. 2008;197:35-86
39.Schubert H, Wasmund N. Das Phytoplankton des Strelasundes und des Kubitzer Boddens. Meer und Museum. 2005;18:83-89
40.Laamanen M, Kuosa H. Annual variability of biomass and heterocysts of the N2-fixing cyanobacterium Aphanizomenon flos-aquae in the Baltic Sea with reference to anabaena spp. and Nodularia spumigena. Boreal Environment Research. 2005;10:19-30
41.Schneider B, Dellwig O, Kuliński K, Omstedt A, Pollehne F, Rehder G, et al. Biogeochemical cycles. In: Snoeijs-Leijonmalm P, Schubert H, Radziejewska T, editors. Biological Oceanography of the Baltic Sea. Dordrecht: Springer Netherlands; 2017. pp. 87-122
42.Capello M, Cutroneo L, Ferranti MP, Budillon G, Bertolotto RM, Ciappa A, et al. Simulations of dredged sediment spreading on a Posidonia oceanica meadow off the Ligurian coast, Northwestern Mediterranean. Marine Pollution Bulletin. 2014;79(1-2):196-204
43.Wilber DH, Clarke DG, Burlas MH. Suspended sediment concentrations associated with a beach nourishment project on the Northern coast of New Jersey. Journal of Coastal Research. 2006;225:1035-1042
44.Qui W, Sarkar S. Marine technology and SNAME news. Society of Naval Architects & Marine Engineers. 2006;43
45.Colosio F, Abbiati M, Airoldi L. Effects of beach nourishment on sediments and benthic assemblages. Marine Pollution Bulletin. 2007;54(8):1197-1206
46.Manning LM, Peterson CH, Bishop MJ. Dominant macrobenthic populations experience sustained impacts from annual disposal of fine sediments on sandy beaches. Marine Ecology Progress Series. 2014;508:1-15
47.Roegner GC, Fields SA, Henkel SK. Benthic video landers reveal impacts of dredged sediment deposition events on mobile epifauna are acute but transitory. Journal of Experimental Marine Biology and Ecology. 2021;538:151526
48.Roman-Sierra J, Navarro M, Muñoz-Perez JJ, Gomez-Pina G. Turbidity and other effects resulting from Trafalgar sandbank dredging and Palmar Beach nourishment. J. Waterway, port, coastal. Ocean Engineering. 2011;137(6):332-343
49.Zabarte-Maeztu I, Matheson FE, Manley-Harris M, Davies-Colley RJ, Hawes I. Fine sediment effects on seagrasses: A global review, quantitative synthesis and multi-stressor model. Marine Environmental Research. 2021;171:105480
50.Lehtonen KK, Bignert A, Bradschaw C, Broeg K, Schiedek D. Chemical pollution and ecotoxicology. In: Snoeijs-Leijonmalm P, Schubert H, Radziejewska T, editors. Biological Oceanography of the Baltic Sea. Dordrecht: Springer Netherlands; 2017. pp. 547-587
Written By
Daniela Glueck and Hendrik Schubert
Submitted: 11 December 2023Reviewed: 18 December 2023Published: 09 April 2024