Open Access is an initiative that aims to make scientific research freely available to all. To date our community has made over 100 million downloads. It’s based on principles of collaboration, unobstructed discovery, and, most importantly, scientific progression. As PhD students, we found it difficult to access the research we needed, so we decided to create a new Open Access publisher that levels the playing field for scientists across the world. How? By making research easy to access, and puts the academic needs of the researchers before the business interests of publishers.
We are a community of more than 103,000 authors and editors from 3,291 institutions spanning 160 countries, including Nobel Prize winners and some of the world’s most-cited researchers. Publishing on IntechOpen allows authors to earn citations and find new collaborators, meaning more people see your work not only from your own field of study, but from other related fields too.
Hydrology research of peatlands requires accurate data and field research, which is still challenging, especially in Indonesia’s tropical peatlands. Peatlands in Indonesia have been explored and studied, including the peat soil and the community next to the place, requiring wise management. This study covers the challenge of conducting field research in two types of different land characteristics and societies. Hence, it explores how to present the field data. The result shows an appropriate approach to the community by understanding their background is essential. Four years of research in different peatland areas has proven this in either Sumatra Island or Kalimantan Island. The field research data can be presented in short or long intervals. The short data can show crucial details about rainfall-water table elevation (WTE) on one side. On the other hand, the long interval data can present a whole trend rainfall-WTE relationship and the possibility of fire occurrence and indicate the peatland condition, whether it is improving or deteriorating. Different results from both lands show WTE risk, which is indicated by the WTE numbers more than 40 cm below the surface reach exceeding 70%; it can be caused by different land use and intensity of activities.
Civil Engineering Department, Faculty of Engineering, Lambung Mangkurat University, Banjarbaru, Indonesia
Didy Wurjanto
Peatland and Mangrove Restoration Agency, Jakarta, Indonesia
*Address all correspondence to: nilna.amal@ulm.ac.id
1. Introduction
Peatlands in the world only cover 3% of land and surface, but they store one-third of the total world’s soil carbon, making them essential to keep carbon from being released into the atmosphere. Peatlands serve several roles, such as carbon storage and sink, locations for various chemical processes, and water retention, and sometimes contain vegetation and wildlife that differ from other upland ecosystems [1]. Peatlands are located in various regions, both in sub-tropical areas such as in northern Europe and North America, and tropical areas, such as Asia, especially Indonesia. The subject of the studies covers many aspects, from the management of the peat soil, and identification of the damage of the peatland usage to the restoration after disturbance and identifying conditions susceptible to peatland fires possibility [2, 3, 4, 5].
As the largest tropical peatlands area, Indonesia has been the subject of worldwide studies for years, particularly those related to the Mega Rice Project in Central Kalimantan. Although it was recognized as an unsuccessful program, it opened many eyes. It is realized that peatland ecosystems are not only marginal due to their limited properties but also functional areas when approached with a suitable program. The inappropriate approach resulted in several issues, such as soil peat drying, which increases the possibility of fire occurrences and decreases or changes the composition of organisms within that ecosystem. Several parameters are believed to be indicators for identifying damage possibilities. Those are water table elevation (WTE), precipitation, evapotranspiration, and soil moisture [2, 6, 7, 8]. These parameters need to be required as physical properties, and the process, particularly in Indonesia, presents challenges. Unlike in developed countries, meteorological data collected and managed by government institutions are retained for their own purposes and only published as analyses, making it difficult to obtain crucial data like hourly precipitation records or water elevation records at channels. Furthermore, obtaining advanced data such as water table elevation had not been easy in the past, but recently, it has become possible to acquire such data for specific regions. This situation discourages researchers from finding solutions to the challenges it presents. Therefore, this chapter aims to investigate how to conduct field research on the various land-use characteristics of peatlands and how to present the data in a way that is accessible to the stakeholders.
Data on hydrology variables in peatlands is available in both primary and secondary sources. The preliminary data can only be obtained by applying specific equipment at the study location. In the case of tropical peatlands, there are two alternative approaches: a disturbed or undisturbed peatland. A disturbed peatland is easier to access since it often has established paths and is usually located near communities. The main concern is only how to transport the equipment to the location and ensure its safety, even in the presence of many people. The appropriate approach to the nearest community will determine the equipment’s safety. Hiring someone who oversees the installation at times may be the best solution, but it also entails allocating a specific budget for this purpose. Data collection in Padang Island began in 2019. Field research in the Gambut District of South Kalimantan was conducted in 2022, while it was completed in Barito Kuala, South Kalimantan, in 2021. Below, we explain how the field research on Padang Island Riau Province and South Kalimantan was conducted.
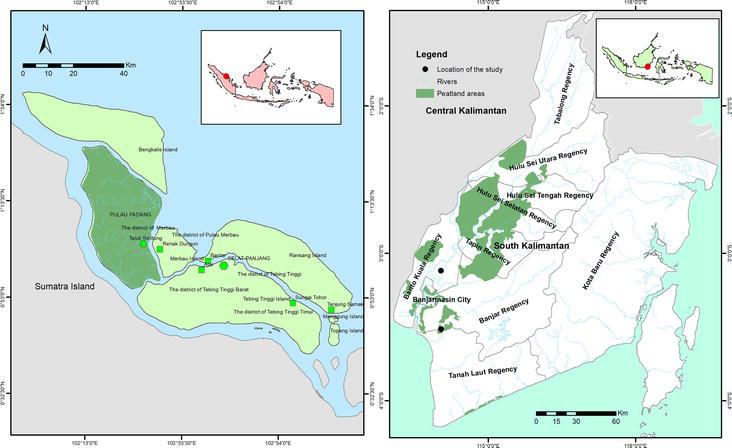
Padang Island is an island in the Malacca Strait, a peatland island located near Sumatra Island. The entire island is predominantly composed of peat soil, surrounded by the ocean. Padang Island is one of a series of four main islands within the Meranti Archipelago Regency, Riau Province. Geographically, Meranti Archipelago Regency is located at 0°42′30″-1°28′0”N and 102°12′0″-103°10′0″E. The climate in Padang Island and the Meranti Archipelago Regency is temperate, with maximum air temperatures ranging from 25–32°C. The details can be seen in Figure 1a. The location of research in South Kalimantan can be seen in Figure 1b. The Meranti Archipelago is situated on the eastern coast of Sumatra Island, with a coastline that borders neighboring countries. Padang Island, one of the peat islands in Riau province, where almost the entire island consists of peat, has been inhabited by the community since the late 19th century. Padang Island’s topography is generally flat, with a maximum elevation of 15 m above mean sea level (MSL), and nearly all settlements are situated at altitudes lower than 6 m above MSL. Several researchers have conducted their study here [9, 10].
Figure 1.
(a) The location of Padang Island Riau Province and (b) the location of South Kalimantan, both in Barito Kuala and Banjar regency.
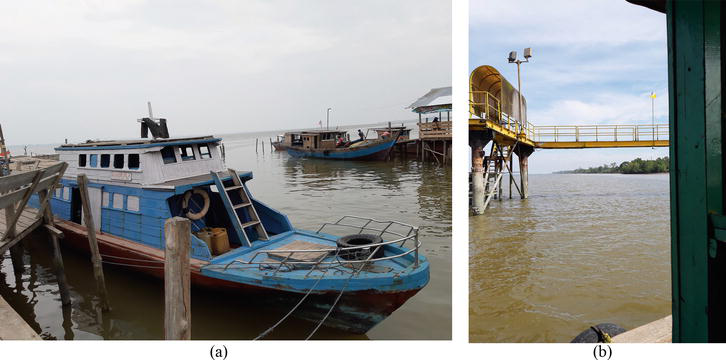
As shown in Figures 1a and 2a,b, reaching Padang Island requires effort. Access to Padang Island is only possible by boat, and the journey takes approximately 45 minutes from the edge of Sumatra Island to the shore of Padang Island using a local boat. The local boat that may be used is depicted in Figure 2a and b. Figure 2a and b illustrates the traditional methods of reaching the location. Nevertheless, several researchers have conducted studies there, as indicated by the following references [9, 11]. The Indonesian government, through Peatland Restoration Agency-Badan Restorasi Gambut (BRG), now known as Peatland and Mangrove Restoration Agency-Badan Restorasi Gambut dan Mangrove (BRGM) – of the Republic of Indonesia, has selected it as a pilot project for monitoring. However, there have been only a few changes there.
Figure 2.
(a) The location of the local port on Sumatra edge and (b) the location of the local port on Padang Island edge.
People around – just like most Indonesians – have rice as their primary food, but they do not have any farming land, so their needs will be provided by other regions outside of the island. The leading factor causing this is either the lack of knowledge of how to implement rice farming on peatland soil or the lack of experience in adopting a farmer’s lifestyle. So, even though it would be better to try to obtain farming land, they will have enough land only for growing vegetables and crops instead, and they will import rice from outside the island.
The water for drinking and other domestic needs is provided by rainfall. They do not have a regional company like other Indonesian areas, namely Perusahaan Air Minum Daerah (PDAM), which serves the water demand for the community. People on Padang Island depend on the amount of water that can be provided by the environment; otherwise, they will use the groundwater storage. The water from the ground has much lower quality than the drinking water standard required by the government. For instance, it has a reddish color, and its pH is 4. Both of these characteristics make it unsuitable for consumption as drinking water. Both conditions, relying solely on rainfall for water and using low-quality groundwater, are not ideal for human beings.
3.1 The challenge in applying the equipment installation
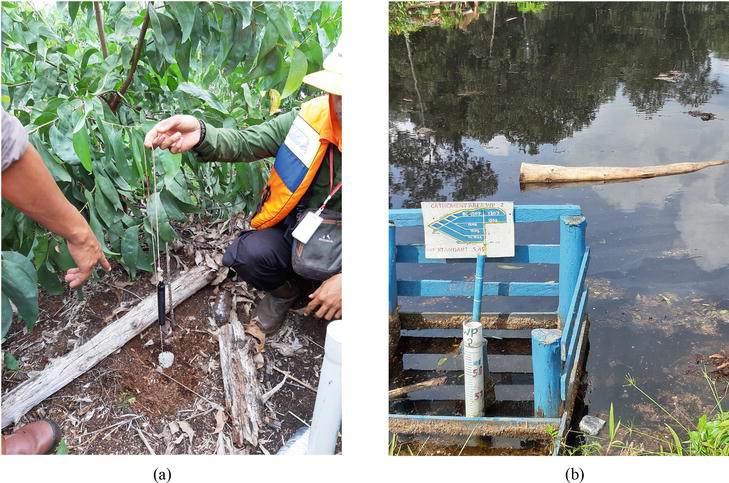
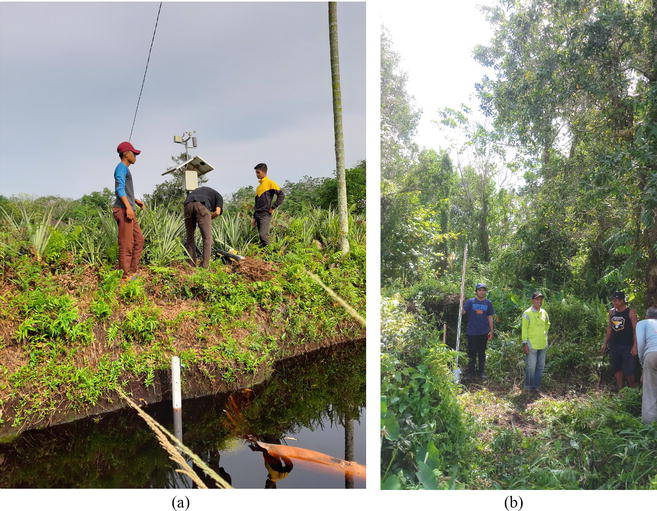
Many companies operate in Padang Island, including the industrial forest plantation company (HTI) PT Riau Andalan Pulp Paper (PT. RAPP), a fiber, pulp, and paper industry. The area around this company serves as an example of drained peatland impacted by it. They collect data, just like Indonesian researchers, for their respective purposes. They have installed their equipment and have been monitoring it for a while. Typically, they collect water table elevation data hourly and observe daily fluctuations in water elevation within the channels. The way they monitor the devices and evaluate the data can be seen in Figure 3a and b. At a particular time, the data can be obtained under specific conditions, exemplified by the collaboration in 2017 between the team from the Engineering Faculty of Universitas Gadjah Mada and BRG. Nevertheless, a similar opportunity did not arise in 2019 when we visited the location to try to obtain their data.
Figure 3.
(a) The location of PT. RAPP data logger and (b) the location of manual water elevation observer.
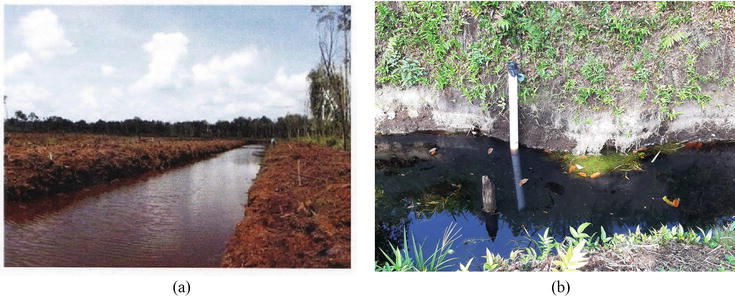
They refused to share their data since the researcher came without authority, even though the letter of recommendation was officially complete. They have been collecting such prestigious data that would not be shared with anyone unless it would provide an advantage for feedback. In 2017, there were no alternatives other than to hand it to the team. It was because the moratorium would be applied when the evidence showed that their activities were causing harm to the environment. The location and the route to access the location of their logger data can be seen in Figure 3a, and the location to measure the manual data for water elevations can be seen in Figure 3b. Their data logger is situated in the middle of the blocks which are filled with plantations such as Acacia Crasicarpa. The canal is distinct from those built in the community. The canal operated by the company is much larger, measuring about six to seven meters in width [12], whereas those in the community are only about two meters wide, as depicted in Figure 4a and b.
Figure 4.
(a) Canals in the company location and (b) the ditch in the community location.
Installing equipment in a peatland location necessitates the adoption of both a mechanical and a social approach. Researchers face various challenges when collecting primary data. One example is when the researchers came there, they were holding the local election at the same time. The event can affect either the process of taking data or the safety of the equipment. Therefore, adopting an approach that allows for effective engagement with the community and ensures unbiased interaction becomes paramount, even when the environmental conditions are generally unsupportive. However, when the equipment is installed adjacent to a company, its safety becomes contingent upon the company’s policies regarding cooperation or refusal. This issue was exemplified by the loss of the last piece of equipment installed in Sei Hiu, located in close proximity to the HTI, shortly after commencing the monitoring of groundwater elevation or water table elevation (WTE) data.
Establishing connections with local communities also requires budget allocation. These hypotheses apply equally in the Gambut District, where the research was conducted there. The locals who support the research can be seen in Figure 5a and b. Furthermore, the area has attracted various farmer activities [13], indicating that it is not an entirely intact peatland. Gambut District is situated in South Kalimantan within Kalimantan Island. It is a part of Banjar Regency and is located adjacent to Banjarbaru City, which is poised to become the future capital of South Kalimantan. This strategic location makes it more accessible than Padang Island. However, the installation of automatic equipment poses budgetary challenges, making the manual option the preferred choice.
Figure 5.
(a) Local community who supported the field research in Padang Island, (b) local community who supported the field research in Gambut District.
Applying water table equipment on a national scale requires regulations suitable for most regions, considering both the physical and the community conditions. BRGM has considered these needs and established the principles. This includes defining the regions with the highest priority for implementation and determining the appropriate number of equipment installations.
The implementation of peatland restoration is necessary to be able to be monitored in terms of its effectiveness in keeping the groundwater at the required levels. Groundwater level is the height of the groundwater level in peatland as measured from the peat surface to the peat groundwater level. One of the successes of peat restoration is if the damaged and dry peatland has become wet again, which means it has a water content reaching 0.4 meters from the surface. How do we monitor the groundwater level? The groundwater level can be monitored using a special infrastructure, namely, the groundwater level monitoring infrastructure (GWLMI). The GWLMI is also an infrastructure or instrument installed to monitor the hydrological conditions of a Peatland Hydrological Unit (PHU).
The agreement is provided for each Hydrological Response Unit (HRU), which is different from PHU. The Peatland Hydrological Unit, referred to as Kesatuan Hidrologi Gambut in Indonesian language (KHG), is the Peat Ecosystem which is located between 2 (two) rivers, between the river and the sea and/or in a swamp. The Hydrological Response Unit (HRU) is the location where the GWLMI is built. The HRU is the smallest peat restoration management unit that has the same hydrological characteristics and is limited by peat ridges and/or canals that influence the water system in the sub-KHG or KHG area. While a river borders a KHG, HRUs are bordered by canals.
The GWLMI are situated and spread out at the targeted. The government of Indonesia, through the BRGM, has more than 150 infrastructures to monitor the groundwater level at priority locations throughout seven provinces in Indonesia. The GWLMI may consist of several components, including (a) sensor for measuring rod or water level, (b) soil moisture sensor, (c) rainfall sensor, (d) data loggers and/or (e) other supporting equipment. A team was assigned to build the GWLMI Installation: First comes first, the team carries out a field validation to ensure the suitability of the GWLMI installation location, by paying attention to, among other things, accessibility, security, mobile network, and local community approval.
The emphasis is likely determined based on several parameters that represent the peatland’s condition and the equipment’s need. These parameters measured include the density of channels, soil moisture, the extent of forest and land fires, and whether the peatland is swallow or deep peat. Different scoring will result in different priorities for the needed equipment, with the highest score defining the top priority for implementation. The one that receives the highest score will be defined as the highest priority for application. An example of the result of this method is shown in Table 1.
Code
Regency
District
Village
BRG_630708_01
Hulu Sungai Tengah
Batang Alai Utara
Haur Gading
BRG_630805_01
Hulu Sungai Utara
Amuntai Tengah
Pinang Habang
BRG_630805_02
Hulu Sungai Utara
Amuntai Tengah
Mawar Sari
BRG_631104_01
Balangan
Batu Mandi
Mantimin
brg16
Hulu Sungai Utara
Banjang
Pulau Damar
BRG_630411_01
Barito Kuala
Kuripan
Jambu
BRG_630611_01
Hulu Sungai Selatan
Daha Barat
Baru
BRG_630804_01
Hulu Sungai Utara
Danau Panggang
Sungai Namang
BRG_630801_01
Hulu Sungai Utara
Amuntai Selatan
Murung Panggang
Table 1.
The gauges properties around South Kalimantan peatland areas.
In Table 1, researchers can observe that nine pieces of equipment were installed around South Kalimantan, and this number may change based on the recent evaluation of new scoring for the region.
Building the GWLMIs to monitor the peatland groundwater level is part of the Government of Indonesia’s efforts to restore the degraded peatlands. The activities of BRGM include building infrastructure for rewetting the degraded peatlands such as canal-blockings, deep wells, and back-filling to stop canals from draining the peatland. Revegetation has also been conducted by BRGM to prevent peatland decomposition and reduce the emissions through land cover improvement. BRGM also provides economic incentives for local communities that contribute to protecting the surrounding peatland and utilize the wet peatland without draining it. BRGM also facilitates the operation of weather modification techniques to develop artificial rain during the dry season.
3.2 Water tale elevation data presentation
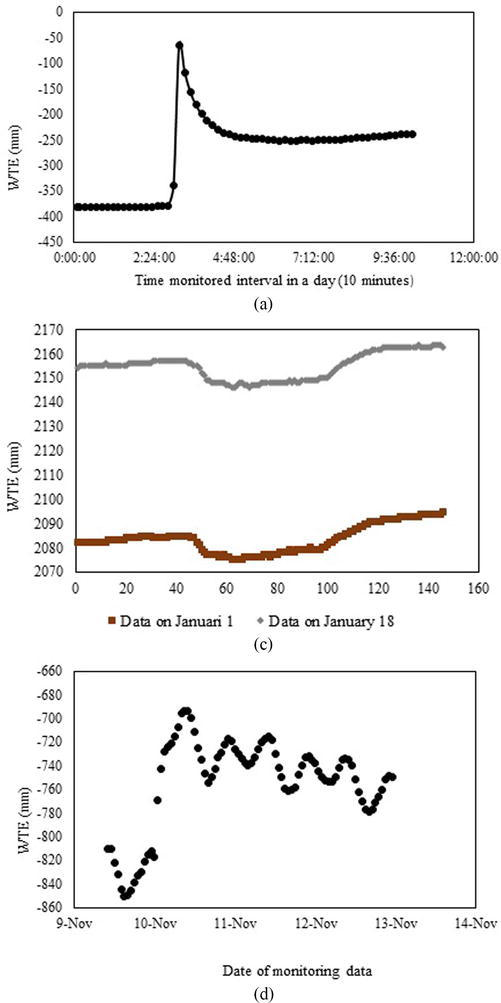
Water table elevation (WTE) has been defined as an essential indicator for a peatland. It determines the condition of the peatland and has become a focal point of research. Some researchers who conducted studies in this field covered degraded and undegraded peatlands [10, 14, 15, 16, 17] and accepted it as a parameter that needs to be continuously monitored. As a variable, it is presented in various ways, either in interval monitoring or presenting methodology. Observation intervals can range from 10 minutes to 24 hours, so the way to present depends on the data provided. Researchers have utilized intervals of 10 minutes, 15 minutes, 30 minutes, and 1 hour [9, 10, 16, 18]. Different intervals have also been used, such as 3 hours [16], daily [2, 19], weekly and monthly [14, 15], and three times a month [19]. The data can be visualized in Figure 6a and b.
Figure 6.
(a) WTE fluctuation in a day with 10-minute interval monitoring. (b) WTE fluctuation in a day with 10-minute interval monitoring at Padang Island. (c) WTE fluctuation during the study with 1-hour interval monitoring.
The interval data in Figure 6a and b show a relatively flat trend as it represents a condition on a particular day. However, slight variations can be observed within short time frames. For instance, in Figure 6a, the WTE started to increase at 03.20 and then remained relatively stable without significant fluctuations. Furthermore, the rain gauge data indicated that there was rainfall at 03.10. Additionally, these figures can be used to illustrate the rainfall-WTE relationships as well as the flow generated-WTE connection. The short-interval data can also reveal the generated flow and its influence on WTE [18, 20]. A similar pattern is evident in Figure 6b and c. It can be noticeable that data from different days exhibits similar trends. Consequently, it can be concluded that daily WTE tends to remain stable, except when influenced by rainfall events.
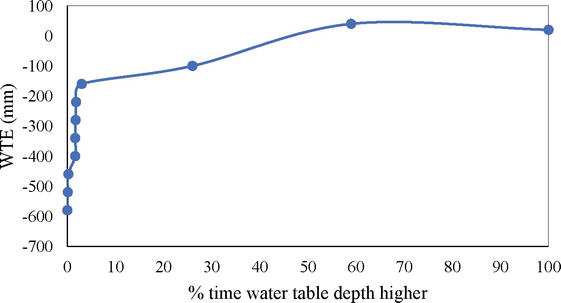
The number of data points within a specific interval can be presented as water table frequency, representing the percentage of data recorded. The water table frequency in Barito Kuala at Jambu Gauge compared to government regulations, which stipulate a maximum of 400 mm, can be seen in Figure 7.
Figure 7.
Water table frequency curves of Jambu Gauge in Barito Kuala, South Kalimantan.
Figure 7 shows that water table elevation may reach depths of up to 580 cm, which could pose a high risk. However, since it occurred in less than 2% of cases, it was scarce and may not be considered dangerous. The results showed that even though the maximum depth is very low, it generally complies with the government requirement of a maximum depth of 40 cm below the surface. Depths exceeding 40 cm occur in less than 5% of cases. When compared to the previous study on Padang Island [10], which was also conducted in tropical areas, the results indicated better conditions. In Padang Island, even in the Forest Zone area, the percentage of WTE exceeding the government regulations reached up to 80%. Several specific conditions may determine the condition of both.
Padang Island in Riau Province is an area where large companies operate their businesses and manage some industrial plantations that serve as a source of pulp paper. This situation significantly impacts water table elevation (WTE), causing it to become deeper in the vicinity of the company despite the area being undisturbed. In contrast, Barito Kuala in South Kalimantan is engaged in a different type of business: palm oil, where four palm oil corporations operate in the area and experiences shallower WTE due to the absence of companies engaged in the same business as Padang Island, which is pulp paper. The result showed that in Padang Island, WTE exceeding 40 cm occurs more than 80%, while in South Kalimantan, it is less than 2%, and the interval in between reaches more than 70%. Nevertheless, besides the land use factor, other hydrology factors can contribute to this difference. Therefore, a comprehensive study needs to be conducted to reveal the cause of these hydrology changes.
Water table elevation can be used to observe its reaction to rainfall and flow. These phenomena can be seen in previous studies [10, 18]. They conducted their research in different peatlands, which are tropical and sub-tropical, yet they show the same phenomenon: the WTE responded to rainfall quite quickly, increasing as it generated flow. Both studies concluded that tropical and sub-tropical peatlands share the characteristic that the initial WTE and land moisture levels determine the responses of the WTE.
3.3 Parameters in peatlands and the interconnectivity
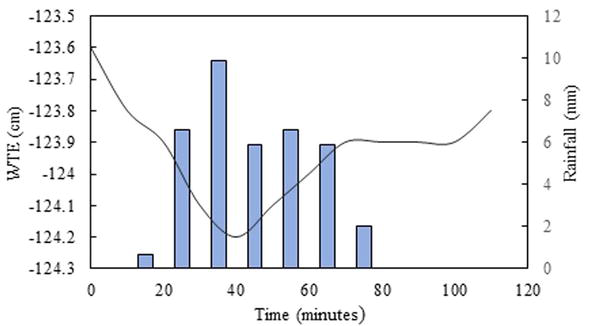
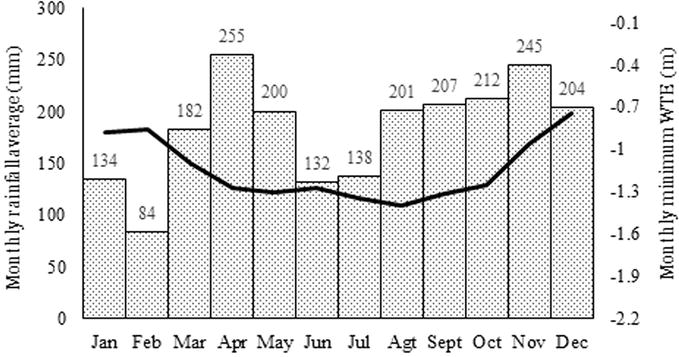
Hydrology parameters in wetlands, including peatlands, can serve as indicators of overall wetland conditions. Therefore, it would be interesting to understand how they reflect the peatland conditions. Hydrology parameters cover rainfall, water table elevations, evapotranspiration, surface and sub-surface flow, and flow hydrographs [2, 21, 22, 23]. Several approaches can be used to define the condition of peatlands. Some researchers define it by calculating a drought index to assess the likelihood of fire occurrence possibility in peatlands, while others describe it through time and spatial map water table elevation or the frequency of water table depth intervals [2, 24, 25]. Another way to illustrate the role of water table elevation is to explore its connection to vegetables [26, 27, 28]. There is no single definition for its role. Sphagnum, a natural vegetation, has been found to have a significant relationship with WTE [26, 29]. However, other plantations, such as Acacia Crasicarpa, which are human-planted, also exhibit this relationship without significant differences from natural forests. Furthermore, different vegetation remains the main indicator: water table elevation fluctuation [14, 30]. The relationship between rainfall and water table elevation can be observed across a wide range of scenarios, such as comparing monthly rainfall with maximum and average WTE values in the same month [2]. However, this relationship can manifest rapidly, as depicted in Figure 8.
Figure 8.
Relationship between intensity and WTE in rainfall event on October 8, 2019, in Padang Island.
As the data was expressed in a short period, the relationship can be seen in a very detailed time; it can be concluded that WTE responds to the rainfall range between 30 and 50 minutes to be constant, indicating significant fluctuations in the WTE during rainfall events. It becomes saturated in a very short time. This connection is not limited to presenting short-term data during specific rainfall events; it can also be observed every month, as illustrated in Figure 9.
Figure 9.
Relationship between monthly rainfall average and monthly minimum WTE in Padang Island.
There is a time difference between the occurrence of minimum rainfall in February and the minimum groundwater level in August, indicating the interval between when rain reaches its minimum and when groundwater level reaches its minimum. A similar phenomenon was observed in the previous research [31] conducted by Putra and Hayasaka [31] on the peatlands of Sebangau, Central Kalimantan, where an interval between the occurrence of minimum rainfall and minimum groundwater level elevation was noted, specifically in August and October. Still, the interval was smaller than the results of this research. The similarity is that there is an interval between the minimum rain and the minimum WTE, even though the gaps are different.
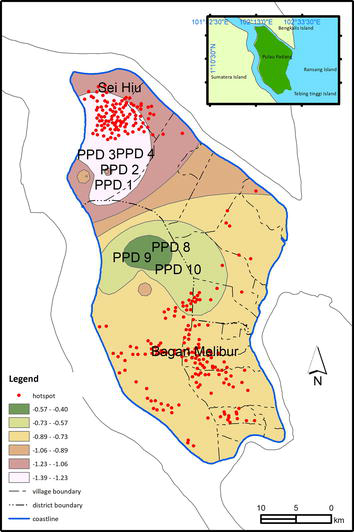
3.4 The relationship between water table elevation and fire hotspots
Another way to identify the relationship parameters can be presented by depicting the WTE distribution along the whole KHG and putting the hotspot area to analyze how much the WTE impacts fire in a peatland, as shown in Figure 10. WTE can be a sign of a drying situation in peatlands. Regarding the fire in 2014, the fire hotspot showed fire distribution in Padang Island, where the fire hotspot data is downloaded from the National Oceanic and Atmospheric Administration (NOAA) website. Based on the water table elevation variability, it is assumed that the lower table elevation (the furthest from the surface) will have a higher fire risk. The minimum WTE data are from the study between 2015 and 2017, while fire occurred in 2014. Nevertheless, the WTE can be assumed to show the general status of peatland dryness. The combined fire hotspots and the minimum WTE in Padang Island during the study can be presented in Figure 10.
Figure 10.
Fire hotspot in 2014 in minimum WTE during the time study.
Figure 10 shows that, in general, the fire happened in the expected area, but in a particular area, the fact was the reverse. On the northern island of Padang Island, the value of WTE was minimal, with more than 1 meter under the surface and the hotspots centered there. PPDs are the name for the location of water table elevation gauges. PPD 3 and PPD 4, which are adjacent to Sei Hiu, have been affected by a small fire hotspot, even though both are natural forests. On the other hand, in the middle of the island, PPD 8, the buffer zone with very high WTE, which is sometimes saturated above the soil surface, has no fire hotspots, as presumed.
A similar situation happened to PPD 9, which is the Industry Plantation area. As the WTE was relatively low, we can observe that there were no hotspots in PPD 9, although it is the Industry Plantation area. Besides, it was laid next to the buffer zone, which had no fire hotspots. Unlike PPD 10, it is a natural forest with WTE, which is categorized the same as PPD 9. More explanation about how this PPD1 until PPD 10 related conditions can be found in a previous study [10].
Research in tropical peatlands required some specific approaches regarding their condition. This includes preparing practical equipment to be installed and gathering information about the local community. The connection with the community will determine the sustainability of the research, even if it may not seem directly related to the study. The type of equipment that can be installed depends on the available funding and the purpose of the data. If the study aims to explain the phenomenon in a term interval, it will require automatic data recording using a data logger at minute-level granularity. However, when attempting to describe the trends over daily or monthly intervals with limited funding, manual equipment that requires data to be recorded by an individual can be a viable alternative. Water table elevation (WTE) data, as a crucial parameter in peatlands, can be recorded at various intervals, including minutes, hours, days, and even months, depending on its intended use. WTE can also be an indicator of peatland conditions and the possibility of fire. Every interval data recording can be used for different purposes, so recognizing the study purposes and the limitations will make the research sustainable.
References
1.Vitt DH. Peatlands in Jorgensen SE, Fath BD, editors. Encyclopedia of Ecology. Elsevier B.V. 2008;5:2656-2664
2.Amal N, Helda N, Rusdiansyah A, et al. Analysis of hydrology parameters in a tropical wetland as an early approach to identify a drought risk in a peatland area. IOP Conference Series: Earth and Environmental Science. 2022. DOI: 10.1088/1755-1315/999/1/012011
3.Murdiyarso D, Lilleskov E, Kolka R. Tropical peatlands under siege: The need for evidence-based policies and strategies. Mitigation and Adaptation Strategies for Global Change. 2019;24(4):493-505
4.Page SE, Siegert F, Rieley JO, Boehm HDV, Jaya A, Limin S. The amount of carbon released from peat and forest fires in Indonesia during 1997. Nature. 2002;420(6911):61-65
5.Page S, Hosciło A, Wösten H, Jauhiainen J, Silvius M, Rieley J, et al. Restoration ecology of lowland tropical peatlands in Southeast Asia: Current knowledge and future research directions. Ecosystems. 2009;12(6):888-905
6.Ohkubo S, Hirano T, Kusin K. Influence of fire and drainage on evapotranspiration in a degraded peat swamp forest in Central Kalimantan, Indonesia. Journal of Hydrology. 2021;603(PA):126906. DOI: 10.1016/j.jhydrol.2021.126906
7.Putra EI. The effect of the precipitation pattern of the dry season on peat fire occurrence in the mega Rice project area, Central Kalimantan, Indonesia. Tropics. 2011;19(4):145-156
8.Taufik M, Veldhuizen AA, Wösten JHM, van Lanen HAJ. Exploration of the importance of physical properties of Indonesian peatlands to assess critical groundwater table depths, associated drought and fire hazard. Geoderma. 2018;2019(347):160-169
9.Ismail I, Haghighi AT, Marttila H, Kurniawan U, Karyanto O, Kløve B. Water table variations on different land use units in a drained tropical peatland island of Indonesia. Hydrology Research. 2021;52(6):1372-1388
10.Amal N, Sujono J, Jayadi R, Ohgushi K. Variability of water table elevation and flow response of tropical peatland case study at Pulau Padang, Riau, Indonesia. Lowland Technology and International. 2021;22(4):135-141
11.Susanti A, Karyanto O, Affianto A, Ismail PS, Aditya T, et al. Jurnal Ilmu Kehutanan. Jurnal Ilmu Kehutanan. 2017;11(1):29-42
12.BRG-LKFT. Laporan Akhir Riset Pengelolaan Sumber Daya Air di Pulau Padang-Final Report Study of Water Resources in Padang Island. Yogyakarta, Indonesia: Universitas Gadjah Mada; 2017
13.Arifin YF, Hamidah S, Fakhrurazi. Kajian Teknis Analisis Daya Dukung Hutan Lindung Kota Banjarbaru-Technical Study on Carrying Capacity Analysis of Banjarbaru City Protected Forests. Final Report. Lambung Mangkurat University; 2018
14.Astiani D, Burhanuddin B, Curran LM, Mujiman M, Salim R. Effects of drainage ditches on water table level, soil conditions and tree growth of degraded peatland forests in West Kalimantan. Indonesian Journal of Forestry Research. 2017;4(1):15-25
15.Putra E, Cochrane MA, Vetrita Y, et al. Determining critical groundwater level to prevent degraded peatland from severe peat fire. IOP Conference Series: Earth and Environmental Science. IOP Publishing. 2018. DOI: 10.1088/1755-1315/149/1/012027
16.Putra SS, Holden J, Baird AJ. The effects of ditch dams on water-level dynamics in tropical peatlands. Hydrological Processes. 2021;35:1-17
17.Swails E, Yang X, Asefi S, Hergoualc’h K, Verchot L, RE MR, et al. Linking soil respiration and water table depth in tropical peatlands with remotely sensed changes in water storage from the gravity recovery and climate experiment. Mitigation and Adaptation Strategies for Global Change. 2019;24(4):575-590
18.Daniels SM, Agnew CT, Allott TEH, Evans MG. Water table variability and runoff generation in an eroded peatland, south Pennines, UK. Journal of Hydrology. 2008;361(1-2):214-226. DOI: 10.1016/j.jhydrol.2008.07.042
19.Ritzema H, Limin S, Kusin K, Jauhiainen J, Wösten H. Canal blocking strategies for hydrological restoration of degraded tropical peatlands in Central Kalimantan, Indonesia. Catena. 2014;114:11-20. DOI: 10.1016/j.catena.2013.10.009
20.Amal N, Sujono J, Jayadi R. Water Table Variability and Flow Response of Tropical Peatland—A Case Study. In 3rd World Irrigation Forum (WIF3), Bali, Indonesia, 2019 International Commision on Irrigation and Drainage (ICID). 2019. pp. 1-10
21.Schempf J. Wetland Classification, Inventory, and Assessment Methods: An Alaska Guide to their Fish and Wildlife Application, Technical Report. Alaska Department of Fish and Game. Habitat Division. 1992. Technical Report 93-2.
22.Amal N. Analisis Karakteristik dan Formulasi Rawa dengan Pendekatan Variabel Hidrologi Rawa-Analysis of Wetland Characteristics and Formulation using the Wetland Hydrology Variable Approach. Info Teknik. 2021;22(1):99-116
23.Hanson A, Swanson L, Ewing D, Grabas G, Meyer S, Ross L, et al. Wetland ecological functions assessment: An overview of approaches [Internet]. An Overview of Approaches. Canadian Wildlife Service Technical Report Series No. 497. Atlantic Region. 2008
24.Novitasari N, Sujono J, Harto S, Maas A, Jayadi R. Drought index for peatland wildfire management in Central Kalimantan, Indonesia during el niño phenomenon. Journal of Disaster Research. 2019;14(7):939-948
25.Wösten JHM, Clymans E, Page SE, Rieley JO, Limin SH. Peat-water interrelationships in a tropical peatland ecosystem in Southeast Asia. Catena. 2008;73(2):212-224
26.Breeuwer A, Robroek BJM, Limpens J, Heijmans MMPD, Schouten MGC, Berendse F. Decreased summer water table depth affects peatland vegetation. Basic and Applied Ecology. 2009;10(4):330-339. DOI: 10.1016/j.baae.2008.05.005
27.Haapalehto TO, Vasander H, Jauhiainen S, Tahvanainen T, Kotiaho JS. The effects of peatland restoration on water-table depth, elemental concentrations, and vegetation: 10 years of changes. Restoration Ecology. 2011;19(5):587-598
28.Limpens J, Holmgren M, Jacobs CMJ, Van Der Zee SEATM, Karofeld E, Berendse F. How does tree density affect water loss of peatlands? A mesocosm experiment. PLoS One. 2014;9:1-11
29.Kim J, Rochefort L, Hogue-Hugron S, Alqulaiti Z, Dunn C, Pouliot R, et al. Water table fluctuation in peatlands facilitates fungal proliferation, impedes sphagnum growth and accelerates decomposition. Frontiers in Earth Science. 2021;8(April):1-9
30.Evans MG, Burt TP, Holden J, Adamson JK. Runoff generation and water table fluctuations in blanket peat: Evidence from UK data spanning the dry summer of 1995. Journal of Hydrology. 1999;221(3-4):141-160
31.Putra EI, Hayasaka H. The effect of the precipitation pattern of the dry season on peat fire occurrence in the mega rice project area, central Kalimantan, Indonesia. Tropics; 2011;19:145-156
Written By
Nilna Amal and Didy Wurjanto
Submitted: 12 February 2024Reviewed: 17 February 2024Published: 04 April 2024